
 ?Mathematical formulae have been encoded as MathML and are displayed in this HTML version using MathJax in order to improve their display. Uncheck the box to turn MathJax off. This feature requires Javascript. Click on a formula to zoom.
ABSTRACT
N6-methyladenosine (m6A) is the most predominant RNA epigenetic regulation in eukaryotic cells. Numerous evidence revealed that m6A modification exerts a crucial role in the regulation of tumor microenvironment (TME) cell infiltration in several tumors. Nevertheless, the potential role and mechanism of m6A modification in nasopharyngeal carcinoma (NPC) remains unknown. mRNA expression data and clinical information from GSE102349, and GSE53819 datasets obtained from Gene Expression Omnibus (GEO) was used for differential gene expression and subsequent analysis. Consensus clustering was used to identify m6A-related molecular patterns of 88 NPC samples based on prognostic m6A regulators using Univariate Cox analysis. The TME cell-infiltrating characteristics of each m6A-related subclass were explored using single-sample gene set enrichment (ssGSEA) algorithm and CIBERSORT algotithm. DEGs between two m6A-related subclasses were screened using edgeR package. The prognostic signature and predicated nomogram were constructed based on the m6A-related DEGs. The cell infiltration and expression of prognostic signature in NPC was determined using immunohistochemistry (IHC) analysis. Chi-square test was used to analysis the significance of difference of the categorical variables. And survival analysis was performed using Kaplan–Meier plots and log-rank tests. The NPC samples were divided into two m6A-related subclasses. The TME cell-infiltrating characteristics analyses indicated that cluster 1 is characterized by immune-related and metabolism pathways activation, better response to anit-PD1 and anti-CTLA4 treatment and chemotherapy. And cluster 2 is characterized by stromal activation, low expression of HLA family and immune checkpoints, and a worse response to anti-PD1 and anti-CTLA4 treatment and chemotherapy. Furthermore, we identified 1558 DEGs between two m6A-related subclasses and constructed prognostic signatures to predicate the progression-free survival (PFS) for NPC patients. Compared to non-tumor samples, REEP2, TMSB15A, DSEL, and ID4 were upregulated in NPC samples. High expression of REEP2 and TMSB15A showed poor survival in NPC patients. The interaction between REEP2, TMSB15A, DSEL, ID4, and m6A regulators was detected. Our finding indicated that m6A modification plays an important role in the regulation of TME heterogeneity and complexity.
Introduction
Nasopharyngeal carcinoma (NPC) is a subtype of head and neck tumor, which is an epithelial carcinoma that originates from nasopharyngeal mucosal lining and is different from other head and neck tumors.Citation1 Based on the morphologic characteristics, NPC is divided into epithelial carcinoma (EC), sarcomatoid carcinoma (SC), mixed sarcomatoid-epithelial carcinoma (MSEC), and squamous cell carcinoma (SCC).Citation2 NPC is a rare tumor comparison with other tumors worldwide, which is 129,079 new cases and 73,987 deaths in 2018.Citation3 However, the distribution of NPC unevenly around the world, which highly occurs in east and southeast Asia, with 113,659 (85.5%) new cases in Asia, and 62,44 (46.8%) in China in 2020.Citation3–5 The geographical distribution of NPC is also extremely unbalanced in China, higher in South China than in other regions.Citation6 Even with advanced regimens, such as liquid biopsies, minimally invasive surgery, radiotherapy, chemotherapy, and immunotherapy widely used for NPC treatment,Citation7–9 approximately 10–20% of NPC patients suffer recurrence after primary treatment.Citation10,Citation11 Also, the asymptomatic nature of NPC hinders the early diagnose of NPC. NPC is a heterogeneous tumor with complexity contributed to the risk factors including genomic variations, Epstein-Barr virus (EBV) infection, smoking, diet, gender, environmental, and other clinical characteristics.Citation12,Citation13 Therefore, finding the novel marker is of important in the early diagnose and treatment of NPC.
Tumor microenvironment (TME) consists of cancer cells, variation immune cells, stromal cells, bone marrow-derived cells, and they secreted cytokine, chemokines, and growth factors,Citation14 and is characterized by hypoxia, high oxidation, acidity, malnutrition, and inflammation because of the heterogenous of cells in TME.Citation15,Citation16 TME associates to hall makers of cancer,Citation17 radio-/chemoresistance,Citation18,Citation19 immune evasion and immunotherapeutic response,Citation20 tumor progression and recurrence,Citation21 and prognosis.Citation22 When it refers to NPC, NPC has the most severe stromal infiltration compared to other solid tumors, and the pathological status might alter cellular composition in the NPC microenvironment.Citation23 Liu et al.Citation24 found that in EBV-induced NPC, the cell infiltration of CD8+ T cells cells and NK cells were limited. In contrast, regulatory T cells (Treg), M2 macrophage, and B cells can promote tumor cell proliferation by inhibiting the activity of CD8+ T cells and promote metastasis, while tumor endothelial cells (TEC) and cancer-associated fibroblasts (CAF) were increased. TME exert a important role in tumor growth and development and its composition needs to be investigated in more depth.
N6-methyladenosine (m6A) is an RNA modification in eukaryotic cells, which emerges as a widespread regulatory mechanism, such as regulating RNA transcription, processing, splicing, degradation, translation, export, and stability in diverse physiological processes.Citation25,Citation26 M6A modified on RNA is dynamically regulated by m6A regulators that contain adenosine methyltransferases (RBM15, ZC3H13, METTL3, METTL14, WTAP, and KIAA1429), m6A-binding proteins (YTHDF1/2/3, YTHDC1/2, HNRNPA2B1, LRPPRC, FMR1), and demethylases (FTO and ALKBH5), as known as writers, readers, and erasers.Citation26,Citation27 Increasing shreds of evidence strongly indicate that m6A modification acts as a dominant role in regulating tumor progression, chemoresistance, immunotherapeutic response, and prognosis.Citation28–31 M6A modification has been proved that significantly associated with tumorigenesis, metastasis, and progression.Citation32,Citation33 M6A modification plays a nonnegligible role in the diversity and complexity of TME.Citation34,Citation35 Interaction between m6A modification and TME mediates the biological processes of cancer cells, immune cells, and stromal cells to influence tumor initiation, progression, and therapy responses.Citation36–38 Understanding the interaction between m6A modification and TME is of great significance to developing effective therapeutic strategies and estimating the prognosis. Although some researches have revealed the role of m6A modification in tumorigenesis, progression, and therapy response,Citation39–41 the systematic analysis of the interaction between m6A modification and TME in NPC remains unclear.
In the present study, we systematically collected mRNA and corresponding clinical information of NPC patients to identify the m6A-related molecular patterns in NPC explored the TME cell infiltrating characteristics, and predicated the therapeutic response for each subclass. Moreover, we also constructed an m6A-related prognostic risk model and identify the prognostic signature, then developed a predicated nomogram to predicate progression-free survival (PFS) for NPC patients. Our finding might provide the potential biomarkers for NPC diagnosis and treatment, and supply the evidence for managing the therapeutic strategy.
Methods
Data downloading and processing
mRNA expression data of NPC patients of two datasets, GSE102349, and GSE53819 datasets, were obtained from Gene Expression Omnibus (GEO, https://www.ncbi.nlm.nih.gov/geo/). The mRNA expression data of the GSE102349 dataset (Submission date: Aug 08, 2017, Last update date: May 15, 2019, data retrieval: Jan 08, 2022)Citation42 was generated using Illumina HiSeq 2000, this dataset includes mRNA expression data and clinical information from 113 NPC patients, and 88 cases with progression-free survival (PFS) involved in this study. And the mRNA expression data of the GSE53819 dataset (Submission date: Jan 04, 2014, Last update date: Aug 01, 2019, data retrieval: Jan 08, 2022)Citation43 was generated using Agilent -014,850 Whole Human Genome Microarray 4 × 44K G4112F, and this dataset contained 18 NPC primary tumor tissues and 18 non-cancerous nasopharyngeal tissues.
Construction of prognosis-related signature based on 21 m6A regulators
Univariate Cox analysis was performed with survival R package to identify the m6A regulators with prognostic significance in NPC, the significant m6A regulators were identified using univariate Cox analysis of PFS with P-value <.05. Here, 21 m6A regulators, including 8 writers (METTL3, METTL14, RBM15, RBM15B, WTAP, KIAA1429, CBLL1, ZC3H13), 2 erasers (ALKBH5, FTO), and 11 readers (YTHDC1, YTHDC2, YTHDF1, YTHDF2, YTHDF3, IGF2BP1, HNRNPA2B1, HNRNPC, FMR1, LRPPRC, ELAVL1), were involved in this conducted.
Identification and validation of the molecular subclusters
The unsupervised class was a powerful technique in cancer research, and the consensus clustering methods were used for estimating the number of unsupervised classes in a dataset.Citation44 The consensus clustering was performed using the consensusClusterPlus package in R to conduct the classification in the GSE102349 dataset (88 NPC patients) according to their expression profiles of prognosis-related m6A regulators. The k value was determined with consistent cumulative distribution function (CDF) reached an approximate maximum, that represented the optimal number of clusters. T-Distributed Stochastic Neighbor Embedding (t-SNE) is a non-linear dimensionality reduction method with minimum structural information loss and is widely used for bioinformatics.Citation45 In this study, t-SNE was performed to validate the subtype assignments using mRNA expression data of GSE102349 and GSE53819 datasets. Moreover, a Submap matrix was conducted to detect the similarity of molecular classes from GSE102349 and GSE53819 datasets.Citation46 In addition, differential expression of the 10 m6A regulators between subclusters was detected and visualized using pheatmap package in R.
Gene set variation analysis (GSVA) for function enrichment
GSVA is a Gene set enrichment (GSE) method that estimates variation pathway and biological processes activity over a sample population in a non-parametric and unsupervised method.Citation47 Here, we conducted the GSVA using GSVA package in R to investigate the various biological function among distinct m6A subclasses. The Kyoto Encyclopedia of Genes and Genomes (KEGG) pathway gene set (c2.cp.kegg.v7.4.symbols.gmt) and 50 human cancer gene sets (h.all.v7.4.symbols.gmt) were downloaded from Molecular Signatures Database (MSigDB, data retrieval: Jan 08, 2022, https://www.gsea-msigdb.org/gsea/msigdb/index.jsp), Biological process gene set (c5.go.bp.v7.4.symbols.gmt) was downloaded from Gene Ontology (GO) database (data retrieval: Jan 08, 2022, http://geneontology.org/), and pathway gene set (c2.cp.reactome.v7.4.symbols.gmt) was obtained from Reactome pathway database (data retrieval: Jan 08, 2022, https://reactome.org/). Besides, we also obtained the gene sets that related to CD8 T effector, DNA damage repair, Nucleotide excision repair from MSigDB, and a previous study.Citation48 Above gene sets were performed GSVA to identify the enriched biological processes and pathways. Finally, the various biological processes and pathways between distinct subclusters were determined by Wilcox rank-sum or Kruskal–Wallis tests. Adjusted P-value <.05 was considered statistically significant.
Estimate tumor immune cell infiltration
We used the ESTIMATE algorithm to estimate the composition of the tumor microenvironment (TME).Citation49 The ratio of the immune cells and stromal cells in the TME was quantized with the immune score and stromal score. The differences between distinct subclasses were detected by Wilcox rank-sum or Kruskal–Wallis tests. In addition, we used the single-sample gene set enrichment (ssGSEA) algorithmCitation50 to estimate TME immune cell infiltration according to the marker genes of 24 immune cell types.Citation51 And the relative abundance of each cell infiltration was quantized by conducting ssGSEA using GSVA package in R. the variation between m6A-related subclusters were examined by Wilcox rank-sum or Kruskal–Wallis tests. Also, gene expression data from GSE102349 was used to assess the relative abundance of 22 immune infiltration in two subclasses. Also, the the difference in immune cell infiltration was tested using the Wilcoxon test, and the difference was considered significant when p < .05.
Evaluation of the response for immunotherapy of each subclass
Human leukocyte antigen (HLA) genes and immune checkpoints exert a key role in response for immunotherapy. in this study, we detected the expression of HLA genes (HLA-A/B/C/E/F/G/DRB1/DQB1/DQA1/DPB1/DRA/DRB5/DPA1/DMA/DMB/DQA2/DOA/DQB2/DOB) and immune checkpoints (IDO1, PD-L1 (CD274), PD-L2 (PDCD1LG2), TIM-3 (HAVCR2), PD-1 (PDCD1), CTLA-4, CD80, CD86) between m6A-related subclasses. Furthermore, tumor immune dysfunction and exclusion (TIDE) and the SubMap algorithm were used to predict the immune response to checkpoint inhibitors PD-1 and CTLA4 in distinct m6A-related subclasses. TIDE is a computational method to predicate the immune checkpoint blocked (ICB) response based on two primary mechanisms of tumor immune evasion, including the induction of T cell dysfunction in tumors with high cytotoxic T lymphocytes (CTL) levels and the prevention of T cell infiltration in tumor with low CTL level.Citation52 The TIDE score reflects the efficiency of the immunotherapeutic outcome, high TIDE score indicates a poor treatment response rate.Citation53 Moreover, the Submap mapping was used to compare the response for anti-PD-1 and anti-CTLA4 treatment between m6A-related subclusters. P-value <.05 and Bonferroni corrected P-value <.05 considered statistically significant.
Evaluation of the response for chemotherapy of each subclass
We also investigated the chemotherapy response rate using pRRophetic package in R. According to the Genomics of Drug Sensitivity in Cancer (GDSC) database (https://www.cancerrxgene.org/),Citation53 pRRophetic algorithm was conducted to identify the antitumor drugs from 138 common antitumor drugs using Ridge’s regression with the half-maximum inhibitory concentration (IC50) of each patient. The low IC50 value indicated a high response for chemotherapy.
Characterization of m6A-based subclasses in NPC
The differentially expressed genes (DEGs) among NPC subclasses were identified using edgeR package with parameters of |log2 (fold change, FC) |>1 and FDR < 0.05. ggplot2 and pheatmap R packages were used to visualize the DEGs among NPC subclasses.
Biofunction enrichment of DEGs of m6A-based subclass
GO and KEGG pathway enrichment was conducted using clusterProfiler package in R with P-value <.05 or q-value <0.05. GO annotation included biological process (BP), molecular function (MF), and cellular components (CC) terms.
Construction of the m6A-related gene signature and risk model
88 samples in the GSE102394 dataset were divided into a training set and test set at a 7:3 ratio. The expression data of DEGs among m6A-related subclasses and their corresponding clinical information were used for univariate Cox and Kaplan–Meier analyses with P-value <.05. Then, the m6A-related genes related to prognosis were identified using LASSO regression analysis using glmet package in R. The penalty parameter (λ) of the model was confirmed by ten-fold cross-validation. To estimate the prognostic value of the above prognostic signature, the risk score of the training set, test set, and whole set was calculated according to the formula: , coef represented the risk coefficient of each gene, expr represented an expression of each gene. All samples of the training set, test set, and whole set were divided into the high-risk score and low-risk score groups according to the median risk score. Kaplan–Meier analysis with log-rank test was used to compare the PFS between high-risk score and low-risk score groups. And the time-dependent receiver operating characteristic (ROC) curve was constructed using the survivalROC R package to estimate the accuracy of the prognostic model. The area under curve (AUC) have reflected the accuracy of the ROC result.
Development of a nomogram for prognosis predicating
A nomogram predicted model was constructed based on the risk factors using rms package in R. and the prediction accuracy of the nomogram was estimated using the calibration curve. Moreover, we also investigated the correlation between prognostic factors and m6A regulators using Pearson correlation analysis. And P-value < 5 and correlation coefficient > 0.3 considered significant correlation.
Gene Set Enrichment Analysis (GSEA)
Single gene GSEA was conducted in accordance with KEGG (c2.cp.kegg.v2022.1.Hs.entrez.gmt) gene sets in GSEA database (http://www.gsea-msigdb.org/gsea/msigdb, data retrieval: Nov 10, 2023) using clusterProfilerj and org.Hs.eg.db package in R script. The sample was classified as high- and low-gene expressed group referred to the expression of REEP2, TMSB15A, DSEL, and ID4, and spearman correlation was calculated between the expression of m6A-related prognostic signature and other genes in the dataset. The pathway was selected when padjust < 0.05 and |NES| > 1, and TOP 10 pathways for each gene was selected according to padjust.
Transcription factor (TF) prediction
REEP2, TMSB15A, DSEL, and ID4 was entered into NetworkAnalyst Database (https://www.networkanalyst.ca/NetworkAnalyst/, data retrieval: Nov 10, 2023), and JASPER database was for TFs prediction was selected. Cytoscape (version 3.9.1) was used to plot the interaction network of hub genes and TFs.
Clinical samples
A total of 255 primary NPC samples and adjacent normal nasopharyngeal samples were collected from the First Affiliated Hospital of Kunming Medical University. None of the patients had received chemotherapy or radiotherapy before surgery. All patients involved in this study were known the purposes of this study and wrote the informed consent. Our study was approved by the Ethics Committee of the First Affiliated Hospital of Kunming Medical University. The clinical characteristics of these patients were summarized in . All samples were quickly frozen in liquid nitrogen and used for subsequent experiments.
Table 1. Clinical characteristics of the NPC patients.
Immunohistochemistry (IHC)
Paraffin sections were deparaffinized and hydrated with xylene and gradient concentration of ethanol (100%, 95%, 85%, and 70%). Then, antigen retrieval was achieved by boiling the sections in 10 mM sodium citrate for 10 min in a microwave oven. The sections were then washed with PBS three times and treated with 3% H2O2-methanol for 15 min. Immunostaining was performed by incubation with antibody against DSEL (1:150, NBP2–56370, Novus Biologicals), ID4 (1:100, LS‑B9923, Lsbio), REEP2 (1:100, bs -15,198 R, bioss), TMSB15A (1:100, sc -271,649, Santa Cruz Biotechnology), CD20 (1:150, ab78237, abcam), CD27 (1:250, ab131254, abcam), CD68(1:250, ab131254, abcam) CD4 (1:100, ab133616, abcam), CD45RO (1:100, ab23, abcam), CD8 (1:100, ab23, abcam) for 2 h. The sections were subsequently incubated with secondary antibody labeled with horseradish peroxidase for 30 min at room temperature. Cells with brown cytoplasm were counted as positive cells.
Statistical analysis
In this study, all statistical analyses and visualized were performed using R software version 3.4.4 and GraphPad Prism 8 software. The continuous variables were shown as mean ± standard deviation (SD), Chi-square test was used to analysis the significance of difference of the categorical variables. And survival analysis was performed using Kaplan–Meier plots and log-rank tests. p-value <.05 was considered statistical significance.
Results
Construction of two m6A-related subclasses in NPC
The systematic analyses of this study have been illustrated in . We obtained the mRNA expression files and corresponding clinical information of 88 NPC patients from the GEO database. Twenty-one m6A regulators were identified in this study from the above dataset. According to the results of Univariate Cox, we found 10 regulators (IGF2B1, ALKBH5, YTHDF2, ELAVL1, WTAP, LRPPRC, HNRNPA2B1, CBLL1, RBM15B, YTHDF1) significantly associated with PFS (, ). Therefore, we clustered NPC patients into different subclasses according to the expression of the 10 m6A regulators who with prognostic values. As shown in and Figure S1A, all patients in the GSE102349 dataset were divided into two distinct subclasses based on the molecular pattern of m6A regulators by consensus clustering, including cluster 1 (64 patients) and cluster 2 (24 patients). The clinical characteristics of 88 patients from the GSE102349 dataset were shown in . T-SNE was performed to validate the above clustering by reducing the dimension of the feature, resulting in that the distinct assignment similar to consensus clustering (). Besides, we performed the clustering analysis in another independent dataset (GSE53819), the results indicated that there are also two distinct subclasses of NPC in the GSE53819 dataset (Figure S1B). And the t-SNE results are concordant with consensus clustering results (). Moreover, a SubMap analysis was conducted to validate the correlation between the subclasses from different datasets, the results indicated that C1 and C2 subclasses in the GSE102349 dataset were significantly correlated with the subclasses in the GSE53819 dataset (, Figure S1C). These results suggested that there were two distinct subclusters of NPC with the different m6A regulator patterns. We also found 10 m6A regulators upregulated in cluster 2 compared with cluster 1 (, Table S1). Kaplan-Meier PFS indicated the clinical relevance of m6A regulators of two m6A-based subclasses in NPC, suggesting that NPC patients belong to cluster 2 with poor prognosis than the patients in cluster 1 ().
Figure 1. Construction of two m6A-related subclasses in NPC A. The workflow of this study. B. Forest plot showing the results of the Univariate Cox regression analysis between m6A regulators and PFS. C. Consensus matrices of the GSE102349 dataset for k = 2. D-E. T-SNE analyses show the stratification into two m6A-related subclasses of GSE102349 and GSE53819 datasets. F. Submap matrix analysis validated the similarity of molecular classes from GSE102349 and GSE102349 datasets.G. The expression of 10 prognostic-related m6A regulators (IGF2B1, ALKBH5, YTHDF2, ELAVL1, WTAP, LRPPRC, HNRNPA2B1, CBLL1, RBM15B, YTHDF1) between two m6A-related subclasses. H. Kaplan-meier survival plot showing the PFS between two m6A-related subclasses.
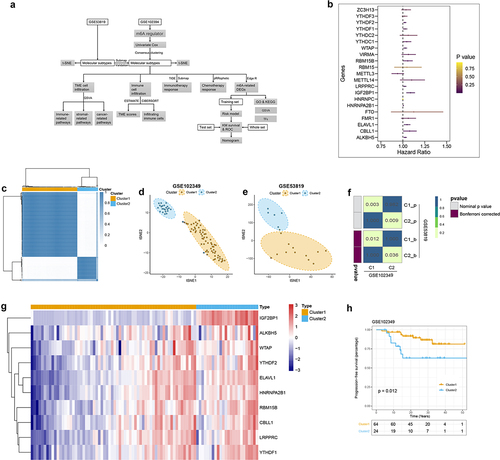
Table 2. Identification of 21 m6A regulators with prognostic significance in the GSE102349 dataset based on Univariate Cox analysis.
Table 3. Clinical characteristics of NPC patients from GSE102349 dataset in distinct subclasses.
Characteristics analysis of TME cell infiltration in two m6A-related subclasses
GSVA was performed to investigate variation pathways among distinct m6A subclasses. We firstly explored the pathways enriched in each subclass, as shown in and Table S2, there were distinct pathways enriched in two m6A-related subclasses. The special genes of cluster 1 were primarily enriched in 46 pathways, most of those pathways were immune-related pathways and some metabolism pathways. The significant immune-related pathways which enriched in immune-related pathways included the B cell receptor signaling pathway, T cell receptor signaling pathway, chemokine signaling pathway, natural killer cell-mediated cytotoxicity, and Toll-like receptor signaling pathway, antigen processing, and presentation. And the metabolism pathways included fatty acid metabolism, beta-alanine metabolism, tyrosine metabolism cytochrome P450, porphyrin, and chlorophyll metabolism. However, the special genes of cluster 2 enriched in 14 pathways, including the stromal and tumorigenic pathways, such as ECM receptor interaction, Wnt signaling pathway, adheres junction, Hedgehog signaling pathway. These results indicated that stromal activation in cluster 2 might inhibit the antitumor effects of immune cells and increase immune escape. Whereas immune-related pathways activation in cluster 1 might imply the sensitivity to antitumor therapy. Moreover, we also identify 301 pathways enriched in cluster 1 and 211 pathways enriched in cluster 2 based on Reactome database (Table S3), that accordance to above results which were the special genes of cluster 1 primarily enriched in immune-related pathways and the special genes of cluster 2 mostly enriched in stromal-related pathways.
Figure 2. Characteristics analysis of tme cell infiltration in two m6a-related subclasses a. heatmap showing gsva enrichment analysis of the various pathways between two m6a-related subclasses. b. heatmap showing gsva enrichment analysis of the biological processes between two m6a-related subclasses.C. heatmap showing gsva enrichment analysis of 50 hallmark cancer-related pathways between two m6a-related subclasses.D. heatmap showing gsva enrichment analysis of oncogenic and TME cell-infiltrating related pathways between two m6a-related subclasses.E. boxplot showing the distinction of oncogenic and TME cell-infiltrating related pathways between two m6a-related subclasses.
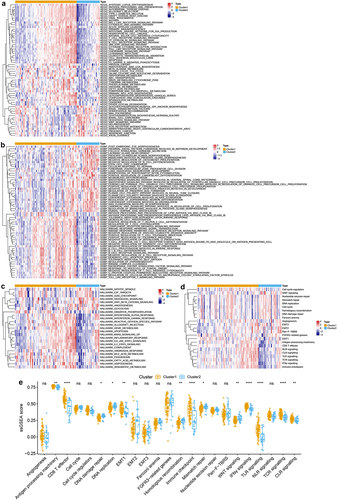
Additionally, GO enrichment analysis was performed using GVSA, resulting in the special genes of cluster 1 enriched in immune-related biological processes, such as antigen processing and presentation endogenous lipid antigen via MHC class IB, B cell differentiation, T cell activation, immune response, positive regulation of macrophage chemotaxis, positive regulation of T help 2 cell differentiation, etc. Inversely, the special genes of cluster 2 enriched in negative regulation of B cell differentiation, stem cell fate commitment, etc. (, Table S4).
We further explored the correlation between m6A-related molecular patterns and 50 Hallmark cancer-related pathways, and we found that the special genes of cluster 1 mostly enriched in 18 pathways, such as interferon-alpha/gamma (INF-α/γ) response, IL-6/JAK/STAT3 signaling pathway, inflammatory response, IL2/STAT5 signaling pathway, KRAS signaling activation, apoptosis, reactive oxygen species (ROS) pathway, androgen response, peroxisome, oxidative phosphorylation, and fatty acid, heme, bile acid, xenobiotic metabolism pathways (, Table S5). Whereas the special genes of cluster 2 in riced in 7 pathways, including mitotic spindle, glycolysis, G2M checkpoint, E2F target, Wnt-β/catenin signaling pathway, Hedgehog signaling pathway, angiogenesis (, Table S5).
TME consists of tumor cells, diverse immune and stromal cells, which have been reported to the significance in predicting patient outcomes and treatment efficacy.Citation54 Therefore, we investigated the important biological pathways in TME, including epithelial-mesenchymal transition (EMT), angiogenesis, Wnt signaling pathway, and CD8 T effector, DNA damage repair, and nucleotide excision related pathways from previous research.Citation48 And the results showed that the special genes of cluster 1 enriched in CD8 T effector, TLR signaling, TCR signaling, immune checkpoint, INF-γ, antigen processing machinery, CLR signaling, and EMT1 pathways. However, the special gene of cluster 2 enriched in Homologous recombination, Wnt signaling, DNA damage repair pathways (, Table S6). These results suggested that cluster 1 might elucidate high immunoreactivity, but cluster 2 might imply high immunosuppression in TME.
Immune infiltration characterization in two m6A-related subclasses
Based on previous analyses, we further explored the immune landscape of m6A-related subclasses in NPC. We obtained the ImmuneScore, StromalScore, and ESTIMATEScore of each sample, resulting in ImmuneScore and StromalScore being higher in cluster 1 than cluster 2 (, Table S7). We further used ssGSEA to identify the distinction of the infiltrating immune cells in two m6A-related subclasses. Twenty-four immune cell types were divided into two subclusters and shown in and Table S8, we observed that B cells, CD8 T cells, cytotoxic cells, dendritic cells (DCs), eosinophils, immature DCs (iDCs), mast cells, NKCD56dim cells, plasmacytoid DCs (pDCs), T cells, T helper cells, central memory T (Tcm) cells, effector memory T (Tem) cells, follicular helper T (TFH) cells, T help (Th) 1 cell, Th17 cells, Treg cells increased cluster 1 compared to cluster 2, whereas natural killer (NK) cells and Tgd cells elevated in cluster 2 than cluster 1. These results showed that there were significant differences in immune cells between two m6A-related subclasses, which suggested that m6A modification is associated with the immune landscape in NPC.
Figure 3. Immune infiltration characterization in two m6A-related subclasses a-c. Violin plot indicating stromal score, immune score and estimate score between two m6A-related subclasses. d. Heatmap showing the TME cell infiltrating between two m6A-related subclasses. e. Boxplot showing distinct TME cell infiltrating between two m6A-related subclasses. f. The staked abundance of immune cells between two m6A-related subclasses. g. Differences in immune cells between two m6A-related subclasses.
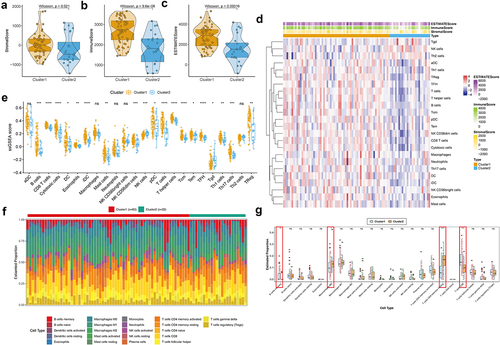
Also, the differences in the immune status of m6A-related subclasses in NPC was assessed by the CIBERSORT algorithm. The stacked abundance of 22 immune cells was showed in . As result, B cells memory and T cells CD8 were more enriched in cluster 1 than cluster 2, while Macrophage M0 and T cells CD4 memory resting were less enriched in cluster 1 than cluster 2 (, Table S8). The infiltration of the co-exist immune cells from two immune infiltration analysis, i.e. B cells memory (CD20 and CD27),Citation55 T cells CD8 (CD4 and CD 8), Macrophage M0 (CD68) and T cells CD4 memory resting (CD4 and CD45RO)Citation56 was detected by IHC in tumor and corresponding para-tumor tissues. The positive rate of CD4, CD45RO, and CD68 was higher, while the positive rate of CD20, CD27 and CD8 was lower in tumor tissues than those in corresponding non tumor tissues, which was coincident with the result of immune infiltration analysis (Figure S3).
Correlation of the two m6A-related subclasses and the immunotherapy responses
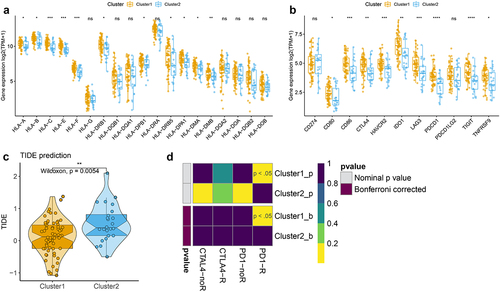
According to the previous results, we speculated that cluster 1 was clustered as immune activation phenotype, and cluster 2 was clustered as immune suppression phenotype. Thus, we further test the expression of HLA family and immune checkpoints between two m6A-related subclasses, and the results indicated that HLA-A/B/C/E/F/DRB1/DPB1/DRB5/DPA1/DMA/DMB high expression in cluster 1 than cluster 2 (, Figure S4, Table S9), as well as the expression of CD80, CD86, CTLA4, HAVCR2, IDO1, LAG3, PDCD1, TIGIT, TNFTSF9 upregulated in cluster 1 compared to cluster 2 (, Table S10). We further detected the TIDE score and found a low TIDE score in cluster 1, but a high TIDE score in cluster 2 (, Table S11). We also compare the response to immunotherapy between two clusters by Submap, the results indicated that the patients in cluster 1 showed a better response to anit-PD1 and anti-CTLA4 treatment (). These findings suggested that the patients in cluster 1 may respond better to immunotherapy treatment.
Figure 4. Correlation of the two m6A-related subclasses and the immunotherapy responses a. Boxplot indicating the distinct expression of HLA genes (HLA-A/B/C/E/F/G/DRB1/DQB1/DQA1/DPB1/DRA/DRB5/DPA1/DMA/DMB/DQA2/DOA/DQB2/DOB) between two m6A-related subclasses. b. Boxplot indicating the distinct expression of immune checkpoints (IDO1, PD-L1 (CD274), PD-L2 (PDCD1LG2), TIM-3 (HAVCR2), PD-1 (PDCD1), CTLA-4, CD80, CD86) between two m6A-related subclasses. c. Violin plot indicating TIDE score between two m6A-related subclasses. D. Submap matrix analysis showing response to checkpoint inhibitors PD-1 and CTLA4 in between two m6A-related subclasses.
Correlation of the two m6A-related subclasses and chemotherapy response
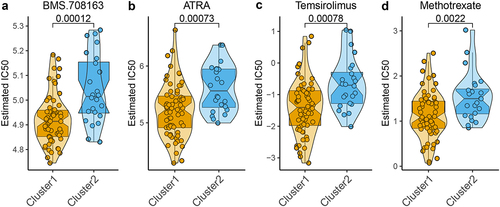
Since m6A molecular patterns of NPC are associated with the response of treatment and clinical outcome, the relationship between m6A-related subclasses and chemotherapeutic efficacy was explored. We performed Ridge’s regression to predicate the sensitivity of each sample of two subclasses to 139 common chemotherapeutic drugs. The IC50 values were calculated and demonstrated that the patients in cluster 1 showed a better response to 17 chemotherapeutic drugs, including BMS.708163, ATRA, Temsirolimus, Methotrexate, BMS.536924, AKT inhibitor III, RDEA119, PF.02341066, DMOG, CI.1040, Bryostatin.1, AICAR, PD.0332991, Lenalidomide, NVP.TAE684, AZD6244, and LFM.A13 (Figure S3), especially BMS.708163, ATRA, Temsirolimus, Methotrexate (). These findings indicated that m6A modification affected the chemotherapeutic outcome in NPC.
Figure 5. Correlation of the two m6A-related subclasses and chemotherapy response a-d. Violin plot showing IC50 value of BMS.708163, ATRA, temsirolimus, and methotrexate for each patient from two m6A-related subclasses.
Identification of the DEGs and their function enrichment in two m6A-related subclasses
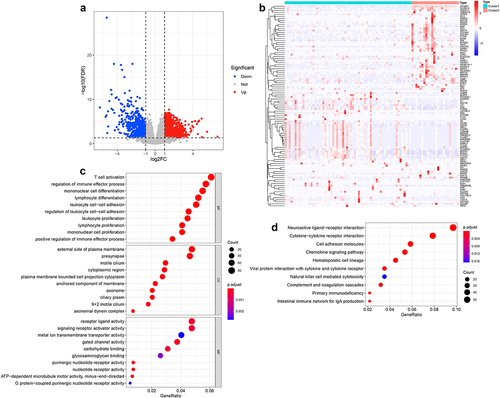
To further explore the potential regulatory mechanism of m6A modification in NPC, we identified 1558 DEGs (928 upregulated and 630 downregulated) between two m6A-related subclasses (, b, Table S12). And GO analysis indicated that the biological processes of those DEGs mainly involved in biological behaviors, such as immune cell T cell activation, regulation of immune effector process, mononuclear cell, lymphocyte, leukocyte, lymphocyte, mononuclear cell proliferation, leukocyte cell, or regulation of leukocyte cell–cell adhesion, positive regulation of immune effector process (, Table S13). And the CC terms enrichment included the external side of the plasma membrane, presynapse, motile cilium, cytoplasmic region, plasm membrane-bounded cell projection cytoplasm, the anchored component of membrane, axoneme, ciliary plasm, motile cilium, axonemal dynein complex (, Table S13). Besides, the molecular function of those DEGs involved in receptor-ligand, signaling receptor activator, metal ion transmembrane transporter, gate channel, purinergic nucleotide receptor, nucleotide receptor, and G-protein-coupled purinergic nucleotide receptor activity, carbohydrate and glycosaminoglycan binding, and ATP-dependent microtubule motor activity, minus-end-directed (, Table S13). Moreover, KEGG pathway enrichment analysis indicated that those DEGs significantly enriched in 16 pathways, most of them were immune-related pathways, such as hematopoietic cell lineage, cytokine-cytokine receptor interaction, viral protein interaction with cytokine and cytokine receptor, chemokine signaling pathway, complement and coagulation cascades, the intestinal immune network for IgA production, natural killer cell-mediated cytotoxicity, and other pathways, such as cell adhesion molecules, calcium signaling pathway, Metabolism of xenobiotics by cytochrome P450 (, Table S14). These results suggested that m6A modification affected tumor progression of NPC mainly through modulating immune-related pathways.
Figure 6. Identification of the DEGs and their function enrichment in two m6A-related subclasses a. Volcano plot showing the DEGs between two m6A-related subclasses. b. Heatmap showing the DEGs between two m6A-related subclasses. c. Bubble plot indicating the GO enrichment of DEGs between two m6A-related subclasses, including top 10 biological processes (BP), top 10 cellular components (CC), and top 10 molecular functions (MF) terms. d. Bubble plot indicating the KEGG pathways enrichment of DEGs between two m6A-related subclasses.
Identification of m6A-related prognostic signature in NPC
We constructed the prognostic signature using univariate Cox and LASSO regression analyses to determine the prognostic value of m6A-related DEGs in the training set from the GSE102349 dataset. As shown in , 160 DEGs have been found associated with PFS. LASSO regression analysis was then
Table 4. Univariate Cox regression analysis of m6A-related DEGs associated to survival in GSE102349 dataset.
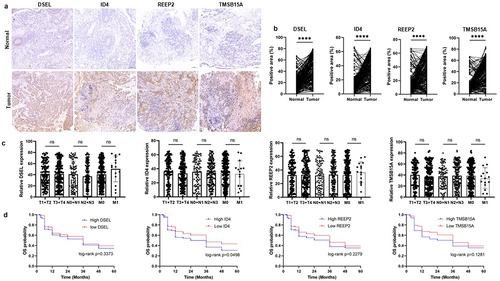
performed to reduce the number of DEGs (). And REEP2, TMSB15A, DSEL, and ID4 were screed out and used to construct the risk model (). Then, the risk score of each sample in the training set, test set, and the whole set was calculated (Table S15–17), and all samples of each set were divided into a high-risk score and low-risk score groups, and the high-risk score associated to high mortality rate both in training, test, and whole sets (). Then, Kaplan-Meier curves were plotted with log-rank test and ROC curves to detect the sensitivity and specificity of the risk score to predicate PFS. Kaplan–Meier curves predicated the poor survival rate of patients with the high-risk score than patients with low-risk score (). Moreover, ROC curves showed high sensitivity and specificity of a risk score to predicate PFS of NPC patients, the AUC was 0.988, 0.879, 0.784 at 1, 2, 3-year in the training set, the AUC was 0.829, 0.802, 0.802 at 1, 2, 3-year in the test set, the AUC was 0.915, 0.861, 0.772 at 1, 2, 3-year in whole set (). These results indicated and encouraged the sensitivity and reliability of the risk model for prognostic predicting. We also collected the NPC samples to validate the expression of m6A-related prognostic signature (DSEL, ID4, REEP2, and TMSB15A) in NPC. As shown in , DSEL, ID4, REEP2, and TMSB15A were upregulated in the NPC samples compared with the non-tumor samples. However, the expression of DSEL, ID4, REEP2, and TMSB15A not related the tumor progression (). In addition, the Kaplan–Meier curves indicated that high expression of ID4 showed poor survival than low expression of ID4 in NPC (). These data indicated that DSEL, ID4, REEP2, and TMSB15A could be used as the biomarkers for NPC.
Figure 7. Identification of m6A-related prognostic signature in NPC A. Least absolute shrinkage and optimal LASSO coefficients of the 160 DEGs. B. Determination of the number of factors by the LASSO regression analysis. C. The sheet of showing the LASSO coefficients of four genes (REEP2, TMSB15A, DSEL, and ID4). D-F. The differences between high-risk score and low-risk score groups both in the training set, test set, and whole set. Upper: the distribution of risk core. Middle: the survival status of patients both in the high-risk score and low-risk score groups. Bottom: heatmap showing expression of m6A-related prognostic signature both in the high-risk score and low-risk score groups. G-I. Kaplan-Meier survival plot showing the PFS between high-risk score and low-risk score groups in the training set, test set, and the whole set. J-L. ROC curves indicate the 1-, 2-, 3-years survival of NPC patients both in the training set, test set, and whole set.
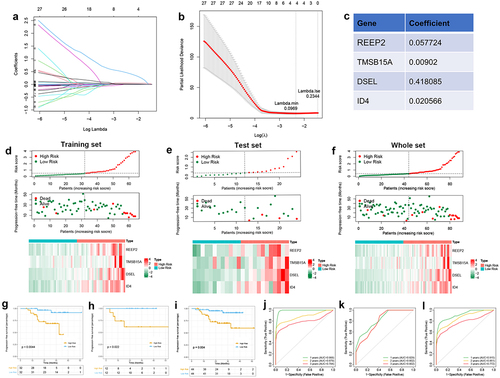
Figure 8. Validation of the expression of the DSEL, ID4, REEP2, and TMSB15A in NPC. a-b. IHC analyses of the levels of DSEL, ID4, REEP2, and TMSB15A in NPC samples (n = 255) compared with non-tumor samples (n = 255) (scale bars = 100 μm). c. Correlation between the levels of DSEL, ID4, REEP2, and TMSB15A and TNM stages. d. Kaplan-meier curves showing the OS of the NPC patients with high- and low-expression of DSEL, ID4, REEP2, and TMSB15A. ****, p < .0001.
Development of a predicated model for NPC
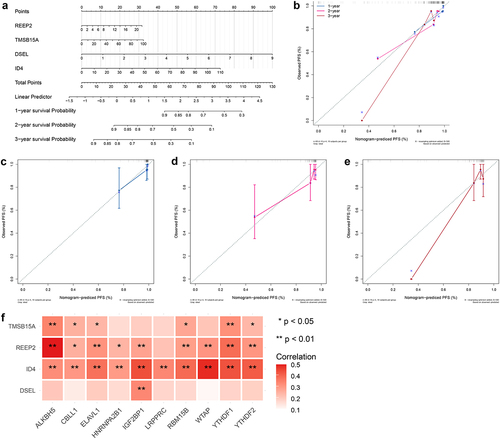
To further validate the predictive accuracy prognostic signature, we developed a nomogram to predicate the survival probability at 1, 2, 3 years. As shown in , a high total score was calculated to predicate the poor survival probability at 1, 2, 3 years. And calibration curves were plotted to evaluate the accuracy and specificity of the prognostic nomogram, and the plots showed that the prediction lines of 1, 2, 3-year survival closed to the observation lines (), suggesting that the excellent accuracy of the prognostic nomogram. In addition, Pearson’s correlation analysis was performed to test the relationship between prognostic signature and m6A regulators, resulting in ID4 positively related to 10 m6A regulators, REEP2 positively related to 9 m6A regulators excepted LRPPRC, TMSB15A positively related to ALKBH5, CBLL1, ELAVL1, RBM15B, YTHDF1, YTHDF2, and DSEL positively related to IGF2BP1 (). These results indicated that m6A modification of prognostic signature might affect the clinical outcome of NPC patients.
Figure 9. Development of a predicated model for NPC A. A predicating nomogram predicting PFS of NPC patients. B-E. Calibration plots assess the accuracy and specificity of the prognostic nomogram.F. Heatmap showing the correlation between prognostic signature and 10 m6A regulators.
GSEA and TFs prediction
To further investigate the signaling pathways and potential biological mechanisms for hub genes in NPC, GSEA was used. When threshold was set as padjust < 0.05 and |NES| > 1, DSEL was enriched in 49 KEGG items, with TOP 10 pathway as Allograft Rejection, Autoimmune Thyroid Disease, Intestinal Immune Network for IgA Production, Primary Immunodeficiency, Graft Versus Host Disease, Systemic Lupus Erythematosus, Hematopoietic Cell Lineage, ECM Receptor Interaction, Natural Killer Cell Mediated Cytotoxicity, T Cell Receptor Signaling Pathway (, , Table S19–20). ID4 was enriched in 21 KEGG items, with TOP 10 pathway as Graft versus host disease, Allograft rejection, Autoimmune thyroid disease, Primary immunodeficiency, Intestinal immune network for IgA production, Type I diabetes mellitus, Spliceosome, Basal cell carcinoma, Asthma, Wnt signaling pathway (, , Table S21–22). REEP2 was enriched in 12 items, with TOP 10 pathway as Graft Versus Host Disease, Allograft Rejection, Type I Diabetes Mellitus, Primary Immunodeficiency, Asthma, Basal Cell Carcinoma, Spliceosome, ECM Receptor Interaction, Wnt Signaling Pathway, Focal Adhesion (, , Table S23–24). TMSB15A was enriched in 18 items, with TOP 10 pathway as Graft Versus Host Disease, Autoimmune Thyroid Disease, Allograft Rejection, Type I Diabetes Mellitus, Intestinal Immune Network for IgA Production, Asthma, Primary Immunodeficiency, Cytosolic DNA Sensing Pathway, N Glycan Biosynthesis, Glycosaminoglycan Biosynthesis Chondroitin Sulfate (, , Table S25–26). Also, Transcription factors were predicted, a total of 21 TFs and 26 cooperative relationships between m6A-related prognostic signature and TFs was shown in , i.e. 4 for REEP2, 10 for ID4, 3 for DSEL, 8 for TMSB15A (Table S18).
Figure 10. GSEA and transcription factor prediction of DSEL, ID4, REEP2, and TMSB15A a. TOP 10 KEGG enrichment of GSEA for DSEL, b.TOP 10 KEGG enrichment of GSEA for ID4, c.TOP 10 KEGG enrichment of GSEA for REEP2, d.TOP 10 KEGG enrichment of GSEA for TMSB15A, e. Transcription factor prediction of DSEL, ID4, REEP2, and TMSB15A.
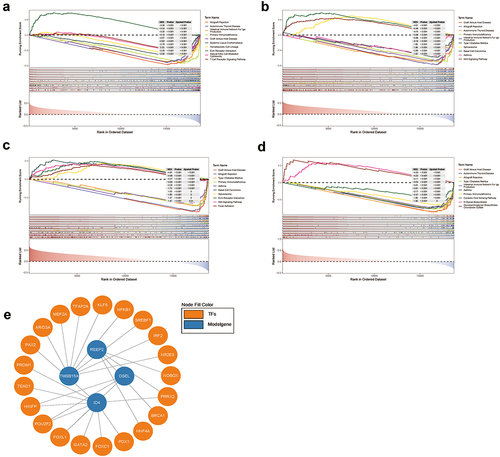
Table 5. TOP 10 KEGG enrichment of GSEA for DSEL.
Table 6. TOP 10 KEGG enrichment of GSEA for ID4.
Table 7. TOP 10 KEGG enrichment of GSEA for REEP2.
Table 8. TOP 10 KEGG enrichment of GSEA for TMSB15A.
Discussion
In this study, NPC patients were clustered as the two m6A-related molecular patterns based on 21 m6A regulators expression. And the characteristics of each cluster analysis indicated that cluster 1 associated immune activation and cluster 2 was associated with stromal activation. And the special genes of cluster 1 are involved in the immune-related pathways and metabolism pathways, and the special genes of cluster 2 are involved in the stromal-related pathways and tumorigenic pathways. The immune-related pathways involved in cluster 1 included the B cell receptor signaling pathway, T cell receptor signaling pathway, chemokine signaling pathway, natural killer cell-mediated cytotoxicity, and Toll-like receptor signaling pathway, antigen processing, and presentation. B and T cells are the key players of the adaptive immune system and are recognized and activated by the B cell receptor (BCR) and T cell receptor (TCR).Citation57 BCR acts as a key role at multiple checkpoints of B cell biology,Citation58 and the BCR signaling pathway exerts a crucial role in normal B cell development and adaptive immunity, targeting BCR signaling may have anticancer activity beyond B cell malignancies.Citation59 TCR signaling pathway plays a central role in the control of T cell differentiation, homeostasis, and function, which regulate immune homeostasis and autoimmunity.Citation60–63 Additionally, chemokine signaling pathway, natural killer cell-mediated cytotoxicity, and toll-like receptor signaling pathway, antigen processing, and presentation work in TME by trafficking and modulating immune cell proliferation, migration, activation, differentiation, and homing.Citation64–67 Those immune activation-related pathways enriched in cluster 1, elucidate high immunoreactivity in cluster 1. Nevertheless, the special genes of cluster 2 enriched in stromal-related pathways, such as ECM receptor interaction, Wnt signaling pathway, adheres junction, Hedgehog signaling pathway. ECM is a noncellular component of TME stromal that forms as a scaffold in the tumor and responds to promoting tumor aggression.Citation68 The Wnt signaling pathway is a high conserved signaling pathway that involves embryonic, organ development, and cancer progression.Citation69 Wnt signaling activation is associated with stromal cell activation, such as cancer stem cells (CSCs) and cancer-associated fibroblasts (CAFs).Citation70–72 Hedgehog (Hh) signaling pathway also acts as an essential role in maintaining CSC self-renewal and tumor progression, targeted treatment of Hh signaling pathway emerges the novel therapeutic strategy in a wide range of solid cancers.Citation73,Citation74 Therefore, we speculated that cluster 2 of NPC patients might associate with antitumor immunosuppress.
Numerous pieces of evidence have highlighted that m6A modification exerts an indispensable role in regulating the immune system by maintaining the naïve and pluripotent status of immune cells.Citation75 Crosstalk between m6A modification and the immune system has the great significance to discover novel pathogenic mechanisms and to conduct promising therapeutic targets for tumors.Citation76 M6A modification involvement in immune modulation in tumors includes regulating innate and adaptive immune cellsCitation77 and anti-tumor immunity.Citation78 Therefore, we further investigated the immune landscape of m6A-related classes. And the results are consistent with the previous finding, B cells memory and T cells CD8 were more enriched in cluster 1 than cluster 2, while Macrophage M0 and T cells CD4 memory resting were less enriched in cluster 1 than cluster 2. ESTIMATE algorithm estimated ImmuneScore, StromalScore, and ESTIMATEScore of each sample, and results indicated that high ImmuneScore and StromalScore of cluster 1 than cluster 2. As known to us, the immune system can be recognized as an innate and adaptive immune system, that contributes to recognize and remove foreign pathogens and tumors.Citation79 Adaptive immunity mainly includes T and B lymphocytes, which harbor plenty of TCRs and BCRs, that respond to different antigens in the pathological process.Citation80 As expected, the immunotherapy response exploring indicated that the patients in the cluster exhibited a better response to anti-PD1 and anti-CTLA4 treatment. Additionally, we also found that the patients in cluster 1 were more sensitive to BMS.708163, ATRA, temsirolimus, and methotrexate. BMS.708163 is a gamma-secretase inhibitor and exerts antitumor effects in lung cancer by reversing EGFR inhibitor resistance,Citation81 but it currently has not been reported for NPC treatment. ATRA is an active metabolite of vitamin A and used as an effective antitumor in acute promyelocytic leukemia,Citation82 And emerges the antitumor effects in other tumors by a combination of ATRA with other agents, including chemotherapy, epigenetic modifiers, and others.Citation83 ATRA also has been demonstrated that exert the antitumor effects on NPC.Citation84 Temsirolimus is an mTOR inhibitor widely used in renal cell carcinoma and achieves good efficacy in the therapeutic course,Citation85 it can rarely use in NPC treatment. Methotrexate (MTX) is widely used for antitumor therapy in a variety of childhood and adult cancers,Citation86 it has been successfully treated NPC using an effective delivery method.Citation87
The DEGs between two m6A-related subclasses were identified and the mechanism analysis indicated that DEGs mainly enriched immune-related pathways, suggesting that m6A modification regulated tumor progression by modulating immune-related pathways. The m6A-related prognostic signature trained in the GEO dataset was included REEP2, TMSB15A, DSEL, and ID4. The prognostic risk model and predicated nomogram for NPC were construed to estimate the prognosis of NPC.
Conclusion
Taken together, our study demonstrated the significance of m6A modification in NPC by regulating TME. M6A modification patterns caused the heterogeneity and complexity of individual TME, resulting in different responses to therapy. Our findings contributed to our understanding of the pathogenic mechanisms of TME cell infiltrating and provided promising therapeutic targets for NPC. Although our research revealed the significance for understating and conducting treatment strategy of NPC, limitation of this study is small size of the NPC samples to validate the biomarkers, in the subsequent analyses, we will collect the larger NPC samples with corresponding clinical information to demonstrate our results.
Authors’ contributions
Lisha Peng analyzed the data. Lisha Peng performed collected the dataset and materials. Yong Wang and Lisha Peng wrote this manuscript. Feng Wang conceived and designed this work, also edited and revised the manuscript. All authors approved this manuscript.
Availability of data and materials
All data in this study can be obtained from the Gene Expression Omnibus (GEO, https://www.ncbi.nlm.nih.gov/geo/). The analytical methods can be found in the methods section. R scripts written for performing analyses in this study are shared via GitHub (https://github.com/DrWangfeng/nasopharyngeal-carcinoma). And the supplementary files have been shared via GitHub (https://github.com/DrWangfeng/Supplementary-files.git).
Ethics statement
All patients involved in this study were known the purposes of this study and wrote the informed consent. Our study was approved by the Ethics Committee of the First Affiliated Hospital of Kunming Medical University.
Supplemental Material
Download Zip (6.8 MB)Disclosure statement
No potential conflict of interest was reported by the author(s).
Supplementary material
Supplemental data for this article can be accessed online at https://doi.org/10.1080/15384047.2024.2333590
Additional information
Funding
References
- Chen YP, Chan ATC, Le Q-T, Blanchard P, Sun Y, Ma J. Nasopharyngeal carcinoma. Lancet. 2019;394(10192):64–21. doi:10.1016/S0140-6736(19)30956-0.
- Luo W, Yao K, Busson P. Molecular characterization and clinical implications of spindle cells in nasopharyngeal carcinoma: a novel molecule-morphology model of tumor progression proposed. PloS One. 2013;8(12):e83135. doi:10.1371/journal.pone.0083135.
- Bray F, Ferlay J, Soerjomataram I, Siegel RL, Torre LA, Jemal A. Global cancer statistics 2018: GLOBOCAN estimates of incidence and mortality worldwide for 36 cancers in 185 countries. CA Cancer J Clin. 2018;68(6):394–424. doi:10.3322/caac.21492.
- Ferlay J, Lam F, Colombet M, Mery L, Piñeros M, Znaor A, Soerjomataram I, Bray F. Global cancer observatory: cancer Today. Lyon, France: International Agency for Research on Cancer; 2020. https://gco.iarc.fr/today.
- Ferlay J, Colombet M, Soerjomataram I, Mathers C, Parkin DM, Piñeros M, Znaor A, Bray F. Estimating the global cancer incidence and mortality in 2018: GLOBOCAN sources and methods. Int J Cancer. 2019;144(8):1941–1953. doi:10.1002/ijc.31937.
- Wei KR, Zheng R-S, Zhang S-W, Liang Z-H, Li Z-M, Chen W-Q. Nasopharyngeal carcinoma incidence and mortality in China, 2013. Chin J Cancer. 2017;36(1):90. doi:10.1186/s40880-017-0257-9.
- Lam WKJ, Chan JYK. Recent advances in the management of nasopharyngeal carcinoma. F1000Res. 2018. 7:1829. doi:10.12688/f1000research.15066.1.
- Sun XS, Li X-Y, Chen Q-Y, Tang L-Q, Mai H-Q. Future of radiotherapy in nasopharyngeal carcinoma. Br J Radiol. 2019;92(1102):20190209. doi:10.1259/bjr.20190209.
- Zhang Y, Chen L, Hu G-Q, Zhang N, Zhu X-D, Yang K-Y, Jin F, Shi M, Chen Y-P, Hu W-H, et al. Gemcitabine and Cisplatin Induction Chemotherapy in nasopharyngeal carcinoma. N Engl J Med. 2019; 381(12):1124–1135. doi:10.1056/NEJMoa1905287.
- Lee AWM, Ng WT, Chan JYW, Corry J, Mäkitie A, Mendenhall WM, Rinaldo A, Rodrigo JP, Saba NF, Strojan P, et al. Management of locally recurrent nasopharyngeal carcinoma. Cancer Treat Rev. 2019; 79:101890. doi:10.1016/j.ctrv.2019.101890.
- Suárez C, Rodrigo JP, Rinaldo A, Langendijk JA, Shaha AR, Ferlito A. Current treatment options for recurrent nasopharyngeal cancer. Eur Arch Otorhinolaryngol. 2010;267(12):1811–1824. doi:10.1007/s00405-010-1385-x.
- Lee HM, et al. 2019. Current perspectives on nasopharyngeal carcinoma. Adv Exp Med Biol. 1164:11–34.
- Campion NJ, Ally M, Jank BJ, Ahmed J, Alusi G. The molecular march of primary and recurrent nasopharyngeal carcinoma. Oncogene. 2021;40(10):1757–1774. doi:10.1038/s41388-020-01631-2.
- Hinshaw DC, Shevde LA. The tumor microenvironment innately modulates cancer progression. Cancer Res. 2019;79(18):4557–4566. doi:10.1158/0008-5472.CAN-18-3962.
- Ding C, Shan Z, Li M, Chen H, Li X, Jin Z. Characterization of the fatty acid metabolism in colorectal cancer to guide clinical therapy. Mol Ther Oncolytics. 2021. 20:532–544. doi:10.1016/j.omto.2021.02.010.
- Tao J, Yang G, Zhou W, Qiu J, Chen G, Luo W, Zhao F, You L, Zheng L, Zhang T, et al. Targeting hypoxic tumor microenvironment in pancreatic cancer. J Hematol Oncol. 2021; 14(1):14. doi:10.1186/s13045-020-01030-w.
- Hanahan D, Weinberg RA. Hallmarks of cancer: the next generation. Cell. 2011;144(5):646–674. doi:10.1016/j.cell.2011.02.013.
- Barker HE, Paget JTE, Khan AA, Harrington KJ. The tumour microenvironment after radiotherapy: mechanisms of resistance and recurrence. Nat Rev Cancer. 2015;15(7):409–425. doi:10.1038/nrc3958.
- Da Ros M, De Gregorio V, Iorio A, Giunti L, Guidi M, de Martino M, Genitori L, Sardi I. Glioblastoma Chemoresistance: the Double Play by microenvironment and blood-brain barrier. Int J Mol Sci. 2018;19(10):19(10. doi:10.3390/ijms19102879.
- Tauriello DVF, Palomo-Ponce S, Stork D, Berenguer-Llergo A, Badia-Ramentol J, Iglesias M, Sevillano M, Ibiza S, Cañellas A, Hernando-Momblona X, et al. TGFβ drives immune evasion in genetically reconstituted colon cancer metastasis. Nature. 2018; 554(7693):538–543. doi:10.1038/nature25492.
- Madden EC, Gorman AM, Logue SE, Samali A. Tumour cell secretome in chemoresistance and tumour recurrence. Trends Cancer. 2020;6(6):489–505. doi:10.1016/j.trecan.2020.02.020.
- Ren B, Cui M, Yang G, Wang H, Feng M, You L, Zhao Y. Tumor microenvironment participates in metastasis of pancreatic cancer. Mol Cancer. 2018;17(1):108. doi:10.1186/s12943-018-0858-1.
- Gong L, Kwong DLW, Dai W, Wu P, Wang Y, Lee AWM, Guan X-Y. The stromal and immune landscape of nasopharyngeal Carcinoma and its implications for precision medicine targeting the tumor microenvironment. Front Oncol. 2021. 11:744889. doi:10.3389/fonc.2021.744889.
- Liu H, Tang L, Li Y, Xie W, Zhang L, Tang H, Xiao T, Yang H, Gu W, Wang H, et al. Nasopharyngeal carcinoma: current views on the tumor microenvironment’s impact on drug resistance and clinical outcomes. Mol Cancer. 2024; 23(1):20. doi:10.1186/s12943-023-01928-2.
- Zhang L, Hou C, Chen C, Guo Y, Yuan W, Yin D, Liu J, Sun Z. The role of N(6)-methyladenosine (m(6)A) modification in the regulation of circRnas. Mol Cancer. 2020;19(1):105. doi:10.1186/s12943-020-01224-3.
- Yang Y, Hsu PJ, Chen Y-S, Yang Y-G. Dynamic transcriptomic m(6)A decoration: writers, erasers, readers and functions in RNA metabolism. Cell Res. 2018;28(6):616–624. doi:10.1038/s41422-018-0040-8.
- Meyer KD, Jaffrey SR. The dynamic epitranscriptome: N6-methyladenosine and gene expression control. Nat Rev Mol Cell Biol. 2014;15(5):313–326. doi:10.1038/nrm3785.
- Lin Z, Niu Y, Wan A, Chen D, Liang H, Chen X, Sun L, Zhan S, Chen L, Cheng C, et al. RNA m 6 a methylation regulates sorafenib resistance in liver cancer through FOXO 3-mediated autophagy. EMBO J. 2020; 39(12):e103181. doi:10.15252/embj.2019103181.
- Wang L, Hui H, Agrawal K, Kang Y, Li N, Tang R, Yuan J, Rana TM. M 6 a RNA methyltransferases METTL3/14 regulate immune responses to anti-PD-1 therapy. EMBO J. 2020;39(20):e104514. doi:10.15252/embj.2020104514.
- Xu S, Tang L, Dai G, Luo C, Liu Z. Expression of m6A regulators correlated with immune microenvironment predicts therapeutic efficacy and prognosis in gliomas. Front Cell Dev Biol. 2020. 8:594112. doi:10.3389/fcell.2020.594112.
- Li N, Kang Y, Wang L, Huff S, Tang R, Hui H, Agrawal K, Gonzalez GM, Wang Y, Patel SP, et al. ALKBH5 regulates anti–PD-1 therapy response by modulating lactate and suppressive immune cell accumulation in tumor microenvironment. Proc Natl Acad Sci U S A. 2020; 117(33):20159–20170. doi:10.1073/pnas.1918986117.
- Zheng ZQ, Li Z-X, Zhou G-Q, Lin L, Zhang L-L, Lv J-W, Huang X-D, Liu R-Q, Chen F, He X-J, et al. Long noncoding RNA FAM225A promotes nasopharyngeal carcinoma tumorigenesis and metastasis by acting as ceRNA to sponge miR-590-3p/miR-1275 and upregulate ITGB3. Cancer Res. 2019; 79(18):4612–4626. doi:10.1158/0008-5472.CAN-19-0799.
- Li ZX, Zheng Z-Q, Yang P-Y, Lin L, Zhou G-Q, Lv J-W, Zhang L-L, Chen F, Li Y-Q, Wu C-F, et al. WTAP-mediated m(6)A modification of lncRNA DIAPH1-AS1 enhances its stability to facilitate nasopharyngeal carcinoma growth and metastasis. Cell Death Differ. 2022; 29(6):1137–1151. doi:10.1038/s41418-021-00905-w.
- Zhao BS, Roundtree IA, He C. Post-transcriptional gene regulation by mRNA modifications. Nat Rev Mol Cell Biol. 2017;18(1):31–42. doi:10.1038/nrm.2016.132.
- Zhu H, Jia X, Wang Y, Song Z, Wang N, Yang Y, Shi X. M6A classification combined with tumor microenvironment immune characteristics analysis of bladder cancer. Front Oncol. 2021. 11:714267. doi:10.3389/fonc.2021.714267.
- Zhang B, Wu Q, Li B, Wang D, Wang L, Zhou YL. m6A regulator-mediated methylation modification patterns and tumor microenvironment infiltration characterization in gastric cancer. Mol Cancer. 2020;19(1):53. doi:10.1186/s12943-020-01170-0.
- Li M, Zha X, Wang S. The role of N6-methyladenosine mRNA in the tumor microenvironment. Biochim Biophys Acta Rev Cancer. 2021;1875(2):188522. doi:10.1016/j.bbcan.2021.188522.
- Quan C, Belaydi O, Hu J, Li H, Yu A, Liu P, Yi Z, Qiu D, Ren W, Ma H, et al. N(6)-methyladenosine in cancer immunotherapy: an undervalued therapeutic target. Front Immunol. 2021; 12:697026. doi:10.3389/fimmu.2021.697026.
- Zhang P, He Q, Lei Y, Li Y, Wen X, Hong M, Zhang J, Ren X, Wang Y, Yang X, et al. m(6)A-mediated ZNF750 repression facilitates nasopharyngeal carcinoma progression. Cell Death Disease. 2018; 9(12):1169. doi:10.1038/s41419-018-1224-3.
- Meng QZ, Cong C-H, Li X-J, Zhu F, Zhao X, Chen F-W. METTL3 promotes the progression of nasopharyngeal carcinoma through mediating M6A modification of EZH2. Eur Rev Med Pharmacol Sci. 2020;24(8):4328–4336. doi:10.26355/eurrev_202004_21014.
- He JJ, Li Z, Rong Z-X, Gao J, Mu Y, Guan Y-D, Ren X-X, Zi Y-Y, Liu L-Y, Fan Q, et al. m(6)A Reader YTHDC2 promotes radiotherapy resistance of nasopharyngeal carcinoma via activating IGF1R/AKT/S6 signaling axis. Front Oncol. 2020; 10:1166. doi:10.3389/fonc.2020.01166.
- Zhang L, MacIsaac KD, Zhou T, Huang P-Y, Xin C, Dobson JR, Yu K, Chiang DY, Fan Y, Pelletier M, et al. Genomic analysis of nasopharyngeal carcinoma reveals TME-Based subtypes. Mol Cancer Res. 2017; 15(12):1722–1732. doi:10.1158/1541-7786.MCR-17-0134.
- Bao YN, Cao X, Luo D, Sun R, Peng L, Wang L, Yan Y, Zheng L, Xie P, Cao Y, et al. Urokinase-type plasminogen activator receptor signaling is critical in nasopharyngeal carcinoma cell growth and metastasis. Cell Cycle. 2014; 13(12):1958–1969. doi:10.4161/cc.28921.
- Wilkerson MD, Hayes DN. ConsensusClusterPlus: a class discovery tool with confidence assessments and item tracking. Bioinformatics. 2010;26(12):1572–1573. doi:10.1093/bioinformatics/btq170.
- Spiwok V, Kříž P. Time-Lagged t-distributed stochastic neighbor embedding (t-SNE) of molecular simulation trajectories. Front Mol Biosci. 2020. 7:132. doi:10.3389/fmolb.2020.00132.
- Hoshida Y, Brunet J-P, Tamayo P, Golub TR, Mesirov JP. Subclass mapping: identifying common subtypes in independent disease data sets. PloS One. 2007;2(11):e1195. doi:10.1371/journal.pone.0001195.
- Hänzelmann S, Castelo R, Guinney J. GSVA: gene set variation analysis for microarray and RNA-seq data. BMC Bioinf. 2013;14(1):7. doi:10.1186/1471-2105-14-7.
- Mariathasan S, Turley SJ, Nickles D, Castiglioni A, Yuen K, Wang Y, Kadel III EE, Koeppen H, Astarita JL, Cubas R, et al. TGFβ attenuates tumour response to PD-L1 blockade by contributing to exclusion of T cells. Nature. 2018; 554(7693):544–548. doi:10.1038/nature25501.
- Yoshihara K, Shahmoradgoli M, Martínez E, Vegesna R, Kim H, Torres-Garcia W, Treviño V, Shen H, Laird PW, Levine DA, et al. Inferring tumour purity and stromal and immune cell admixture from expression data. Nat Commun. 2013; 4(1):2612. doi:10.1038/ncomms3612.
- Subramanian A, Tamayo P, Mootha VK, Mukherjee S, Ebert BL, Gillette MA, Paulovich A, Pomeroy SL, Golub TR, Lander ES, et al. Gene set enrichment analysis: a knowledge-based approach for interpreting genome-wide expression profiles. Proc Natl Acad Sci U S A. 2005; 102(43):15545–15550. doi:10.1073/pnas.0506580102.
- Bindea G, Mlecnik B, Tosolini M, Kirilovsky A, Waldner M, Obenauf A, Angell H, Fredriksen T, Lafontaine L, Berger A, et al. Spatiotemporal dynamics of intratumoral immune cells reveal the immune landscape in human cancer. Immunity. 2013; 39(4):782–795. doi:10.1016/j.immuni.2013.10.003.
- Jiang P, Gu S, Pan D, Fu J, Sahu A, Hu X, Li Z, Traugh N, Bu X, Li B, et al. Signatures of T cell dysfunction and exclusion predict cancer immunotherapy response. Nat Med. 2018; 24(10):1550–1558. doi:10.1038/s41591-018-0136-1.
- Lu X, Jiang L, Zhang L, Zhu Y, Hu W, Wang J, Ruan X, Xu Z, Meng X, Gao J, et al. Immune signature-based subtypes of cervical squamous cell carcinoma tightly associated with human papillomavirus type 16 expression. Molecul Featur Clin Outcome. Neoplasia. 2019; 21(6):591–601. doi:10.1016/j.neo.2019.04.003.
- Zeng D, Li M, Zhou R, Zhang J, Sun H, Shi M, Bin J, Liao Y, Rao J, Liao W. Tumor microenvironment characterization in gastric cancer identifies prognostic and immunotherapeutically relevant gene signatures. Cancer Immunol Res. 2019;7(5):737–750. doi:10.1158/2326-6066.CIR-18-0436.
- Zhang Z, Ma L, Goswami S, Ma J, Zheng B, Duan M, Liu L, Zhang L, Shi J, Dong L, et al. Landscape of infiltrating B cells and their clinical significance in human hepatocellular carcinoma. Oncoimmunology. 2019; 8(4):e1571388. doi:10.1080/2162402X.2019.1571388.
- Wu J, Zhang T, Xiong H, Zeng L, Wang Z, Peng Y, Chen W, Hu X, Su T. Tumor-infiltrating CD4(+) central memory T cells correlated with favorable prognosis in oral squamous cell carcinoma. J Inflamm Res. 2022. 15:141–152. doi:10.2147/JIR.S343432.
- Fiala GJ, Minguet S. Caveolin-1: the unnoticed player in TCR and BCR signaling. Adv Immunol. 2018;137:83–133.
- Tanaka S, Baba Y. B Cell Receptor Signaling. Adv Exp Med Biol. 2020;1254:23–36.
- Burger JA, Wiestner A. Targeting B cell receptor signalling in cancer: preclinical and clinical advances. Nat Rev Cancer. 2018;18(3):148–167. doi:10.1038/nrc.2017.121.
- Courtney AH, Lo WL, Weiss A. TCR signaling: mechanisms of initiation and propagation. Trends Biochem Sci. 2018;43(2):108–123. doi:10.1016/j.tibs.2017.11.008.
- Smith-Garvin JE, Koretzky GA, Jordan MS. T cell activation. Annu Rev Immunol. 2009;27(1):591–619. doi:10.1146/annurev.immunol.021908.132706.
- Li MO, Rudensky AY. T cell receptor signalling in the control of regulatory T cell differentiation and function. Nat Rev Immunol. 2016;16(4):220–233. doi:10.1038/nri.2016.26.
- Wing JB, Tanaka A, Sakaguchi S. Human FOXP3(+) regulatory T cell heterogeneity and function in autoimmunity and cancer. Immunity. 2019;50(2):302–316. doi:10.1016/j.immuni.2019.01.020.
- Zhou W, Guo S, Liu M, Burow ME, Wang G. Targeting CXCL12/CXCR4 axis in tumor immunotherapy. Curr Med Chem. 2019;26(17):3026–3041. doi:10.2174/0929867324666170830111531.
- Prager I, Watzl C. Mechanisms of natural killer cell-mediated cellular cytotoxicity. J Leukoc Biol. 2019;105(6):1319–1329. doi:10.1002/JLB.MR0718-269R.
- Wang Y, Zhang S, Li H, Wang H, Zhang T, Hutchinson MR, Yin H, Wang X. Small-molecule modulators of toll-like receptors. Acc Chem Res. 2020;53(5):1046–1055. doi:10.1021/acs.accounts.9b00631.
- Wang S, He Z, Wang X, Li H, Liu X-S. Antigen presentation and tumor immunogenicity in cancer immunotherapy response prediction. Elife. 2019. 8:8. doi:10.7554/eLife.49020.
- Najafi M, Farhood B, Mortezaee K. Extracellular matrix (ECM) stiffness and degradation as cancer drivers. J Cell Biochem. 2019;120(3):2782–2790. doi:10.1002/jcb.27681.
- Xu X, Zhang M, Xu F, Jiang S. Wnt signaling in breast cancer: biological mechanisms, challenges and opportunities. Mol Cancer. 2020;19(1):165. doi:10.1186/s12943-020-01276-5.
- Zhang Y, Wang X. Targeting the Wnt/β-catenin signaling pathway in cancer. J Hematol Oncol. 2020;13(1):165. doi:10.1186/s13045-020-00990-3.
- Le PN, Keysar SB, Miller B, Eagles JR, Chimed T-S, Reisinger J, Gomez KE, Nieto C, Jackson BC, Somerset HL, et al. Wnt signaling dynamics in head and neck squamous cell cancer tumor-stroma interactions. Mol Carcinog. 2019; 58(3):398–410. doi:10.1002/mc.22937.
- Mosa MH, Michels BE, Menche C, Nicolas AM, Darvishi T, Greten FR, Farin HF. A Wnt-induced phenotypic switch in cancer-associated fibroblasts inhibits EMT in colorectal cancer. Cancer Res. 2020;80(24):5569–5582. doi:10.1158/0008-5472.CAN-20-0263.
- Salaritabar A, Berindan-Neagoe I, Darvish B, Hadjiakhoondi F, Manayi A, Devi KP, Barreca D, Orhan IE, Süntar I, Farooqi AA, et al. Targeting hedgehog signaling pathway: paving the road for cancer therapy. Pharmacol Res. 2019; 141:466–480. doi:10.1016/j.phrs.2019.01.014.
- Xin M, Ji X, De La Cruz LK, Thareja S, Wang B. Strategies to target the hedgehog signaling pathway for cancer therapy. Med Res Rev. 2018;38(3):870–913. doi:10.1002/med.21482.
- Ma Z, Gao X, Shuai Y, Xing X, Ji J. The m6A epitranscriptome opens a new charter in immune system logic. Epigenetics. 2021;16(8):819–837. doi:10.1080/15592294.2020.1827722.
- Han D, Liu J, Chen C, Dong L, Liu Y, Chang R, Huang X, Liu Y, Wang J, Dougherty U, et al. Anti-tumour immunity controlled through mRNA m(6)A methylation and YTHDF1 in dendritic cells. Nature. 2019; 566(7743):270–274. doi:10.1038/s41586-019-0916-x.
- Gao Y, Vasic R, Song Y, Teng R, Liu C, Gbyli R, Biancon G, Nelakanti R, Lobben K, Kudo E, et al. m(6)A modification prevents formation of endogenous double-stranded RNAs and deleterious innate immune responses during hematopoietic development. Immunity. 2020; 52(6):1007–1021.e1008. doi:10.1016/j.immuni.2020.05.003.
- Wang Q, Chen C, Ding Q, Zhao Y, Wang Z, Chen J, Jiang Z, Zhang Y, Xu G, Zhang J, et al. METTL3-mediated m 6 a modification of HDGF mRNA promotes gastric cancer progression and has prognostic significance. Gut. 2020; 69(7):1193–1205. doi:10.1136/gutjnl-2019-319639.
- Netea MG, Joosten LAB, Latz E, Mills KHG, Natoli G, Stunnenberg HG, O’Neill LAJ, Xavier RJ. Trained immunity: a program of innate immune memory in health and disease. Science. 2016;352(6284):aaf1098. doi:10.1126/science.aaf1098.
- Wu SY, Fu T, Jiang Y-Z, Shao Z-M. Natural killer cells in cancer biology and therapy. Mol Cancer. 2020;19(1):120. doi:10.1186/s12943-020-01238-x.
- Xie M, He J, He C, Wei S. γ secretase inhibitor BMS-708163 reverses resistance to EGFR inhibitor via the PI3K/Akt pathway in lung cancer. J Cell Biochem. 2015;116(6):1019–1027. doi:10.1002/jcb.25056.
- Lu H, Li Z-Y, Ding M, Liang C, Weng X-Q, Sheng Y, Wu J, Cai X. Trametinib enhances ATRA-induced differentiation in AML cells. Leuk Lymphoma. 2021;62(14):3361–3372. doi:10.1080/10428194.2021.1961231.
- Ni X, Hu G, Cai X. The success and the challenge of all-trans retinoic acid in the treatment of cancer. Crit Rev Food Sci Nutr. 2019;59(sup1):S71–s80. doi:10.1080/10408398.2018.1509201.
- Liu Y, Liu Q, Chen S, Liu Y, Huang Y, Chen P, Li X, Gao G, Xu K, Fan S, et al. APLNR is involved in ATRA-induced growth inhibition of nasopharyngeal carcinoma and may suppress EMT through PI3K-Akt-mTOR signaling. FASEB J. 2019; 33(11):11959–11972. doi:10.1096/fj.201802416RR.
- Porta C, Tortora G, Larkin JM, Hutson TE. Management of poor-risk metastatic renal cell carcinoma: current approaches, the role of temsirolimus and future directions. Future Oncol. 2016;12(4):533–549. doi:10.2217/fon.15.313.
- Widemann BC, Adamson PC. Understanding and managing methotrexate nephrotoxicity. Oncologist. 2006;11(6):694–703. doi:10.1634/theoncologist.11-6-694.
- Ji X, Guo H, Tang Q, Ma D, Xue W. A targeted nanocarrier based on polyspermine for the effective delivery of methotrexate in nasopharyngeal carcinoma. Mater Sci Eng C Mater Biol Appl. 2017. 81:48–56. doi:10.1016/j.msec.2017.07.036.