ABSTRACT
Transcription factors FOXOs (1, 3, 4) are essential for the maintenance of haematopoietic stem cells. FOXOs are evolutionary conserved substrates of the AKT serine threonine protein kinase that are also phosphorylated by several kinases other than AKT. Specifically, phosphorylation by AKT is known to result in the cytosolic localization of FOXO and subsequent inhibition of FOXO transcriptional activity. In addition to phosphorylation, FOXOs are regulated by a number of other post-translational modifications including acetylation, methylation, redox modulation, and ubiquitination that altogether determine these factors' output. Cumulating evidence raises the possibility that in stem cells, including in haematopoietic stem cells, AKT may not be the dominant regulator of FOXO. To address this question in more detail, we examined gene expression, subcellular localization, and response to AKT inhibition of FOXO1 and FOXO3, the main FOXO expressed in HSPCs (haematopoietic stem and progenitor cells). Here we show that while FOXO1 and FOXO3 transcripts are expressed at similar levels, endogenous FOXO3 protein is mostly nuclear compared to the cytoplasmic localization of FOXO1 in HSPCs. Furthermore, inhibition of AKT does not enhance nuclear localization of FOXO1 nor FOXO3. Nonetheless AKT inhibition in the context of loss of NAD-dependent SIRT1 deacetylase modulates FOXO3 localization in HSPCs. Together, these data suggest that FOXO3 is more active than FOXO1 in primitive haematopoietic stem and multipotent progenitor cells. In addition, they indicate that upstream regulators other than AKT, such as SIRT1, maintain nuclear FOXO localization and activity in HSPCs.
Introduction
The FOXO family of transcription factors, consisting of FOXO1, FOXO3, FOXO4, and FOXO6 in mammals, regulates and integrates critical cellular processes including restricting cell cycle entry, inducing apoptosis, regulating metabolism, modulating inflammation, and alleviating oxidative stress.Citation1,2 Canonically, control of FOXO occurs through growth factor (insulin) or cytokine stimulation of receptor signaling pathways, leading to PI3K activation of AKT and subsequent phosphorylation of FOXO. AKT phosphorylation of FOXO represses their transcriptional activity in part by promoting nuclear export and localization within the cytosol.Citation3 In addition to AKT, FOXOs are phosphorylated by a number of protein kinases that either activate or repress FOXO transcriptional activity. Besides phosphorylation, FOXOs are regulated by many other post-translational modifications including acetylation, methylation, redox modulation, and ubiquitination that altogether determine FOXOs' functional output.Citation1
Single Foxo knock-out mice exhibit distinct phenotypes.Citation4-6 In stem cells, FOXOs are key regulators of pluripotency in both embryonic and adult stem cells, including haematopoietic and neural stem cells.Citation7-11 The essential function of FOXOs in stem cells became evident with the initial studies showing that the triple knock out of Foxo1, 3, and 4 leads to increased levels of oxidative stress, cell cycle entry, and diminished competitive reconstitution capacity within the HSC (haematopoietic stem cell) compartment. These defects were not seen in single Foxo knockdowns within the same study, leading to the conclusion that FOXOs serve redundant functions in HSCs.Citation12 Subsequent studies showed that Foxo3−/− mice with isogeneic backgrounds display a haematopoietic phenotype in young adult mice that mirrors that of the triple Foxo null HSC, albeit less severe.Citation7,8 More committed Foxo3−/− haematopoietic progenitors also display defects in myeloid, erythroid and immune lineages similar to that of triple FOXO knock out mice.Citation9,13-18 Furthermore, FOXO3 was mostly found in the nucleus of primitive haematopoietic stem and progenitor cells whereas FOXO1 was not suggesting that FOXO3 might be regulated differently and bear different functions as compared to FOXO1 in these cells.Citation8 FOXO3 is critical for HSC mitochondrial metabolism and is also implicated in HSC aging in which FOXO3 acetylation/deacetylation might be implicated.Citation19-22 In addition, FOXO3 is required for the maintenance of leukemia initiating stem cells in models of acute and chronic myeloid leukemias as has been shown for FOXO1, 3 and 4.Citation23,24 However, suppression of FOXO3 is required to maintain survival and proliferation of the bulk of leukemic cells.Citation25-28 Collectively these results suggested that further characterization of FOXO3 in HSPC is warranted.
To evaluate the potential redundancy of FOXOs we examined gene expression patterns, nuclear localization, and regulation by AKT and SIRT1 of FOXO1 and FOXO3, the 2 FOXOs most closely associated with stem cell function including in haematopoietic stem and progenitor cell populations.Citation8,11,Citation29,30
Results
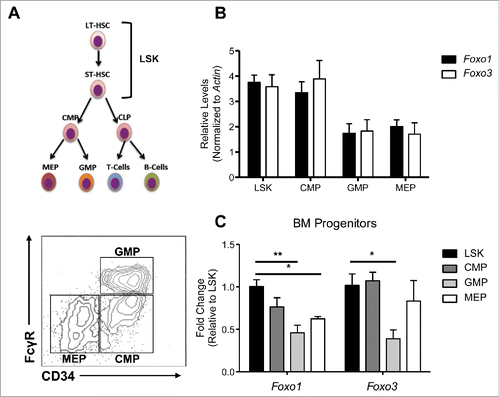
We surveyed mRNA levels of Foxo1 and Foxo3 to detect for potential differences in the regulation of these factors by comparing their transcript abundance. Focusing on haematopoietic stem and progenitor cells, we isolated RNA from 4 bone marrow haematopoietic populations by FACS (fluorescence activated cell sorting). These populations included LSK (Lin-, Sca1+,cKIT+), CMP (common myeloid progenitor), GMP (granulocyte- monocyte progenitor), and MEP (megakaryocyte erythrocyte progenitor) cells, which all displayed frequencies within normal ranges (data not shown).Citation31 The LSK population is enriched for HSCs and more downstream multipotent progenitors, while CMPs, GMPs, and MEPs are committed to myeloid granulocyte monocyte, megakaryocytes and erythroid lineages ().Citation31 Within each population, Foxo1 and Foxo3 transcript level showed no significant differences when examined by qRT-PCR using gene-specific primers with highly similar amplification efficiencies (). However, transcript levels of Foxo1 and Foxo3 differed significantly between populations, with the highest expression in LSK and CMPs, intermediate expression in MEPs, and the lowest expression in GMPs (). In addition, while Foxo3 expression was similarly high in both LSK and CMPs, the expression of Foxo1 transcript was relatively lower in CMP (albeit not significant in the limit of the number of replicates) as compared to LSK cells.
Figure 1. Foxo1 and Foxo3 follow similar expression patterns among HSPC populations. (A) (Top) Hierarchy of HSPC populations examined, with LSK cells at the top encompassing HSCs and multipotent progenitors, followed by CMPs, which give rise to GMPs and MEPs, the myeloid and erythroid lineage specific progenitors, respectively. (Bottom) Sorting scheme of HSPC populations: LSK (LIN- Sca1+ cKit+), CMP (LIN- IL7Rα- cKIT+ CD34+ Fcc3-), GMP ((LIN- IL7Rα- cKIT+ CD34+ Fcc3+) MEP ((LIN- IL7Rα- cKIT+ CD34- Fcc3-) (B) qRT-PCR analysis of cDNA generated from 3 independent experiments each containing a pool of 3 mice from each genotype. Absolute Cts (cycle which SYBR green fluorescence is detected over set threshold during exponential expansion of Foxo1 or Foxo3 transcripts) were normalized to B-actin levels as a control for total cDNA abundance. B-actin normalized expression levels comparing transcript abundance of Foxo1 and Foxo3 within each population are displayed. (C) B-actin normalized expression levels of Foxo1 and Foxo3 were further normalized to expression within the LSK population (ΔΔCt Method) to examine how Foxo1 and Foxo3 individually differ over HSPC populations. (Bars represent averages of 3 independent experiments. Results are mean ± s.e.m (n=3) *p < 0.5, **p < 0.01 2-way ANOVA).
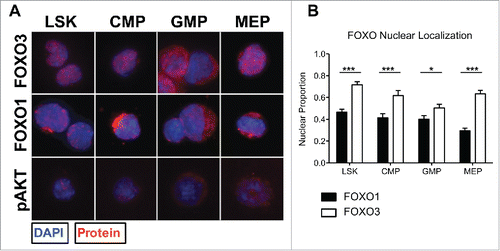
We next examined the nuclear localization of endogenous FOXO1 versus FOXO3 in HSPC by immunocytochemistry as performed previously.Citation32 Nuclear localization of FOXO transcription factors is a potential indication of FOXO transcriptional activity and is used as a surrogate assay in primary stem and progenitor cells where cell numbers are too limited for Western blot analysis. We therefore assayed for subcellular localization of endogenous FOXO1 and FOXO3 proteins using the same haematopoietic stem and progenitor cell populations examined previously (, Figure S1). At least 30 cells per population over 3 experiments were analyzed. DAPI staining was used to delimit the nuclear area to mark nuclear FOXO, and any FOXO fluorescence outside the nuclear area was considered cytoplasmic. The images clearly illustrate FOXO3 localized within the nucleus, while FOXO1 remaining more within the cytoplasm in all 4 populations (). When the proportion of nuclear FOXO was quantified, FOXO3 showed significantly more nuclear localization than FOXO1 in all HSPC populations examined (, *p < 0.05, ***p < 0.001). Interestingly, the levels of FOXO3 nuclear localization also differed between populations in a manner that mirrored the mRNA expression profile, with greater mRNA abundance correlating to higher levels of nuclear localization (). Notably, nuclear FOXO3 protein was over 2-fold higher than nuclear FOXO1 in MEPs (). Together these results suggest that FOXO3 may be predominantly transcriptionally active as compared to FOXO1 in all haematopoietic populations examined. Moreover, although the expression levels between Foxo1 and Foxo3 are relatively similar, the greater nuclear localization of FOXO3 within haematopoietic stem and myeloid progenitor cells may suggest a specific function for FOXO3 distinct from that of FOXO1 within the examined cell types of the mouse haematopoietic system. This interpretation is in agreement with previous findings documenting the role of FOXO3 in maintaining proper function of HSCs, haematopoietic progenitors, and erythroblasts in mice through mitigating oxidative and metabolic stress.Citation7-9,Citation13,14,Citation33
Figure 2. FOXO3 is significantly more active than FOXO1 based on nuclear localization within each HSPC population. (A) Using the same sorting strategy as in 1A (bottom), each population was cytospun and fixed onto slides for immunofluorescence analysis of FOXO1 or FOXO3 subcellular localization. Representative immunofluorescence images displaying FOXO1, FOXO3, or pAKT in red and counterstained with DAPI to delimit the nucleus, shown in blue. Columns separate each population and rows separate protein examined. (B) Thirty to 40 cells per population were quantified over 3 independent experiments. Nuclear localization was determined by proportion of total FOXO1 or FOXO3 fluorescence within area delimited by DAPI using ImageJ and MATLAB to measure fluorescence values and calculate proportions. With 0 representing complete cytoplasmic FOXO and 1 representing complete nuclear FOXO (Bars represent mean ± s.e.m. (n > 30) from 3 independent experiments with BM cells from a pool of 3 mice per experiment. *p < 0.5, **p < 0.01, ***p < 0.001 students t-test).
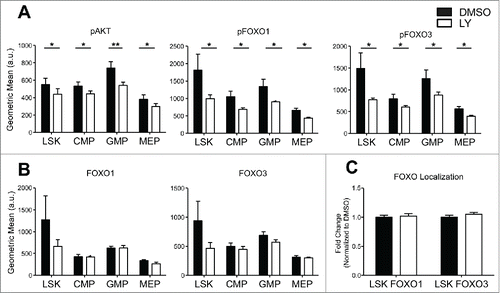
One potential cause of the contrasting localization patterns between FOXO1 and FOXO3 may be through alternative post-translational modifications. One of the main pathways regulating FOXOs is through growth factor signaling and subsequent phosphorylation by activated AKT, which leads to FOXO localization within the cytoplasm. So, we examined for the presence of active AKT, in the form of pAKT (phosphorylated AKT). We were able to observe pAKT in all 4 populations by immunocytochemistry and quantified by flow cytometry (). Because FOXO3 appeared to localize to the nucleus even in presence of pAKT in contrast to FOXO1, we hypothesized that FOXO1 may be more sensitive than FOXO3 to suppression by pAKT. To test the effect of pAKT on FOXO localization we used the compound LY-294002 that is a specific inhibitor of PI3-kinase, the upstream activator of AKT, and subsequently assayed for FOXO nuclear localization. As anticipated, treatment with 10uM of LY-294002 for 30 minutes significantly decreased levels of pAKT, which in turn decreased levels of pFOXO (results were identical with one hour LY-294002 treatment) (). AKT inhibition did not alter significantly the levels of total FOXO proteins in all 4 populations examined by flow cytometry (). However, even when levels of pFOXO were decreased, as within the LSK population (), the nuclear localization of either FOXO1 or FOXO3 (, Figure S2) was not significantly modulated. These results were surprising given that a significant fraction of FOXO1 or FOXO3 remain cytoplasmic () despite AKT inhibition (, Figure S2). These results may suggest that FOXO1 and FOXO3 are relatively insensitive to the suppressive effect of AKT phosphorylation in HSPC.
Figure 3. HSPC FOXO1 and FOXO3 nuclear localization is insensitive to AKT inhibition by LY294002 (LY). (A-B) Total BM cells were isolated from 4 mice per genotype and stained with antibodies specific to cell surface markers discussed in (bottom) to distinguish HSPC populations. Cells were then treated with DMSO or 10uM LY294002 for 30 min followed by fixation and permeablization. Subsequently, flow cytometry analysis of pAKT (Ser 473), total FOXO1, total FOXO3, pFOXO1 (Ser 253), and pFOXO3 (Ser256) levels with specific fluorescence conjugated antibodies. Graphs represent abundance of protein denoted by the geometric mean of antibody fluorescence bound to protein. (Error bars indicate s.e.m. *p < 0.5, **p < 0.01 paired t-test) (C) BM cells treated with DMSO and LY294002 were also sorted as in (bottom) and cytospun onto slides for immunofluorescence analysis of FOXO1 and FOXO3. Thirty-40 cells per population were analyzed over 3 independent experiments. Graph represents quantification (same method as described in ) of the fold change in nuclear localization relative to DMSO control of either FOXO1 or FOXO3. (Bars represent mean ± s.e.m. (n > 30)).
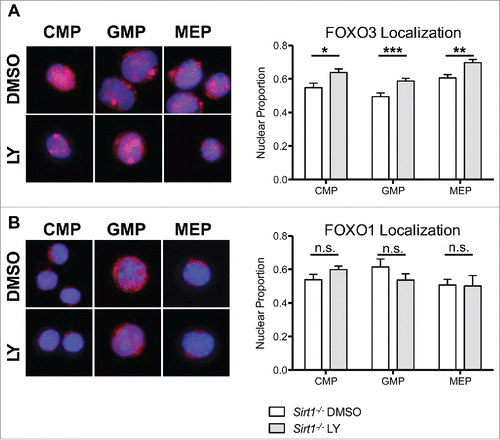
FOXO3 is a known substrate of the NAD-dependent SIRT1 deacetylase.Citation34,35 In previous studies we demonstrated that FOXO3 is a downstream target of SIRT1 in HSC.Citation20 Sirt1−/− and Foxo3−/− HSCs have overlapping defects raising the possibility that SIRT1 mediated deacetylation may play a role in maintaining FOXO3 in the nucleus and its subsequent activity in HSCs.Citation6,7,Citation15,20 FOXO3s cytoplasmic localization increases in Sirt1−/− LSK cells compared to WT LSK cells.Citation20 Therefore, we wanted to further test if SIRT1s modulation of FOXO3 is dominant over the AKT mediated inhibitory phosphorylation signal by inhibiting AKT activation in Sirt1−/− HSPCs with LY-294002. We first confirmed greater cytoplasmic localization of FOXO3 in Sirt1−/− LSK cells relative to WT LSK cells, which we also observed in the downstream progenitor populations (Figure S2). Treatment with LY-294002 did not alter localization patterns of FOXO1, but did have a small, statistically significant effect on FOXO3 localization in SIRT1−/− LSK cells (). LY-294002 treatment resulted in increased rather than decreased cytoplasmic localization of FOXO3 as a result of AKT inhibition, which is contrary to our prediction based on the canonical AKT-FOXO axis. However, the effect was relatively modest, when compared to the differences between FOXO3 and FOXO1 localization (). In contrast, LY-294002 treatment resulted in significantly greater nuclear localization of FOXO3, but not FOXO1, in Sirt1−/− progenitor cell populations (). This effect was not seen in WT progenitor cells treated with LY-294002 (Figure S2). These results suggest FOXO3 localization becomes sensitized to AKT inhibition in the absence of SIRT1 in myeloid progenitors, and provides evidence that SIRT1 function may override AKT phosphorylation of FOXO3 in HSPC. These combined findings support the idea that, under homeostatic conditions, AKT is not the dominant determinant of FOXO3 activity in haematopoietic stem and progenitor cells.
Figure 4. FOXO3 localization is sensitized to modulation by AKT in the absence of SIRT1 in LSK cells. A,B. Sorted LSK cells from WT and Sirt1−/− mice were cytospun onto slides for immunofluorescence analysis for either FOXO1 (A) or FOXO3 (B). LSK cells were then treated with DMSO or LY294002 (LY) as in previous experiments. Graph represents quantification of fold change in nuclear localization relative to DMSO control of either FOXO1 or FOXO3. (Bars represent mean ± s.e.m. (n > 40), from at least 2 independent experiments. *p < .05, students t-test).
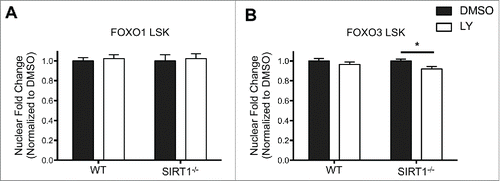
Figure 5. Increased FOXO3, but not FOXO1, nuclear localization induced by AKT inhibition in Sirt1−/− hematopoietic progenitor cells. (A) Sorted CMP, GMP, and MEP cells from BM cells of Sirt1−/− mice were treated with DMSO or LY294002 (LY) as in previous experiments. (Left) Representative images of CMP, GMP, MEP cells treated with DMSO or LY294002, with DAPI delimiting the nucleus in blue, and FOXO3 in red. (Right) Graphs displays quantification of the proportion of FOXO3 within the nucleus. (B) Same as in (A) but with FOXO1. (Bars represent mean ± s.e.m. (n > 20), from at least 2 independent experiments. *p < .05, **p < .01, ***p < .001, students t-test). Note the similar fraction of nuclear FOXO1 and FOXO3 in Sirt1−/− CMP.
Discussion
Together, these results suggest that despite relatively similar mRNA expression patterns, endogenous FOXO3 appears more active than FOXO1 in primary mouse blood stem and myeloid progenitor cell subpopulations examined based on nuclear localization under our experimental conditions. Furthermore, FOXO1 and FOXO3 nuclear localization in a population enriched for primitive haematopoietic stem and progenitor cells (LSK cells) was not affected by AKT mediated inhibitory signals. These results confirm constitutive nuclear expression of FOXO3 in HSPC and are consistent with the evidence showing that constitutive activation of AKT as a result of PTEN deletion in HSCs does not modulate the nuclear localization of FOXO3.Citation8,36 It has been shown recently while this paper was in revision that constitutive activation of JAK2, a protein tyrosine kinase required for signaling by many haematopoietic cytokine receptors, induces nuclear export of FOXO3 through PI3K in primary erythroblasts but not in HSCs and early haematopoietic progenitors isolated from JAK2 mutant mice and/or patients with myeloproliferative neoplasms.Citation37 The absence of altered FOXO3 nuclear localization after modulation of AKT activity points to other upstream regulators of FOXO. Such upstream regulators include deacetylation by Sirtuins (SIRT) 1/3 and other stress signals, which may maintain FOXOs (specifically FOXO3) within the nucleus.Citation1,20,Citation34,35,Citation38-40 These results are overall consistent with previous findings showing that deacetylation of FOXO weakens its phosphorylation by AKT.Citation41 Evidence of SIRT1 regulation of FOXO3 in HSPC come from our previous studies and current experiments, which demonstrated that Sirt1Δ/Δ contain less nuclear FOXO3 compared to WT HSPCsCitation20 (Figure S2). In turn, ablation of SIRT1 in HSPCs led to altered FOXO3 localization patterns in response to inhibiting AKT mediated FOXO3 phosphorylation. These results combined with previous findings suggest that post-translational modification of FOXO3 by acetylation (by PCAF or CBP/p300) among others or association with different partners, might be important for HSPC activity and its generation of downstream progenitor cells with more restricted lineage specificity.Citation1,9,Citation20,42 Together, our data supports the hypothesis that in HSPCs SIRT1 (deacetylation) is dominant over AKT (phosphorylation) in the regulation of FOXO3. FOXO1 remained relatively cytoplasmic regardless of SIRT1 or AKT activity, suggesting other signals may regulate FOXO1 in HSPCs. These results are also consistent with the regulation of FOXO1 in human embryonic stem cells.Citation11 These findings highlight that in the complex milieu of primary HSPC signals that influence FOXO subcellular localization and ultimately transcriptional activity are not limited to inhibitory growth factor signaling through AKT. These combined findings have also critical consequences for elucidating mechanisms that control FOXO3 in the regulation of leukemic stem cell formation.Citation23,24,Citation37
Materials and methods
Mice
C57BL/6 mice of various genotypes at 8-10 weeks old were used for all experiments. Sirt1−/− and Foxo3−/− mice were genotyped and generated as previously described.Citation9,15
FAC sorting of haematopoietic progenitors
Femur and tibias were extracted from 3 mice and pooled per experiment. Bone marrow cells were flushed with IMDM 15% FBS and then washed and suspended in PBS with 2%FBS at a concentration of 30 × 107 cells/mL. Cells were subsequently stained with the Lineage cocktail antibodies, IL7Rα, Sca-1, cKit, CD34, and FCyR. Populations of cells were then sorted based on expression of cell surface markers on the BD Influx cell sorter as in 20.
RNA isolation and qRT-PCR
RNA was extracted from sorted cells using the RNeasy Plus Micro Kit (Qiagen) per manufacturer's instructions. Extracted RNA was reverse transcribed with Superscript III reverse transcriptase (Invitrogen) to produce cDNAs for each progenitor population. qRT-PCR was performed on a BioRad machine with Foxo1 and Foxo3 primers spanning exon-exon junctions and B-Actin as a control. Amplification efficiency of primers for Foxo1 and Foxo3 were tested using a serial dilution of cDNA concentrations, and were shown to be comparable.
LY-294002 treatment
FACS-sorted cells were washed several times and treated with 10uM LY-294002 in IMDM 1%FBS for 30 minutes or 1 hour, washed twice with PBS, fixed, and permeablized with the BD Cytofix/Cytoperm Kit (Cat. No. 554714). Fixed cells were stained with AKT pSER 473, FOXO3 pSER 253, and FOXO1 pSer256, and analyzed by flow cytometry. Plots were analyzed and quantified with FlowJo.
Immunocytochemistry and nuclear localization analysis
FACS-sorted cells were cytospun onto glass slides (3000-5000 cells/slide), fixed, permeablized, and stained with either anti-FOXO1 (Santa Cruz) or anti-FOXOO3 (Millipore) antibodies overnight. Slides were then stained with secondary antibodies conjugated to Alexfluor 594 for 1 hour and DAPI. Slides were imaged at 40X using a Leica D5500 fluorescent microscope. Fluorescence intensity of FOXO1/FOXO3 and DAPI was determined using the RGBprofile macro in ImageJ of line scans across the whole cell. Raw values of position and fluorescence intensity were used to determine proportion of FOXO fluorescence within the nucleus or the cytoplasm using a custom script in MATLAB. In brief, the fluorescence values for FOXO or DAPI were normalized to the largest value along the line scan, producing a 2D plot that displays position as the X-axis and fluorescence intensity as the Y-axis. These values were then used to delimit the position of the nucleus. Finally the area under the FOXO curve was determined by the trapz function in MATLAB, and the proportion of the area within the positions determined as the nucleus was considered nuclear FOXO.
Disclosure of potential conflicts of interest
No potential conflicts of interest were disclosed.
KCCY_S_1123355.pdf
Download PDF (87.4 KB)Acknowledgments
The authors thank the flow cytometry core at the Icahn School of Medicine at Mount Sinai for technical help.
Funding
C.L.B. was partially supported by a Roche TCRC - Young Investigator and R.L. by NIH T32 GM08553-13 and T32 HD075735. This work was supported by funds from RO1 HL116365, the ASH Bridge Award, and Tisch Cancer Institute to SG.
References
- Eijkelenboom A, Burgering BMT. FOXOs: signalling integrators for homeostasis maintenance. Nat Rev Mol Cell Biol 2013; 14:83-97; PMID:23325358; http://dx.doi.org/10.1038/nrm3507
- Salih DAM, Brunet A. FoxO transcription factors in the maintenance of cellular homeostasis during aging. Curr Opin Cell Biol 2008; 20:126-36; PMID:18394876; http://dx.doi.org/10.1016/j.ceb.2008.02.005
- Brunet A, Bonni A, Zigmond MJ, Lin MZ, Juo P, Hu LS, Anderson MJ, Arden KC, Blenis J, Greenberg ME. Akt promotes cell survival by phosphorylating and inhibiting a Forkhead transcription factor. Cell 1999; 96:857-68; PMID:10102273
- Castrillon DH, Miao L, Kollipara R, Horner JW, DePinho RA. Suppression of ovarian follicle activation in mice by the transcription factor Foxo3a. Science 2003; 301:215-8; PMID:12855809; http://dx.doi.org/10.1126/science.1086336
- Hosaka T, Biggs WH, Tieu D, Boyer AD, Varki NM, Cavenee WK, Arden KC. Disruption of forkhead transcription factor (FOXO) family members in mice reveals their functional diversification. Proc Natl Acad Sci U S A 2004; 101:2975-80; PMID:14978268; http://dx.doi.org/10.1073/pnas.0400093101
- Salih DAM, Rashid AJ, Colas D, de la Torre-Ubieta L, Zhu RP, Morgan AA, Santo EE, Ucar D, Devarajan K, Cole CJ, et al. FoxO6 regulates memory consolidation and synaptic function. Genes Dev 2012; 26:2780-801; PMID:23222102; http://dx.doi.org/10.1101/gad.208926.112
- Miyamoto K, Araki KY, Naka K, Arai F, Takubo K, Yamazaki S, Matsuoka S, Miyamoto T, Ito K, Ohmura M, et al. Foxo3a Is Essential for Maintenance of the Hematopoietic Stem Cell Pool. Cell Stem Cell 2007; 1:101-12; PMID:18371339; http://dx.doi.org/10.1016/j.stem.2007.02.001
- Yalcin S, Zhang X, Luciano JP, Mungamuri SK, Marinkovic D, Vercherat C, Sarkar A, Grisotto M, Taneja R, Ghaffari S. Foxo3 is essential for the regulation of ataxia telangiectasia mutated and oxidative stress-mediated homeostasis of hematopoietic stem cells. J Biol Chem 2008; 283:25692-705; PMID:18424439; http://dx.doi.org/10.1074/jbc.M800517200
- Yalcin S, Marinkovic D, Mungamuri SK, Zhang X, Tong W, Sellers R, Ghaffari S. ROS-mediated amplification of AKT/mTOR signalling pathway leads to myeloproliferative syndrome in Foxo3(−/−) mice. EMBO J 2010; 29:4118-31; PMID:21113129; http://dx.doi.org/10.1038/emboj.2010.292
- Yeo H, Lyssiotis CA, Zhang Y, Ying H, Asara JM, Cantley LC, Paik J-H. FoxO3 coordinates metabolic pathways to maintain redox balance in neural stem cells. EMBO J 2013; 1-14; PMID:23211745
- Zhang X, Yalcin S, Lee D-F, Yeh T-YJ, Lee S-M, Su J, Mungamuri SK, Rimmelé P, Kennedy M, Sellers R, et al. FOXO1 is an essential regulator of pluripotency in human embryonic stem cells. Nat Cell Biol 2011; 13:1092-9; PMID:21804543; http://dx.doi.org/10.1038/ncb2293
- Tothova Z, Kollipara R, Huntly BJ, Lee BH, Castrillon DH, Cullen DE, McDowell EP, Lazo-Kallanian S, Williams IR, Sears C, et al. FoxOs are critical mediators of hematopoietic stem cell resistance to physiologic oxidative stress. Cell 2007; 128:325-39; PMID:17254970; http://dx.doi.org/10.1016/j.cell.2007.01.003
- Marinkovic D, Zhang X, Yalcin S, Luciano JP, Brugnara C, Huber T, Ghaffari S. Foxo3 is required for the regulation of oxidative stress in erythropoiesis. J Clin Invest 2007; 117:2133-44; PMID:17671650; http://dx.doi.org/10.1172/JCI31807
- Zhang X, Campreciós G, Rimmelé P, Liang R, Yalcin S, Mungamuri SK, Barminko J, D'Escamard V, Baron MH, Brugnara C, et al. FOXO3-mTOR Metabolic Cooperation in the Regulation of Erythroid Cell Maturation and Homeostasis. Am J Hematol 2014; 0:1-10
- Tzelepis F, Joseph J, Haddad EK, Maclean S, Dudani R, Agenes F, Peng SL, Sekaly R-P, Sad S. Intrinsic role of FoxO3a in the development of CD8+ T cell memory. J Immunol 2013; 190:1066-75; PMID:23277488; http://dx.doi.org/10.4049/jimmunol.1200639
- Hinman RM, Nichols WA, Diaz TM, Gallardo TD, Castrillon DH, Satterthwaite AB. Foxo3−/− mice demonstrate reduced numbers of pre-B and recirculating B cells but normal splenic B cell sub-population distribution. Int Immunol 2009; 21:831-42; PMID:19502585; http://dx.doi.org/10.1093/intimm/dxp049
- Hedrick SM, Hess Michelini R, Doedens AL, Goldrath AW, Stone EL. FOXO transcription factors throughout T cell biology. Nat Rev Immunol [Internet] 2012 [cited 2014 Sep 29]; 12:649-61; http://dx.doi.org/10.1038/nri3278
- Liang R, Campreciós G, Kou Y, McGrath K, Nowak R, Catherman S, Bigarella CL, Rimmelé P, Zhang X, Gnanapragasam MN, et al. A Systems Approach Identifies Essential FOXO3 Functions At Key Steps of Terminal Erythropoiesis. PLoS Genet 2015; 11(10): e1005526; PMID:26452208; http://dx.doi.org/10.1371/journal.pgen.1005526
- Miyamoto K, Miyamoto T, Kato R, Yoshimura A, Motoyama N, Suda T. FoxO3a regulates hematopoietic homeostasis through a negative feedback pathway in conditions of stress or aging. Blood 2008; 112:4485-93; PMID:18799725; http://dx.doi.org/10.1182/blood-2008-05-159848
- Rimmelé P, Bigarella CL, Liang R, Izac B, Dieguez-Gonzalez R, Barbet G, Donovan M, Brugnara C, Blander JM, Sinclair DA, et al. Aging-like Phenotype and Defective Lineage Specification in SIRT1-Deleted Hematopoietic Stem and Progenitor Cells. Stem Cell Reports 2014; 3:1-16; http://dx.doi.org/10.1016/j.stemcr.2014.06.009
- Rimmelé P, Liang R, Bigarella CL, Kocabas F, Xie J, Serasinghe MN, Chipuk JE, Sadek H, Zhang CC, Ghaffari S. Mitochondrial Metabolism in Hematopoietic Stem Cells Requires Functional FOXO3. EMBO Rep 2015; 9:1164-76; http://dx.doi.org/10.15252/embr.201439704
- Mehta A, Zhao JL, Sinha N, Marinov GK, Mann M, Kowalczyk MS, Galimidi RP, Du X, Erikci E, Regev A, et al. The MicroRNA-132 and MicroRNA-212 Cluster Regulates Hematopoietic Stem Cell Maintenance and Survival with Age by Buffering FOXO3 Expression. Immunity 2015; 42:1021-32; PMID:26084022; http://dx.doi.org/10.1016/j.immuni.2015.05.017
- Naka K, Hoshii T, Muraguchi T, Tadokoro Y, Ooshio T, Kondo Y, Nakao S, Motoyama N, Hirao A. TGF-β-FOXO signalling maintains leukaemia-initiating cells in chronic myeloid leukaemia. Nature 2010; 463:676-80; PMID:20130650; http://dx.doi.org/10.1038/nature08734
- Sykes SM, Lane SW, Bullinger L, Kalaitzidis D, Yusuf R, Saez B, Ferraro F, Mercier F, Singh H, Brumme KM, et al. AKT/FOXO signaling enforces reversible differentiation blockade in myeloid leukemias. Cell 2011; 146:697-708; PMID:21884932; http://dx.doi.org/10.1016/j.cell.2011.07.032
- Ghaffari S, Jagani Z, Kitidis C, Lodish HF, Khosravi-Far R. Cytokines and BCR-ABL mediate suppression of TRAIL-induced apoptosis through inhibition of forkhead FOXO3a transcription factor. Proc Natl Acad Sci U S A 2003; 100:6523-8; PMID:12750477; http://dx.doi.org/10.1073/pnas.0731871100
- Pellicano F, Scott MT, Helgason GV, Hopcroft LEM, Allan EK, Aspinall-O'Dea M, Copland M, Pierce A, Huntly BJP, Whetton AD, et al. The antiproliferative activity of kinase inhibitors in chronic myeloid leukemia cells is mediated by FOXO transcription factors. Stem Cells 2014; 32:2324-37; PMID:24806995; http://dx.doi.org/10.1002/stem.1748
- Gu T-L, Tothova Z, Scheijen B, Griffin JD, Gilliland DG, Sternberg DW. NPM-ALK fusion kinase of anaplastic large-cell lymphoma regulates survival and proliferative signaling through modulation of FOXO3a. Blood 2004; 103:4622-9; PMID:14962911; http://dx.doi.org/10.1182/blood-2003-03-0820
- Scheijen B, Ngo HT, Kang H, Griffin JD. FLT3 receptors with internal tandem duplications promote cell viability and proliferation by signaling through Foxo proteins. Oncogene 2004; 23:3338-49; PMID:14981546; http://dx.doi.org/10.1038/sj.onc.1207456
- Paik J, Ding Z, Narurkar R, Ramkissoon S, Muller F, Kamoun WS, Chae S-S, Zheng H, Ying H, Mahoney J, et al. FoxOs cooperatively regulate diverse pathways governing neural stem cell homeostasis. Cell Stem Cell 2009; 5:540-53; PMID:19896444; http://dx.doi.org/10.1016/j.stem.2009.09.013
- Renault VM, Rafalski VA, Morgan AA, Salih DAM, Brett JO, Webb AE, Villeda SA, Thekkat PU, Guillerey C, Denko NC, et al. FoxO3 regulates neural stem cell homeostasis. Cell Stem Cell 2009; 5:527-39; PMID:19896443; http://dx.doi.org/10.1016/j.stem.2009.09.014
- Akashi K, Traver D, Miyamoto T, Weissman IL. A clonogenic common myeloid progenitor that gives rise to all myeloid lineages. Nature 2000; 404:193-7; PMID:10724173; http://dx.doi.org/10.1038/35004599
- Yamazaki S, Iwama A, Takayanagi S, Morita Y, Eto K, Ema H, Nakauchi H. Cytokine signals modulated via lipid rafts mimic niche signals and induce hibernation in hematopoietic stem cells. EMBO J 2006; 25:3515-23; PMID:16858398; http://dx.doi.org/10.1038/sj.emboj.7601236
- Warr MR, Binnewies M, Flach J, Reynaud D, Garg T, Malhotra R, Debnath J, Passegué E. FOXO3A directs a protective autophagy program in haematopoietic stem cells. Nature 2013; 494:323-7; PMID:23389440; http://dx.doi.org/10.1038/nature11895
- Brunet A, Sweeney LB, Sturgill JF, Chua KF, Greer PL, Lin Y, Tran H, Ross SE, Mostoslavsky R, Cohen HY, et al. Stress-dependent regulation of FOXO transcription factors by the SIRT1 deacetylase. Science 2004; 303:2011-5; PMID:14976264; http://dx.doi.org/10.1126/science.1094637
- Motta MC, Divecha N, Lemieux M, Kamel C, Chen D, Gu W, Bultsma Y, McBurney M, Guarente L. Mammalian SIRT1 represses forkhead transcription factors. Cell 2004; 116:551-63; PMID:14980222; http://dx.doi.org/10.1016/S0092-8674(04)00126-6
- Lee JY, Nakada D, Yilmaz OH, Tothova Z, Joseph NM, Lim MS, Gilliland DG, Morrison SJ. mTOR activation induces tumor suppressors that inhibit leukemogenesis and deplete hematopoietic stem cells after Pten deletion. Cell Stem Cell 2010; 7:593-605; PMID:21040901; http://dx.doi.org/10.1016/j.stem.2010.09.015
- Ahn JS, Li J, Chen E, Kent DG, Park HJ, Green AR. JAK2V617F mediates resistance to DNA damage-induced apoptosis by modulating FOXO3A localization and Bcl-xL deamidation. Oncogene 2015 Epub Ahead of Print.
- Kobayashi Y, Furukawa-Hibi Y, Chen C, Horio Y, Isobe K, Ikeda K, Motoyama N. SIRT1 is critical regulator of FOXO-mediated transcription in response to oxidative stress. Int J Mol Med 2005; 16:237-43; PMID:16012755
- Daitoku H, Hatta M, Matsuzaki H, Aratani S, Ohshima T, Miyagishi M, Nakajima T, Fukamizu A. Silent information regulator 2 potentiates Foxo1-mediated transcription through its deacetylase activity. Proc Natl Acad Sci U S A 2004; 101:10042-7; PMID:15220471; http://dx.doi.org/10.1073/pnas.0400593101
- Van der Horst A, Tertoolen LGJ, de Vries-Smits LMM, Frye RA, Medema RH, Burgering BMT. FOXO4 is acetylated upon peroxide stress and deacetylated by the longevity protein hSir2(SIRT1). J Biol Chem 2004; 279:28873-9; PMID:15126506 http://dx.doi.org/10.1074/jbc.M401138200;
- Matsuzaki H, Daitoku H, Hatta M, Aoyama H, Yoshimochi K, Fukamizu A. Acetylation of Foxo1 alters its DNA-binding ability and sensitivity to phosphorylation. Proc Natl Acad Sci U S A 2005; 102(32):11278-83; PMID:16076959
- Li X, Li J, Wilson A, Sipple J, Schick J, Pang Q. Fancd2 is required for nuclear retention of Foxo3a in hematopoietic stem cell maintenance. J Biol Chem 2015; 290(5):2715-27; PMID:25505262 http://dx.doi.org/10.1074/jbc.M114.619536
