
ABSTRACT
Preeclampsia is one of the leading causes of maternal and perinatal mortality and morbidity and its pathogenesis is not fully understood. B-cell lymphoma 6 (BCL6), a key regulator of B-lymphocyte development, is altered in preeclamptic placentas. We show here that BCL6 is present in all 3 studied trophoblast cell lines and it is predominantly expressed in trophoblastic HTR-8/SVneo cells derived from a 1st trimester placenta, suggestive of its involvement in trophoblast expansion in the early stage of placental development. BCL6 is strongly stabilized upon stress stimulation. Inhibition of BCL6, by administrating either small interfering RNA or a specific small molecule inhibitor 79–6, reduces proliferation and induces apoptosis in trophoblastic cells. Intriguingly, depletion of BCL6 in HTR-8/SVneo cells results in a mitotic arrest associated with mitotic defects in centrosome integrity, indicative of its involvement in mitotic progression. Thus, like in haematopoietic cells and breast cancer cells, BCL6 promotes proliferation and facilitates survival of trophoblasts under stress situation. Further studies are required to decipher its molecular roles in differentiation, migration and the fusion process of trophoblasts. Whether increased BCL6 observed in preeclamptic placentas is one of the causes or the consequences of preeclampsia warrants further investigations in vivo and in vitro.
Introduction
Preeclampsia is characterized by new onset of hypertension and proteinuria in the second half of gestation and is a consequence of diverse pathophysiological processes associated with endothelial dysfunction and systemic inflammation.Citation1,2 It affects 2–8% of all pregnancies and is one of the leading causes of maternal and perinatal mortality and morbidity worldwide.Citation3,4 Despite intensive research, its pathogenesis is not well understood. Gene analysis has been widely used to study altered expression of important genes in various signaling pathways linked to preeclampsia.Citation5 In a previous study, we have designed our own gene array targeting the critical signal pathways and analyzed placental samples from preeclampsia patients and controls. We have verified that genes associated with angiogenesis and migration pathways are mostly altered in preeclamptic placentas.Citation6,7 Interestingly, several genes including BCL6 have been identified to be linked to preeclampsia.
BCL6, a key regulator of B-lymphocyte development, facilitates proliferative expansion and blocks differentiation to plasma and memory cells.Citation8,9 It is frequently deregulated in B-cell lymphoma and contributes to B cell transformation.Citation10,11 The BCL6 protein is characterized by an N-terminal BTB/POZ domain followed by 3 PEST domains in the middle and C-terminal 6 zinc finger DNA-binding motifs.Citation9 It acts as a potent transcription repressor by directly recruiting class I and II histone deacetylase complexes (HDAC) or indirectly through co-repressors such as SMRT (silencing mediator for retinoid and thyroid hormone receptors) and NCOR (nuclear receptor corepressor).Citation12-15 By doing so, BCL6 represses genes involved in B cell activation and lymphocyte differentiation, inflammation and cell cycle regulation.Citation8 In accordance with its function, BCL6 is highly expressed in B cells of the germinal center.Citation16 Moreover, it is also found in many tissues such as skeletal muscle, breast and prostate.Citation17,18 In support of this observation, recent studies have uncovered that deregulation of BCL6 is involved in breast cancer development by blocking differentiation of breast epithelia cells,Citation18-20 suggesting that BCL6 exerts similar function in non-haematopoietic cells as well.
It has been repeatedly reported that the gene expression of BCL6 is increased in the placenta of patients with early as well as with late preeclampsia.Citation21-26 Its involvement in the pathogenesis remains to be defined. We have recently shown that BCL6 is increased in both mRNA and protein level in preeclamptic placentas.Citation6 Moreover, BCL6 was mainly found in the nucleus and weakly detectable in the cytoplasm of villous cytotrophoblasts, whereas it was only slightly observable in the cytoplasm but barely in the nucleus of villous syncytiotrophoblast.Citation6 In addition, BCL6 is also localized in the nucleus of extravillous trophoblasts. Interestingly, this increased BCL6 expression is well correlated with enhanced FLT1 and LEPTIN,Citation6 2 hallmarks of preeclampsia, implying that this alteration may be involved in the pathogenesis of preeclampsia. To understand its potential involvement, we have focused on the function of BCL6 in the cell cycle and cell survival of trophoblasts.
Results
BCL6 expression and localization in trophoblastic cells
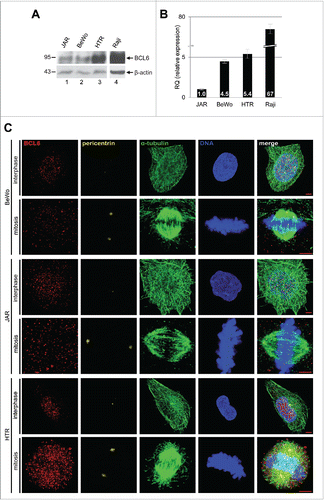
We looked at first at the mRNA and protein expression of BCL6 in 3 well-characterized trophoplastic cell lines: BeWo and JAR, both derived from choriocarcinoma, and HTR-8/SVneo (referred to hereafter as HTR), an immortalized normal 1st trimester trophoblast cell line. In comparison with B-cell lymphoma Raji cells, trophoblastic cells expressed much less BCL6 in mRNA as well as in protein level (). Compared to BeWo and JAR cells, HTR cells displayed a much higher amount of BCL6 (), indicating that BCL6 is of importance in the early stage of placental development. Alternatively, being malignant, BeWo and JAR cells are less dependent on BCL6. To examine subcellular localization, cells were stained for BCL6, the centrosome marker pericentrin, the microtubule marker α-tubulin and DNA for confocal microscopy. BCL6 was to be found in the nucleus in interphase cells and in the cytoplasm in mitotic cells after the nuclear membrane breakdown of 3 trophoblastic cell lines (). The subcellular localization was further corroborated in BeWo and cervical carcinoma HeLa cells expressing Flag-tagged BCL6 (Fig. S1). Thus, like in B-lymphoma cells,Citation15 the transcription repressor BCL6 localizes mostly in the nucleus, supporting our previous observation that BCL6 is predominantly found in the nuclei of trophoblasts in the placenta.Citation6
Figure 1. BCL6 expression and localization in trophoblastic cell lines. (A) Trophoblastic cell lines JAR, BeWo and HTR were harvested for Western blot analysis using antibody against BCL6. B-cell lymphoma cell line Raji was taken as positive control for BCL6. β-actin served as loading control. (B) Relative amount of the BCL6 gene in trophoblastic cells. The results are presented by mean ± SD. RQ: relative quantification by setting the BCL6 value in JAR cells as 1, as described in Materials and Methods. Raji was taken as positive control for BCL6. (C) Subcellular localization of BCL6 in trophoblastic cells. Cells were stained for BCL6, centrosome marker pericentrin, microtubule marker α-tubulin and DNA. Scale bar: 5 µm.
Depletion of BCL6 inhibits proliferation of trophoblastic cells
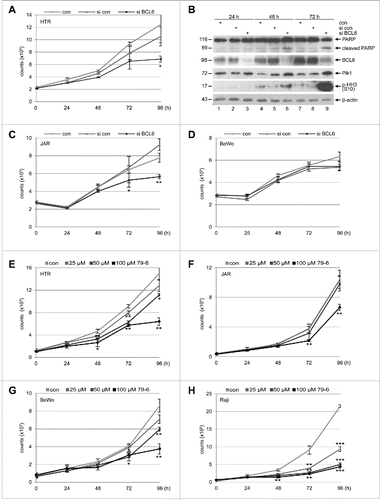
As BCL6 promotes survival and proliferation of B cells,Citation9 we asked if BCL6 affects trophoblastic cells in a similar way. To address this issue, HTR, JAR and BeWo cells were depleted of BCL6 by using siRNA targeting BCL6 and cell viability was measured at different time points. While proliferation of HTR () and JAR cells () was clearly decreased, BeWo cells showed a slightly change (), possibly due to their long doubling time of about 38 h. In particular, HTR cells exhibited a mitotic arrest by presenting increased Polo-like kinase 1 (Plk1) () and phospho-histone H3 (p-HH3, S10) (), 2 important mitotic markers. In addition, the absence of BCL6 in HTR cells induced apoptosis by showing cleaved poly(ADP-ribose) polymerase (PARP) (), an apoptosis marker. To underline these results, trophoblastic cells were treated with 79–6, a small molecule inhibitor specifically targeting BCL6.Citation27 Although in a less extent relative to the B-cell lymphoma cell line Raji (), 79–6 inhibited proliferation of all 3 trophoblastic cells (), implying that the small molecule compound works more efficiently than siRNA. These observations suggest that BCL6 is required for proliferation of trophoblasts and its depletion results in apoptosis. Intriguingly, overexpression of Flag-BCL6 changed hardly the proliferation profile of these trophoblastic cell lines (Fig. S2). This could be possibly explained by enough available amounts of endogenous BCL6 in HTR cells, and by malignant proliferative features of BeWo and JAR cells, which is in accordance with the observation that overexpression of BCL6 affects scarcely proliferation of breast cancer cells.Citation20
Figure 2. Suppression of BCL6 inhibits proliferation of trophoblasts. (A) Cell viability of HTR cells depleted of BCL6. HTR cells were treated with control siRNA (si con) or siRNA targeting BCL6 (si BCL6) and cultured for indicated time periods for evaluating cell viability. Non-treated HTR cells were taken as control (con). The results are presented as mean ± SD and statistically analyzed relative to control siRNA treated HTR cells. *p < 0.05. (B) Western blot analysis. HTR cells were treated as described in (A) and harvested for Western blot analyses with indicated antibodies. β-actin served as loading control. (C) Cell viability of JAR cells depleted of BCL6. JAR cells were treated as described in (A). The results are presented as mean ± SD and statistically analyzed relative to control siRNA treated JAR cells. *p < 0.05; **p < 0.01. (D) Cell viability of BeWo cells depleted of BCL6. Cells were treated as in (A). The results are presented as mean ± SD. (E-H) BCL6 inhibitor 79–6 suppresses proliferation of HTR (E), JAR (F), BeWo (G) and Raji cells (H). Cells were treated with 79–6 at indicated concentrations and harvested at indicated time points for evaluation of cell viability. The results are presented as mean ± SD and statistically analyzed relative to control cells treated with DMSO. *p < 0.05; **p < 0.01; ***p < 0.001. B-cell lymphoma Raji cells were taken as control.
BCL6 deficiency induces a mitotic arrest associated with defects
We observed an increase in the mitotic markers Plk1 and p-HH3 (S10) when BCL6 was suppressed in HTR cells (), suggestive of a mitotic arrest. To corroborate this observation, HTR cells were treated with control siRNA or siRNA targeting BCL6 for 72 h and cell cycle profiles were evaluated by flow cytometry. As shown in , a small but distinctive G2/M peak was observed in HTR cells depleted of BCL6, supported by an increased p-HH3 measured by flow cytometry (), and underscored further by enhanced Plk1 and p-HH3 by Western blot analysis (). The results suggest clearly that HTR cells knocked down of BCL6 have difficulties in passing through mitosis.
Figure 3. BCL6 suppression induces a mitotic arrest. (A) HTR cells were non-treated (con), treated with control siRNA (si con) or siRNA targeting BCL6 (si BCL6) for 72 h and harvested for cell cycle analysis. Cell cycle profiles are presented. (B) Cell cycle distribution was evaluated with the CellQuest software. (C) Treated HTR cells were also stained with p-HH3 (S10) for FACS analysis. The percentages of positive cells are presented. (D) Western blot analysis. β-actin served as loading control. (E-J) The mRNA levels of important mitotic regulators in HTR cells deficient of BCL6. HTR cells were treated with control siRNA (si con) or siRNA targeting BCL6 (si BCL6) for 48 h. Total RNAs were isolated for real-time PCR analysis. The results of Plk1 (E), Aurora B (F), survivin (G), cyclin B1 (H), p21 (I) and p53 (J) are based on 3 independent experiments and presented as mean ± SEM. **p < 0.01. The RQ value of the control siRNA treated cells was defined as 1-fold.
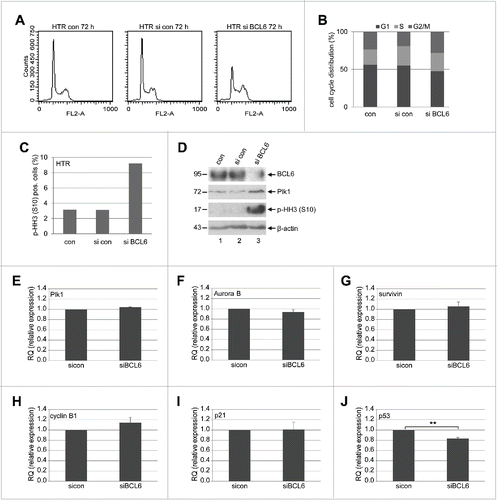
To study the possible mechanisms underlying the mitotic arrest, we looked at the gene expression of the mitotic regulators. The transcription repressor BCL6 targets a large scale of genes which are associated with various cellular functions including cell cycle regulation and cell survival.Citation9 It has been reported that BCL6 promotes proliferation by repressing the cyclin-dependent kinase inhibitor p21,Citation28 p27Citation8 and p53,Citation29 and by increasing cyclin D2,Citation8 which are major interphase regulators. Yet, whether BCL6 affects transcriptionally the mitotic genes is not well defined. To examine this, HTR cells were depleted of BCL6 and the gene expression of several important mitotic regulators was measured. Upon inhibition of BCL6, the gene levels of Plk1 (), a key kinase regulating multiple stages of mitosis,Citation30 Aurora B () and survivin (), the crucial kinase and its regulatory subunit of the chromosomal passenger complex (CPC) responsible for correcting mal-attachments of microtubules with kinetochores, chromosome segregation and cytokinesis,Citation31 were hardly changed, whereas the gene level of cyclin B1, the regulatory subunit of the mitotic master kinase cyclin-dependent kinase 1 (Cdk1), was slightly increased (). Moreover, the tumor suppressor p53 and the cyclin-dependent kinase inhibitor p21, on which we have worked,Citation32-36 are multiple functional and greatly impact the cell cycle. Intriguingly, while the gene expression of p21, an important inhibitor of the interphase and functionally also active in mitosis,Citation35,36 remained nearly unchanged (), the gene level of p53 was however significantly decreased in HTR cells depleted of BCL6 ().
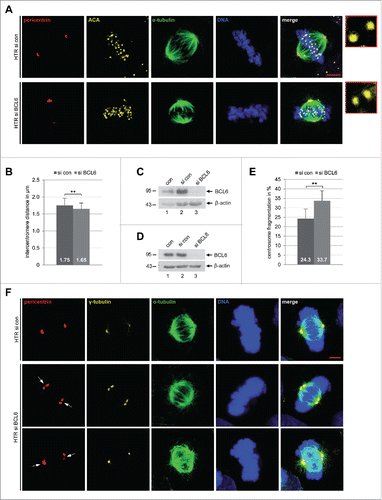
To further investigate the reasons for the mitotic arrest, HTR cells depleted of BCL6 were examined for the sister centromere distance, a functional marker of microtubule-kinetochore attachment, using ACA (anti-centromere antibody) staining in metaphase cells.Citation7 Interestingly, the sister centromere distance was decreased in HTR cells () when they were deficient of BCL6 (). Similar results were also obtained in BeWo cells (Fig. S3A–C). Furthermore, as the centrosome integrity is important for a smooth progression of mitosis,Citation37 we wondered if alteration could occur in trophoblastic cells in the absence of BCL6. HTR cells were treated with control siRNA or siRNA against BCL6 for 48 h and stained for pericentrin and γ-tubulin, 2 important components of the pericentriolar material (PCM), α-tubulin and DNA. Indeed, an increase in centrosome fragmentation and/or clustering was observed in HTR cells (), which were deficient of BCL6 (). Similar results were also obtained with HeLa cells (Fig. S3 D–F).
Figure 4. Reduced sister centromere distance and increased centrosome fragmentation upon depletion of BCL6. (A) HTR cells were treated with control siRNA (si con) or siRNA targeting BCL6 (si BCL6) for 48 h and stained for pericentrin, anti-centromere antibody (ACA), α-tubulin and DNA. Representatives are shown. Scale bar: 5 µm. Insets: 10 time amplified ACA staining. (B) The distance of the sister centromere was measured (60 pairs for each condition) and the results are presented as mean ± SD. **p < 0.01. (C) Control Western blot analysis for (A) and (B) with antibody against BCL6. β-actin served as loading control. (D) Control Western blot analysis with antibody against BCL6 for (E) and (F). β-actin served as loading control. (E) HTR cells were treated as in (A) and stained for pericentrin, γ-tubulin, α-tubulin and DNA. The numbers of cells with fragmented centrosome(s) were evaluated (100 metaphase cells for each condition). The results are based on 3 independent experiments and presented as mean ± SEM. **p < 0.01. (F) Examples are shown. White arrows: fragmented centrosomes. Scale bar: 5 µm.
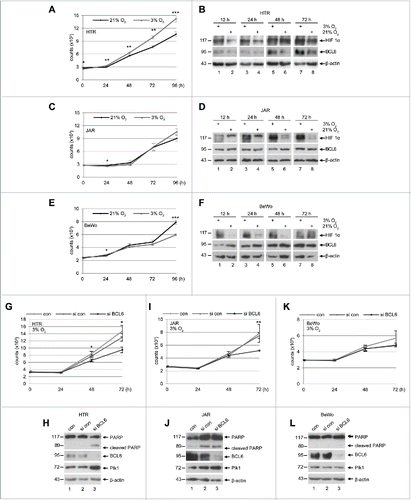
BCL6 is important for proliferation of HTR cells under hypoxia
As shallow placentation with hypoxia is characteristic for preeclamptic placentas,Citation38 we wondered the expression pattern of BCL6 under low concentration of oxygen. To clarify this, trophoblastic cells were cultured either in normoxia (21% O2) or hypoxia (3% O2). Interestingly, HTR cells welcomed hypoxia by showing increased proliferation (), in line with the notion that hypoxia is a physiological environment for the trophoblasts in the early stage of placental development. Under hypoxia, BCL6 was increased in HTR cells at 48 and 72 h (), accompanied by stabilized hypoxia-inducible factor 1α (HIF 1α) (). These results suggest that BCL6 is important for the expansion of HTR cells under hypoxic situation. In contrast, hypoxia hardly affected the proliferation of JAR and BeWo cells (), except the later slowed down at 96 h (). While the expression level of BCL6 changed little in JAR and BeWo cells till 48 h and yet increased slightly at 72 h (, 2nd row), HIF 1α was however already induced at 12 h and this induction was maintained throughout the time course (), implying that HIF 1α plays an immediate and important role to maintain proliferation of these malignant trophoblasts upon hypoxia and yet needs support from BCL6 to sustain their expansion at late time points (72 to 96 h). In support of the notion that BCL6 is required for the proliferation of HTR cells under hypoxia, deficiency of BCL6 strongly inhibited their viability () followed by a mitotic arrest demonstrated by an increase in Plk1 () and apoptosis induction evidenced by cleaved PARP (). Under hypoxia, inhibition of BCL6 slowed down the proliferation of JAR cells at 72 h (), whereas BeWo cells changed little (). Collectively, these data suggest that BCL6, like in germinal center B cells, is required for survival and proliferation of trophoblastic cells, especially HTR cells, the 1st trimester trophoblastic cells.
Figure 5. Proliferation pattern of trophoblasts under hypoxia and depletion of BCL6 reduces proliferation. (A) HTR cells were cultured in an incubator supplied either with 21% O2 (normoxia) or with 3% O2 (hypoxia) for indicated time periods for the evaluation of cell viability. The results are presented as mean ± SD and statistically analyzed. ***p < 0.001, **p < 0.01, *p < 0.05. (B) HTR cells were treated as in (A) and harvested for Western blot analysis with indicated antibodies. β-actin served as loading control. (C) JAR cells were treated as in (A) for viability evaluation. The results are presented as mean ± SD and statistically analyzed. *p < 0.05. (D) Treated JAR cells were harvested for Western blot analysis with indicated antibodies. β-actin served as loading control. (E) BeWo cells were treated as in (A) for viability evaluation. The results are presented as mean ± SD and statistically analyzed. *p < 0.05, ***p < 0.001. (F) Treated BeWo cells were harvested for Western blot analysis with indicated antibodies. β-actin served as loading control. (G) HTR cells were non-treated, treated with control siRNA or siRNA against BCL6 and cultured for indicated time periods under hypoxia. The viability was measured and the results are presented as mean ± SD and statistically analyzed. *p < 0.05. (H) Cellular lysates were prepared from HTR cells for Western blot analysis with indicated antibodies. β-actin served as loading control. (I) JAR cells were non-treated, treated with control siRNA or siRNA against BCL6 and cultured for indicated time periods under hypoxia. The viability was measured and the results are presented as mean ± SD and statistically analyzed. **p < 0.01. (J) Cellular lysates were prepared from JAR cells for Western blot analyses with indicated antibodies. β-actin served as loading control. (K) BeWo cells were non-treated, treated with control siRNA or siRNA against BCL6 and further cultured for indicated time periods under hypoxia. The viability was measured and the results are presented as mean ± SD. (L) Cellular lysates were prepared from BeWo cells for Western blot analysis with indicated antibodies. β-actin served as loading control.
BCL6 is stabilized and promotes survival of trophoblasts under cellular stress
The amount of BCL6 was increased in HTR cells exposed to hypoxia (). To examine its protein turnover in trophoblastic cells, HTR cells were subjected to cycloheximide (CHX), a protein synthesis inhibitor, and harvested at indicated time points for Western blot analysis. BCL6 is a short-lived protein (), with a half-life time of about 1.3 h (). The preeclamptic placenta is characterized by hypoxia and ischemia releasing a variety of stress mediators including reactive oxygen species (ROS) such as hydrogen peroxide (H2O2).Citation39 To define the effect of cellular stress on the turnover of BCL6, HTR cells were subjected to H2O2 and the protein levels of BCL6 were monitored by Western blot analysis. Indeed, H2O2 stabilized BCL6 already at 30 min and BCL6 was kept stable throughout the 7 h course (), accompanied by phosphorylated p53 (S15), a stress indicator, especially from 30 min to 3 h (). The treatment of H2O2 retained BCL6 relatively stable even in the absence of protein synthesis (), with an extended half-life time of about 2.6 h (). These results suggest that BCL6 is an instable protein in general but is stabilized upon stress stimulation, possibly linked to post-modifications, like phosphorylation.Citation40
Figure 6. BCL6 is stabilized and its suppression induces apoptosis under stress situation. (A) Western blot analysis. HTR cells were subjected to 25 µM CHX (left panel), 50 µM H2O2 (middle panel) or both (right panel), for indicated time periods and harvested for Western blot analysis with indicated antibodies. β-actin served as loading control. (B) Quantification of BCL6 in (A), relative to corresponding β-actin. The dot lines indicate the half-life time of corresponding BCL6. (C) HTR cells were non-transfected as control (con), transfected with control siRNA (si con) or siRNA against BCL6 (si BCL6) for 24 h and subjected to increasing concentrations of H2O2 for further 12 h. Cells were then harvested for Western blot analysis with BCL6 antibody. β-actin served as loading control. (D) Relative activity of caspase-3/7. The value of non-transfected and non-treated cells was defined as 1-fold. ***p < 0.001, **p < 0.01.
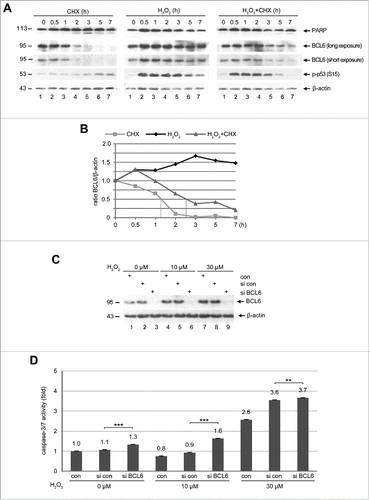
To elucidate the role of BCL6 under stress, HTR cells were transfected with control siRNA or siRNA targeting BCL6 for 24 h and then subjected to increasing concentrations of H2O2 for 12 h. Cellular extracts were prepared for Western blot analysis. BCL6 was efficiently depleted in cells treated with siRNA targeting BCL6 (). Again, BCL6 was stabilized upon H2O2 treatment in control cells (). Interestingly, the early apoptosis induction, evidenced by active caspase-3/7, was more demonstrative upon depletion of BCL6 (), and almost doubled in combination with a low dose of H2O2 treatment (). Yet, cells depleted of BCL6 showed a slight change upon 30 µM H2O2 treatment, which possibly represents a highly toxic dosage destroying cells. Collectively, the data indicate that the presence of BCL6 protects trophoblastic cells from apoptosis induction and promotes their survival in stress situation.
Discussion
BCL6, the key regulator of B cell differentiation, targets a great body of genes associated with various cellular functions, including proliferation, cell survival and DNA damage response in germinal-center B cells.Citation9,41 Besides haematopoietic cells, alteration of BCL6 is linked to breast cancer progression.Citation18,19 A recent study has further revealed that BCL6 expression promotes proliferation and survival of breast cancer cells and inhibiting BCL6 leads to apoptosis of these cells by targeting a cohort of genes.Citation20 It has been reported that proliferation and apoptosis of trophoblasts are deregulated in preeclamptic placentas.Citation42-44 Interestingly, an increase in the mRNA of BCL6 in preeclamptic placentas has been observed independently by several groups,Citation21-23,26 yet its roles in the development of preeclampsia remain to be clarified. Recently, we have shown that BCL6 is indeed altered in preeclmaptic placentas, not only at its mRNA but also at its protein level.Citation6 In this study we have focused on the function of BCL6 in proliferation and cell survival in trophoblastic cell lines.
We show here that BCL6 is present in all 3 trophoblastic cell lines, and in particular, richly expressed in HTR cells derived from the 1st trimester placenta. Moreover, it localizes in the nuclei of trophoblastic interphase cells, in line with our previous observation that BCL6 is predominantly to be found in the nuclei of trophoblasts in the placenta.Citation6 Importantly, BCL6 is required for proliferation of trophoblastic cells, especially for HTR cells, suggestive of BCL6 being crucial for trophoblast expansion in the early stage of placental development. Inhibiting BCL6, by administrating either siRNA or the small molecule inhibitor 79–6, reduces proliferation and induces apoptosis. Intriguingly, BCL6 is stabilized in HTR cells upon low oxygen supply or exposure to H2O2 treatment, indicating that BCL6 supports survival of trophoblasts under stress situation. Thus, like for haematopoietic and breast cancer cells, BCL6 is required for proliferation and protects cells from apoptosis induction, leading to cell survival under the stress environment in the placenta.
Unexpected, depletion of BCL6 induces a small but distinct mitotic arrest in HTR cells evidenced by an increased G2/M peak and enhanced mitotic markers p-HH3 and Plk1. Moreover, this mitotic arrest is associated with shortened sister centromere distance and fragmented/clustered centrosomes in trophoblasts, suggesting that BCL6 could be, directly or indirectly, involved in mitotic progression by interfering with microtubule-kinetochore attachment and centrosome integrity. BCL6 functions as an important transcription repressor by targeting a large set of genes.Citation9,45 Specifically, BCL6 represses the tumor suppressor gene TP53 (p53),Citation29 cyclin-dependent kinase inhibitor gene CDKN1A (p21),Citation28 DNA damage checkpoint genes ATRCitation41 and CHEK1 (Chk1),Citation46 allowing cells to proliferate by ignoring DNA damage, facilitating accumulation of genome instability. Of note, p53 is repressed by BCL6 in germinal center B cells,Citation29 whereas it is reduced in the 1st trimester trophoblast HTR cells depleted of BCL6, implying that BCL6 could differentially affect p53 based on the cellular context. BCL6 may indirectly activate p53 in trophoblasts to meet the need of the early stage development of the placenta, e.g. cell survival. Further study is warranted to test this hypothesis. Nevertheless, the BCL6 targets, p53, p21, ATR and Chk1, are also highly engaged in crucial events in mitosis progression: p53 is involved in centrosome integrity,Citation47 Chk1 protects cells against chromatin bridges in anaphase,Citation48 and ATR participates the spindle assembly checkpoint.Citation49 Moreover, our work highlights that p21 is crucial in mitosis besides its fundamental roles in the interphase and its knockdown causes mitotic defects.Citation35 Thus, deregulation of BCL6 in trophoblasts might result in deregulation of these targeted molecules contributing to mitotic defects. Our data suggest for the first time that properly regulated BCL6 is important for a smooth mitotic progression of trophoblasts. These data prompt us to hypothesize that altered BCL6 in preeclamptic placentasCitation6 could affect mitotic progression and facilitate accumulation of DNA damage in trophoblasts. This in return could interfere with other functions of trophoblasts, like differentiation, invasion or fusion. It is interesting to directly delineate the relationship between BCL6 and important mitotic players in trophoblasts and other cells.
In summary, we show that BCL6 is crucial for proliferation and survival of trophoblasts by blocking apoptosis, in particular, under stress situation. Considering its importance in expansion and survival of trophoblasts and its alteration in preeclamptic placentas, we assume that altered BCL6 contributes to the development of preeclampsia. Whether increased BCL6 observed in preeclamptic placentas is one of the causes of preeclampsia, due to epigenetic changes in trophoblasts, or the consequence of deregulated hormones/cytokines, hypoxia and oxidative stress in the placenta, warrants further investigations in vivo and in vitro.
Materials and methods
Cell culture, inhibitors and cell cycle analysis
HeLa, Raji, BeWo, JAR and HTR-8/SVneo (HTR)Citation50 cells were cultured as instructed. H2O2 was obtained from Applichem (Darmstadt), BCL6 inhibitor 79–6 from Calbiochem® (Merck Millipore, Darmstadt) and cycloheximide (CHX) from Sigma-Aldrich (Taufkirchen). Cell cycle profiles were analyzed using a FACSCalibur (BD Biosciences, Heidelberg) as described.Citation51,52 Briefly, cells were harvested, washed with PBS, fixed in chilled 70% ethanol at 4°C for at least 30 min, treated with 1 mg/ml of RNase A (Sigma-Aldrich) and stained with 100 μg/ml of propidium iodide for 30 min. DNA content was determined by FACS. The data were analyzed with the BD CellQuest™ Pro software (BD Biosciences).
The measurement of the mitotic fraction was carried out as described.Citation33 Briefly, treated cells were trypsinized, washed twice with pre-warmed PBS, fixed and permeabilized with 2% paraformaldehyde and 0.1% Triton X-100 for 15 min at 37°C. Cells were blocked with antibody dilution buffer (10 mM Tris-HCl pH 7.5, 0.9% NaCl, 5 mM EDTA, 1 mg/ml BSA, 10% FCS) for 15 min at 37°C prior to be incubated with mouse monoclonal antibody against pHH3 (S10, Merck Millipore) for 1 h at 37°C, followed by 2 time wash. Cells were then incubated with secondary FITC-labeled polyclonal donkey anti-mouse antibody (DAKO, Hamburg) for 30 min at 37°C. Finally, the stained cells were evaluated with a FACSCalibur (BD Biosciences). The percentage of positive cells was determined with BD CellQuest™ Pro software (BD Biosciences).
Western blot analysis and immunofluorescence staining
Cell lysis was performed using RIPA buffer (50 mM Tris-HCl pH 8.0, 150 mM NaCl, 1% NP-40, 0.5% Na-desoxycholate, 0.1% SDS, 1 mM NaF, 0.4 mM PMSF, 0.1 mM Na3VO4, protease inhibitor Cocktail cOmplete™ and phosphatase inhibitor cocktail PhosSTOP™ (Roche, Mannheim)). Western blot analysis was performed, as previously described.Citation7,36,53 The following antibodies were used for Western blot analysis: mouse monoclonal antibody against BCL6 (1:500, DAKO), mouse monoclonal antibody against Plk1 (1:1000, Santa Cruz Biotechnology, Heidelberg), rabbit polyclonal antibodies against phospho-p53 (S15) (1:500) and against poly(ADP-ribose) polymerase (PARP) (1:1000, Cell Signaling, Danvers), rabbit polyclonal antibody against phospho-HH3 (S10, 1:750, Merck Millipore), rabbit polyclonal antibody against HIF1-α (1:1000, Bethyl, Montgomery), and mouse monoclonal antibodies against Flag tag and β-actin (1: 1000 and 1:100,000, respectively, Sigma-Aldrich).
Indirect immunofluorescence staining was performed as described.Citation53-55 In brief, control or treated cells were fixed for 15 min with 4% PFA containing 0.1% Triton X-100 at room temperature. The following primary antibodies were used for staining: polyclonal rabbit antibody against pericentrin (1:800, Abcam, Cambridge), mouse monoclonal antibody against BCL6 (1:500, Santa Cruz Biotechnology), immune serum against centromere (1:400, anti-centromere antibody, ACA, ImmunoVision, Springdale), mouse monoclonal antibody against Flag tag and FITC-conjugated mouse monoclonal antibody against α-tubulin (1:200 and 1:500, respectively, Sigma-Aldrich). DNA was stained using DAPI (4″,6-diamidino-2-phenylindole-dihydrochlorid) (Roche). Slides were examined using an Axio Imager 7.1 microscope (Carl Zeiss, Hallbergmoos) and images were taken using an Axio Cam MRm camera (Carl Zeiss). The immunofluorescence stained slides were also examined by a confocal laser scanning microscope (CLSM) (Leica CTR 6500, Heidelberg). Images were processed using Adobe Photoshop software (Adobe Systems, San José).
siRNA transfection, plasmid cloning and transfection, active caspase-3/-7 measurement and cell proliferation assay
siRNA targeting BCL6 (sense: CCUUGUGACAAGGCCAGCA and antisense: UGCUGGCCUUGUCACAAGG) was manufactured by Sigma-Aldrich. Control siRNA was obtained from QIAGEN (Hilden). siRNA (30 nM, unless otherwise indicated) was transiently transfected using transfection reagent Oligofectamine™ (Life Technologies, Carlsbad) as instructed. For cloning of BCL6 construct, the cDNA of full-length human BCL6 was obtained from RZPD (IRATp970F0111D, Berlin) and was cloned into EcoR1/BamH1 sites of p3xFLAG-CMV7.1 (Invitrogen, Carlsbad, CA, USA) and confirmed by DNA sequencing. Plasmid transfection was carried out by using FuGENE® HD transfection reagent (Promega GmbH, Mannheim), as described.Citation56
The activity of caspase-3/7 was analyzed using Caspase-Glo® 3/7 Assay (Promega GmbH). Cell proliferation assays were carried out by using CellTiter-Blue® Cell Viability Assay (Promega GmbH) on treated cells in 96-well plates, based on the reduction of the indicator dye resazurin into resorufin by viable cells. 20 µl of CellTiter-Blue® reagent was added to each well and then incubated at 37°C with 5% CO2 for 4 h before fluorescence reading using a Wallac Victor 1420 Multilabel Counter (Perkin Elmer, Waltham). Experiments were performed in triplicate.
RNA extraction, real-time PCR and data analysis
Total RNAs were extracted with QIAshredder™ and RNeasy® Mini Kit according to the manual instructions (QIAGEN, Hilden). Reverse transcription was performed using High Capacity cDNA Reverse Transcription Kit as instructed (Applied Biosystems, Darmstadt). The primers and probes for studied genes were obtained from Applied Biosystems. Real-time PCR was performed with a StepOnePlus™ Real-Time PCR System (Applied Biosystems). The data were analyzed using StepOne™ Software v2.2.2 (Applied Biosystems). The final results are represented as relative quantification (RQ) as described.Citation6,7
Evaluation of fragmented centrosomes and measurement of sister centromere distance
For evaluating fragmentation of centrosomes, cells were treated with control siRNA or siRNA against BCL6 for 48 h. Cells were then fixed for 10 min at −20°C with MeOH and stained for pericentrin, γ-tubulin (1:200, polyclonal rabbit, Abcam), α-tubulin and DNA. The cells with fragmented centrosomes were evaluated with an Axio Imager 7.1 microscope (Carl Zeiss). For measuring sister centromere distance, cells were treated as for evaluating fragmented centrosomes and stained for pericentrin, α-tubulin, ACA and DNA. The distance of sister centromere, defined as the end-to-end-point length between both ACA staining dots, was measured by using a confocal laser scanning microscope (CLSM, Leica CTR 6500) with LAS AF software (Leica, Heidelberg). Images were processed using Adobe Photoshop. The experiments were independently carried out 3 times.
Statistical analysis
The student's t-test (2 tailed and paired) was used to evaluate the significance of difference between 2 groups (control siRNA against siRNA targeting BCL6) with normal distribution. Difference was considered as statistically significant when p< 0.05.
Abbreviations
| BCL6 | = | B-cell lymphoma 6 |
| Plk1 | = | Polo-like kinase 1 |
| PARP | = | poly(ADP-ribose) polymerase |
| siRNA | = | small interfering RNA |
| CHX | = | cycloheximide |
| CPC | = | chromosomal passenger complex |
| PCM | = | pericentriolar material |
| HIF 1α | = | hypoxia-inducible factor 1α |
| H2O2 | = | hydrogen peroxide |
Disclosure of Potential Conflicts of Interest
The authors declare no conflicts of interest.
Fig._S1.eps
Download EPS Image (9 MB)Acknowledgments
We thank Dr. Charles H. Graham, Queen's University at Kingston, for kindly providing us the cell line HTR-8/SVneo. We thank also Ms. Hannah Salecker for technical assistance
References
- Roberts JM, Hubel CA. The two stage model of preeclampsia: variations on the theme. Placenta. 2009; 30 Suppl (A): S32-7; PMID:19070896; http://dx.doi.org/10.1016/j.placenta.2008.11.009
- Redman CW, Sargent IL. Placental stress and pre-eclampsia: a revised view. Placenta. 2009; 30 Suppl (A): S38-S42; PMID:19138798; http://dx.doi.org/10.1016/j.placenta.2008.11.021
- Huppertz B. Placental origins of preeclampsia: challenging the current hypothesis. Hypertension. 2008; 51(4): 970-5; PMID:18259009; http://dx.doi.org/10.1161/HYPERTENSIONAHA.107.107607
- Duley L. The global impact of pre-eclampsia and eclampsia. Semin Perinatol. 2009; 33(3): 130-7; PMID:19464502; http://dx.doi.org/10.1053/j.semperi.2009.02.010
- Louwen F, Muschol-Steinmetz C, Reinhard J, Reitter A, Yuan J. A lesson for cancer research: placental microarray gene analysis in preeclampsia. Oncotarget. 2012; 3(8): 759-73; PMID:22929622; http://dx.doi.org/10.18632/oncotarget.595
- Louwen F, Muschol-Steinmetz C, Friemel A, Kampf AK, Tottel E, Reinhard J, Yuan J. Targeted gene analysis: increased B-cell lymphoma 6 in preeclamptic placentas. Hum Pathol. 2014; 45(6): 1234-42; PMID:24767250; http://dx.doi.org/10.1016/j.humpath.2014.02.002
- Muschol-Steinmetz C, Friemel A, Kreis NN, Reinhard J, Yuan J, Louwen F. Function of survivin in trophoblastic cells of the placenta. PLoS One. 2013; 8(9): e73337; PMID:24069188; http://dx.doi.org/10.1371/journal.pone.0073337
- Shaffer AL, Yu X, He Y, Boldrick J, Chan EP, Staudt LM. BCL-6 represses genes that function in lymphocyte differentiation, inflammation, and cell cycle control. Immunity. 2000; 13(2): 199-212; PMID:10981963; http://dx.doi.org/10.1016/S1074-7613(00)00020-0
- Basso K, Dalla-Favera R. Roles of BCL6 in normal and transformed germinal center B cells. Immunol Rev. 2012; 247(1): 172-83; PMID:22500840; http://dx.doi.org/10.1111/j.1600-065X.2012.01112.x
- Baron BW, Nucifora G, McCabe N, Espinosa R, III, Le Beau MM, McKeithan TW. Identification of the gene associated with the recurring chromosomal translocations t(3;14)(q27;q32) and t(3;22)(q27;q11) in B-cell lymphomas. Proc Natl Acad Sci U S A. 1993; 90(11): 5262-6; PMID:8506375; http://dx.doi.org/10.1073/pnas.90.11.5262
- Ye BH, Lista F, Lo CF, Knowles DM, Offit K, Chaganti RS, Dalla-Favera R. Alterations of a zinc finger-encoding gene, BCL-6, in diffuse large-cell lymphoma. Science. 1993; 262(5134): 747-50; PMID:8235596; http://dx.doi.org/10.1126/science.8235596
- Lemercier C, Brocard MP, Puvion-Dutilleul F, Kao HY, Albagli O, Khochbin S. Class II histone deacetylases are directly recruited by BCL6 transcriptional repressor. J Biol Chem. 2002; 277(24): 22045-52; PMID:11929873; http://dx.doi.org/10.1074/jbc.M201736200
- Wong CW, Privalsky ML. Components of the SMRT corepressor complex exhibit distinctive interactions with the POZ domain oncoproteins PLZF, PLZF-RARalpha, and BCL-6. J Biol Chem. 1998; 273(42): 27695-702; PMID:9765306; http://dx.doi.org/10.1074/jbc.273.42.27695
- Ahmad KF, Melnick A, Lax S, Bouchard D, Liu J, Kiang CL, Mayer S, Takahashi S, Licht JD, Prive GG. Mechanism of SMRT corepressor recruitment by the BCL6 BTB domain. Mol Cell. 2003; 12(6): 1551-64; PMID:14690607; http://dx.doi.org/10.1016/S1097-2765(03)00454-4
- Huynh KD, Bardwell VJ. The BCL-6 POZ domain and other POZ domains interact with the co-repressors N-CoR and SMRT. Oncogene. 1998; 17(19): 2473-84; PMID:9824158; http://dx.doi.org/10.1038/sj.onc.1202197
- Dent AL, Vasanwala FH, Toney LM. Regulation of gene expression by the proto-oncogene BCL-6. Crit Rev Oncol Hematol. 2002; 41(1): 1-9; PMID:11796228; http://dx.doi.org/10.1016/S1040-8428(01)00164-0
- Bajalica-Lagercrantz S, Piehl F, Farnebo F, Larsson C, Lagercrantz J. Expression of the BCL6 gene in the pre- and postnatal mouse. Biochem Biophys Res Commun. 1998; 247(2): 357-60; PMID:9642131; http://dx.doi.org/10.1006/bbrc.1998.8551
- Logarajah S, Hunter P, Kraman M, Steele D, Lakhani S, Bobrow L, Venkitaraman A, Wagner S. BCL-6 is expressed in breast cancer and prevents mammary epithelial differentiation. Oncogene. 2003; 22(36): 5572-8; PMID:12944904; http://dx.doi.org/10.1038/sj.onc.1206689
- Bos R, van Diest PJ, van der Groep P, Greijer AE, Hermsen MA, Heijnen I, Meijer GA, Baak JP, Pinedo HM, van der Wall E, et al. Protein expression of B-cell lymphoma gene 6 (BCL-6) in invasive breast cancer is associated with cyclin D1 and hypoxia-inducible factor-1alpha (HIF-1alpha). Oncogene. 2003; 22(55): 8948-51; PMID:14654791; http://dx.doi.org/10.1038/sj.onc.1206995
- Walker SR, Liu S, Xiang M, Nicolais M, Hatzi K, Giannopoulou E, Elemento O, Cerchietti L, Melnick A, Frank DA. The transcriptional modulator BCL6 as a molecular target for breast cancer therapy. Oncogene. 2015; 34(9): 1073-82; PMID:24662818; http://dx.doi.org/10.1038/onc.2014.61
- Winn VD, Gormley M, Paquet AC, Kjaer-Sorensen K, Kramer A, Rumer KK, Haimov-Kochman R, Yeh RF, Overgaard MT, Varki A, et al. Severe preeclampsia-related changes in gene expression at the maternal-fetal interface include sialic acid-binding immunoglobulin-like lectin-6 and pappalysin-2. Endocrinology. 2009; 150(1): 452-62; PMID:18818296; http://dx.doi.org/10.1210/en.2008-0990
- Nishizawa H, Ota S, Suzuki M, Kato T, Sekiya T, Kurahashi H, Udagawa Y. Comparative gene expression profiling of placentas from patients with severe pre-eclampsia and unexplained fetal growth restriction. Reprod Biol Endocrinol. 2011; 9: 107; PMID:21810232; http://dx.doi.org/10.1186/1477-7827-9-107
- Tsai S, Hardison NE, James AH, Motsinger-Reif AA, Bischoff SR, Thames BH, Piedrahita JA. Transcriptional profiling of human placentas from pregnancies complicated by preeclampsia reveals disregulation of sialic acid acetylesterase and immune signalling pathways. Placenta. 2011; 32(2): 175-82; PMID:21183218; http://dx.doi.org/10.1016/j.placenta.2010.11.014
- Enquobahrie DA, Meller M, Rice K, Psaty BM, Siscovick DS, Williams MA. Differential placental gene expression in preeclampsia. Am J Obstet Gynecol. 2008; 199(5): 566-11; PMID:18533121; http://dx.doi.org/10.1016/j.ajog.2008.04.020
- Trifonova EA, Gabidulina TV, Ershov NI, Serebrova VN, Vorozhishcheva AY, Stepanov VA. Analysis of the placental tissue transcriptome of normal and preeclampsia complicated pregnancies. Acta Naturae. 2014; 6(2): 71-83; PMID:25093114
- Sitras V, Paulssen RH, Gronaas H, Leirvik J, Hanssen TA, Vartun A, Acharya G. Differential placental gene expression in severe preeclampsia. Placenta. 2009; 30(5): 424-33; PMID:19249095; http://dx.doi.org/10.1016/j.placenta.2009.01.012
- Cerchietti LC, Ghetu AF, Zhu X, Da Silva GF, Zhong S, Matthews M, Bunting KL, Polo JM, Fares C, Arrowsmith CH, et al. A small-molecule inhibitor of BCL6 kills DLBCL cells in vitro and in vivo. Cancer Cell. 2010; 17(4): 400-11; PMID:20385364; http://dx.doi.org/10.1016/j.ccr.2009.12.050
- Phan RT, Saito M, Basso K, Niu H, Dalla-Favera R. BCL6 interacts with the transcription factor Miz-1 to suppress the cyclin-dependent kinase inhibitor p21 and cell cycle arrest in germinal center B cells. Nat Immunol. 2005; 6(10): 1054-60; PMID:16142238; http://dx.doi.org/10.1038/ni1245
- Phan RT, Dalla-Favera R. The BCL6 proto-oncogene suppresses p53 expression in germinal-centre B cells. Nature. 2004; 432(7017): 635-9; PMID:15577913; http://dx.doi.org/10.1038/nature03147
- Louwen F, Yuan J. Battle of the eternal rivals: restoring functional p53 and inhibiting Polo-like kinase 1 as cancer therapy. Oncotarget. 2013; 4(7): 958-71; PMID:23948487; http://dx.doi.org/10.18632/oncotarget.1096
- Carmena M, Wheelock M, Funabiki H, Earnshaw WC. The chromosomal passenger complex (CPC): from easy rider to the godfather of mitosis. Nat Rev Mol Cell Biol. 2012; 13(12): 789-803; PMID:23175282; http://dx.doi.org/10.1038/nrm3474
- Sanhaji M, Kreis NN, Zimmer B, Berg T, Louwen F, Yuan J. p53 is not directly relevant to the response of Polo-like kinase 1 inhibitors. Cell Cycle. 2012; 11(3): 543-53; PMID:22262171; http://dx.doi.org/10.4161/cc.11.3.19076
- Sanhaji M, Louwen F, Zimmer B, Kreis NN, Roth S, Yuan J. Polo-like kinase 1 inhibitors, mitotic stress and the tumor suppressor p53. Cell Cycle. 2013; 12(9): 1340-51; PMID:23574746; http://dx.doi.org/10.4161/cc.24573
- Kreis NN, Sommer K, Sanhaji M, Kramer A, Matthess Y, Kaufmann M, Strebhardt K, Yuan J. Long-term downregulation of Polo-like kinase 1 increases the cyclin-dependent kinase inhibitor p21(WAF1/CIP1). Cell Cycle. 2009; 8(3): 460-472; PMID:19177004; http://dx.doi.org/10.4161/cc.8.3.7651
- Kreis NN, Sanhaji M, Rieger MA, Louwen F, Yuan J. p21Waf1/Cip1 deficiency causes multiple mitotic defects in tumor cells. Oncogene. 2014; 33(50): 5716-28; PMID:24317508; http://dx.doi.org/10.1038/onc.2013.518
- Kreis NN, Louwen F, Zimmer B, Yuan J. Loss of p21Cip1/CDKN1A renders cancer cells susceptible to Polo-like kinase 1 inhibition. Oncotarget. 2015; 6(9): 6611-26; PMID:25483104; http://dx.doi.org/10.18632/oncotarget.2844
- Nigg EA, Stearns T. The centrosome cycle: Centriole biogenesis, duplication and inherent asymmetries. Nat Cell Biol. 2011; 13(10): 1154-60; PMID:21968988; http://dx.doi.org/10.1038/ncb2345
- Roberts JM, Hubel CA. The two stage model of preeclampsia: variations on the theme. Placenta. 2009; 30 Suppl (A): S32-7; PMID:19070896; http://dx.doi.org/10.1016/j.placenta.2008.11.009
- Kharfi AA, Leblanc S, Ouellet A, Moutquin JM. Dual action of H2O2 on placental hCG secretion: implications for oxidative stress in preeclampsia. Clin Biochem. 2007; 40(1–2): 94-7; PMID:17150203; http://dx.doi.org/10.1016/j.clinbiochem.2006.10.008
- Basso K, Dalla-Favera R. BCL6: master regulator of the germinal center reaction and key oncogene in B cell lymphomagenesis. Adv Immunol. 2010; 105: 193-210; PMID:20510734; http://dx.doi.org/10.1016/S0065-2776(10)05007-8
- Ranuncolo SM, Polo JM, Dierov J, Singer M, Kuo T, Greally J, Green R, Carroll M, Melnick A. Bcl-6 mediates the germinal center B cell phenotype and lymphomagenesis through transcriptional repression of the DNA-damage sensor ATR. Nat Immunol. 2007; 8(7): 705-14; PMID:17558410; http://dx.doi.org/10.1038/ni1478
- Redline RW, Patterson P. Pre-eclampsia is associated with an excess of proliferative immature intermediate trophoblast. Hum Pathol. 1995; 26(6): 594-600; PMID:7774887; http://dx.doi.org/10.1016/0046-8177(95)90162-0
- Jeschke U, Schiessl B, Mylonas I, Kunze S, Kuhn C, Schulze S, Friese K, Mayr D. Expression of the proliferation marker Ki-67 and of p53 tumor protein in trophoblastic tissue of preeclamptic, HELLP, and intrauterine growth-restricted pregnancies. Int J Gynecol Pathol. 2006; 25(4): 354-60; PMID:16990712; http://dx.doi.org/10.1097/01.pgp.0000225838.29127.6
- Sharp AN, Heazell AE, Crocker IP, Mor G. Placental apoptosis in health and disease. Am J Reprod Immunol. 2010; 64(3): 159-69; PMID:20367628; http://dx.doi.org/10.1111/j.1600-0897.2010.00837.x
- Hatzi K, Melnick A. Breaking bad in the germinal center: how deregulation of BCL6 contributes to lymphomagenesis. Trends Mol Med. 2014; 20(6): 343-52; PMID:24698494; http://dx.doi.org/10.1016/j.molmed.2014.03.001
- Ranuncolo SM, Polo JM, Melnick A. BCL6 represses CHEK1 and suppresses DNA damage pathways in normal and malignant B-cells. Blood Cells Mol Dis. 2008; 41(1): 95-9; PMID:18346918; http://dx.doi.org/10.1016/j.bcmd.2008.02.003
- Lambrus BG, Uetake Y, Clutario KM, Daggubati V, Snyder M, Sluder G, Holland AJ. p53 protects against genome instability following centriole duplication failure. J Cell Biol. 2015; 210(1): 63-77; PMID:26150389; http://dx.doi.org/10.1083/jcb.201502089
- Petsalaki E, Dandoulaki M, Morrice N, Zachos G. Chk1 protects against chromatin bridges by constitutively phosphorylating BLM serine 502 to inhibit BLM degradation. J Cell Sci. 2014; 127(Pt 18): 3902-8; PMID:25015292; http://dx.doi.org/10.1242/jcs.155176
- Lawrence KS, Chau T, Engebrecht J. DNA damage response and spindle assembly checkpoint function throughout the cell cycle to ensure genomic integrity. PLoS Genet. 2015; 11(4): e1005150-; PMID:25898113; http://dx.doi.org/10.1371/journal.pgen.1005150
- Graham CH. Effect of transforming growth factor-beta on the plasminogen activator system in cultured first trimester human cytotrophoblasts. Placenta. 1997; 18(2–3): 137-43; PMID:9089774; http://dx.doi.org/10.1016/S0143-4004(97)90085-0
- Yuan J, Sanhaji M, Kramer A, Reindl W, Hofmann M, Kreis NN, Zimmer B, Berg T, Strebhardt K. Polo-box domain inhibitor poloxin activates the spindle assembly checkpoint and inhibits tumor growth in vivo. Am J Pathol. 2011; 179(4): 2091-9; PMID:21839059; http://dx.doi.org/10.1016/j.ajpath.2011.06.031
- Ritter A, Sanhaji M, Steinhauser K, Roth S, Louwen F, Yuan J. The activity regulation of the mitotic centromere-associated kinesin by Polo-like kinase 1. Oncotarget. 2015; 6(9): 6641-55; PMID:25504441; http://dx.doi.org/10.18632/oncotarget.2843
- Sanhaji M, Kreis NN, Zimmer B, Berg T, Louwen F, Yuan J. p53 is not directly relevant to the response of Polo-like kinase 1 inhibitors. Cell Cycle. 2012; 11(3): 543-53; PMID:22262171; http://dx.doi.org/10.4161/cc.11.3.19076
- Kreis NN, Sanhaji M, Kramer A, Sommer K, Rodel F, Strebhardt K, Yuan J. Restoration of the tumor suppressor p53 by downregulating cyclin B1 in human papillomavirus 16/18-infected cancer cells. Oncogene. 2010; 29(41): 5591-03; PMID:20661218; http://dx.doi.org/10.1038/onc.2010.290
- Ritter A, Friemel A, Fornoff F, Adjan M, Solbach C, Yuan J, Louwen F. Characterization of adipose-derived stem cells from subcutaneous and visceral adipose tissues and their function in breast cancer cells. Oncotarget. 2015; 6(33): 34475-93; PMID:26439686
- Ritter A, Sanhaji M, Friemel A, Roth S, Rolle U, Louwen F, Yuan J. Functional analysis of phosphorylation of the mitotic centromere-associated kinesin by Aurora B kinase in human tumor cells. Cell Cycle. 2015; 14(23):3755-67.