
ABSTRACT
Diabetes mellitus in pregnancy has been known to affect the embryonic development of various systems, including cardiovascular and nervous systems. However, whether this disease could have a negative impact on embryonic respiratory system remains controversial. In this study, we demonstrated that pregestational diabetes mellitus (PGDM)-induced defects in lung development in mice are mainly characterized by the changes in the morphological structure of the lung. Immunostaining and Western blotting showed that proliferation increased and apoptosis decreased in PGDM. Hyperglycaemia caused pulmonary tissue fibrationas manifested by an increase in Masson staining and decorin expression in PGDM lungs, and the immunofluorescent pro-SPC+ type II pulmonary epithelial cell number was decreased. The alteration of pulmonary epithelial cell differentiation might be due to hyperglycaemia-activated Wnt signalling and suppressed GATA6 expression in PGDM mouse lung tissues and MLE-12 cells. The treatment of MLE-12 cells with high glucose in the presence/absence of XAV939 or su5402 further proved that hyperglycaemia suppressed the expression of GATA6 and pro-SPC by activating Wnt signalling and induced the expression of decorin, α-SMA and TGF-β by activating Fgf signalling. Therefore, in this study, we revealed that hyperglycemia induced dysfunctional pulmonary cell apoptosis and proliferation, as well as pulmonary myofibroblast hyperplasia, which contributed to the formation of aberrant structure of alveolar walls. Furthermore, the hyperglycaemia also inhibited the differentiation of pulmonary epithelial cells through the canonical Wnt and Fgf signalling, and the alteration of Fgf and Wnt signalling activated TGF-β, which would promote the AECII EMT process.
KEYWORDS:
Introduction
Pregnant women with either PGDM or gestational diabetes mellitus (GDM) are known to have an increased risk of having a foetus with congenital birth defects such as phocomelia, cardiac malformations, macrosomia, and neural tube defects [Citation1,2]. Congenital heart disease and anomalies of the nervous system are predominant among diabetes mellitus-induced congenital malformations [Citation3], probably due to the cardiovascular and nervous systems formed in the early developmental stage, making them more vulnerable to harmful external factors. Insulin-dependent diabetes mellitus reduction of the lung volume was also reported [Citation4]. However, the exact aetiology and pathogenesis of diabetes mellitus-induced congenital development defects remain controversial, especially regarding pulmonary developmental defects. The high concentration of glucose appears to cross the maternal-foetal placental barrier. Although some evidence has demonstrated that glucose uptake via the trophoblast cells of placenta could be down-regulated due to diminished GLUT1 expression in these cells [Citation5], there is an adverse impact of hyperglycaemia on the microenvironment of embryo development, thereby harming the development of numerous systems, including the respiratory system [Citation6,7].
As one part of the respiratory system, the lung contains lower respiratory tracts and pulmonary alveoli. Lung epithelium is derived from embryonic endoderm at the gastrula stage. During embryonic development, the lungs begin to develop from an outpouching of the embryonic foregut. In mice, lung buds occur at about embryonic E9.5-E12.5 (embryonic day 9.5–12.5) and then undergo the pseudoglandular (E12.5-E16.5), canalicular (E16.5-E17.5), saccular (E18.5-postnatal day) and alveolarization (P0-P14) stages [Citation8]. In the developmental process of lung branching morphogenesis, the lung endoderm starts to differentiate into epithelial cell lineages along the proximal-distal axis. The proximal progenitor cells develop into secretory cells, mucosal cells and ciliated cells in the lung airway, while distal progenitor cells develop into type I alveolar epithelial cells (AECI) and type II alveolar epithelial cells (AECII). Alveoli are mainly composed of two types of alveolar cells and alveolar macrophages. Among them, squamous AECI cover nearly 95% of the alveolar surface and are responsible for gas exchange, while AECII secrete pulmonary surfactant that reduces alveolar surface pressure, although they only cover a very little fraction of the alveolar area surface. Moreover, the AECII can self-replicate and serve as adult stem cells to differentiate into AECI during normal homeostatic turnover and when AECI is reduced by injury [Citation9,10], although the ability of AECII as adult stem cells of AECI seems to be restricted to the adult lung [Citation11]. The alveolar macrophages are involved in immunoreaction. In addition to AECI and AECII, reticular and elastic fibres form the bulk of the connective tissue of the alveolar walls.
The molecular pathways that control lung specification, branching and patterning during lung development are deemed to include the Wnt signalling and fibroblast growth factor (Fgf) signalling pathways [Citation8]. The Fgf signalling pathway is important for the development of endoderm and the morphogenesis of the lungs, especially the genes Fgf9 and Fgf10, which block the Fgf signalling pathway [Citation12–14]. Fgf9 is also known as glial cell activator [Citation15], which is mainly involved in embryonic development [Citation12], cell proliferation [Citation16], migration [Citation17], and cell repair [Citation18]. Fgf9 prevents TGF-β1-induced differentiation of myofibroblasts, preserves undifferentiated fibroblasts, and promotes maintenance [Citation19]. Fgf10 is produced by pulmonary mesenchymal cells, expressed at the interstitial space around the branch point and inhibited by the related gene, such as Shh and BMP4 [Citation20–22]. Furthermore, Fgf10 can regulate the differentiation of endothelial cells by Ras/Sprouty [Citation23]. Additionally, Fgf10 promotes alveolar epithelial cell differentiation, migration, wound healing, and prevents DNA damage [Citation24–26]. Fgf10 may be overexpressed during inflammation and fibrosis, thereby inhibiting fibrosis [Citation27]. TGF-β1 is a recognized fibrotic cytokine [Citation28], which secreted by pulmonary epithelial cells and alveolar macrophages in lung tissue [Citation29], and it is involved in the lung tissue fibrosis process of many key links [Citation28]. Decorin is an extracellular proteoglycan (92.5 kDa) that contains the core protein (40 kDa) and a single chondroitin sulfate side chain, whereas it link with TGF-β1 in extracellular matrix, thereby inhibiting extracellular matrix (ECM) proliferation [Citation30].
Wnt signalling pathway plays an important role in early histomorphology. It has been reported that β-catenin is involved in the proliferation and differentiation of endodermal cells of various tissues and organs, including the liver, pancreas and lung [Citation31–36], which is a key factor in early lung progenitor cell formation, proliferation and differentiation [Citation33,35,37,38]. GATA Binding Protein 6 (GATA6) is a member of the zinc finger protein GATA family, whose major is expressed in large quantities in the developing endoderm and the vascular smooth muscle of the lung [Citation39]. The loss of the specific gene GATA6 during the development of the lung epithelium will lead to an increase in epithelial dysplasia and proliferation, result in inhibition of epithelial progenitor cell development [Citation40]. The possible mechanism is that GATA6 regulates the Wnt signalling to maintain the balance between proliferation and differentiation of pulmonary epithelial progenitor cells during lung development [Citation40].
In this study, we manifested that hyperglycaemia could dramatically affect the development of mouse lung in using a streptozotocin (STZ)-induced mouse diabetic model. Furthermore, we explored the possible pathological mechanism of the STZ-induced malformation of mouse lung.
Materials and methods
Experimental animals
The Kunming mice used in the current study were obtained from the Laboratory Animal Centre of Sun Yat-sen University (Guangzhou, China). Eight-week-old female mice were induced to diabetes mellitus by injecting STZ, (Sigma, MO, USA) which dissolved in pH 4.5 0.01 M citrate buffer, with a dosage of 75 mg/kg for three consecutive days. The blood glucose levels were measured 7 days after STZ injection using the Roche Accu-Chek Aviva Blood Glucose System (Roche, USA). Diabetes mellitus was defined as a non-fasting blood glucose level greater than 288 mg/dl (16 mM) [Citation41]. Control mice were maintained euglycaemic prior to and during pregnancy (4–8 mM). Two female mice were housed with one normal male mouse overnight in a cage. The day when vaginal plugs were observed was designated as embryonic day 0.5 (E0.5). Blood glucose levels were monitored every 6 days during pregnancy. At E18.5, the embryos were extracted by Caesarean section after the pregnant mice were anaesthetized by intraperitoneal injection of pentobarbital (150 mg/kg) [Citation42]. This study was conducted in rigorous accordance with the recommendations of the Guide for the Care and Use of Laboratory Animals of the National Institutes of Health. The protocol was approved by the Ethics of Animal Experiments Committee of Jinan University. All surgeries were performed under pentobarbital anaesthesia, in all efforts to minimize suffering.
Morphological analysis of the mouse lung
The mice lungs were harvested at E18.5 and dried overnight at 75°C [Citation43]. Haematoxylin and eosin (H&E), periodic acid–Schiff (PAS) and Masson staining were employed to observe histological pulmonary structures and detect glycogen or and fibrous tissue following the exposure of PGDM. The lungs were photographed and fixed in 4% paraformaldehyde (PFA), dehydrated, embedded in paraffin wax and serially sectioned at 5 µm. For histological analysis, the sections were de-waxed in xylene, rehydrated and stained with H&E or PAS, and then photographed using a fluorescence microscope (Olympus IX50) linked to NIS-Elements F3.2 software. The lungs morphometry were displayed as images and six sections per mouse were viewed using a 40 × objective, with a minimum of five mice in each group [Citation44] using Image Pro Plus software. The volume density of alveolar spaces was measured by dividing the sum of the airspace area by the total area [Citation43].
Immunohistochemistry
Immunostaining was performed on paraffin transverse sections against proliferating cell nuclear antigen (PCNA), decorin, pro-surfactant protein C (pro-SPC) and GATA6 antibodies. Briefly, transverse sections of mice lungs were de-waxed in xylene, rehydrated and then heated in a microwave for antigen retrieval before exposure to the primary antibody with citrate buffer (pH = 6.0). Next, the sections were immersed in 3% hydrogen peroxide for 10 min to block endogenous peroxidase. Nonspecific immunoreactions were blocked using 5% inactivated goat serum in PBS for 30 min at room temperature. The sections were washed in PBS and incubated with PCNA (1:500; Santa Cruz, sc-7907, CA, USA), decorin (1:100; Proteintech, 14667-1-AP, Rosemont, USA), pro-SPC (1:200; Abcam, ab90716, New Territories, HK) and GATA6 (1:300; Abcam, ab22600, New Territories, HK) antibodies overnight with shaking at 4°C. For immunohistochemistry, following extensive washing, the sections were incubated in horseradish peroxidase (HRP) goat anti-rabbit IgG secondary antibody (1:400; EarthOx, 7074S, Millbrae, USA) for 2 hours at room temperature in a dark box and were conjugated to DAB (Maixin, Fuzhou, China). After immunostaining, the sections were counterstained with haematoxylin. For immunofluorescent staining, the sections were incubated with the corresponding Alexa fluor 555 or 488 secondary antibody (1:1000; Invitrogen, Waltham, MA, USA) at room temperature for 2 hours in a dark box. All of the sections were later counterstained with DAPI (1:1000; Invitrogen, Waltham, MA, USA) at room temperature for 30 min.
TUNEL analyses
The extent of apoptosis in the lungs was established using an In Situ Cell Death Detection Kit (Roche, USA). TUNEL staining including the negative control was performed according to the manufacturer's instructions, which we adapted for tissue labelling on the glass slides. The presence of TUNEL+ cells was established using Image Analysis Software (Olympus, Japan). We evaluated the percentage of TUNEL+ cells relative to the total cells in the same area between the control and experimental groups (N = 5 lungs for each group).
Western blotting
Western blotting was performed in accordance with a standard procedure using polyclonal antibodies that specifically recognize PCNA, Ki67, p53, decorin, α-SMA, pro-SPC, Aqp5, β-catenin, E-cadherin and GATA6. Protein extraction and immunoblotting techniques used in this study were the same as we described previously. Protein from the lung tissue sections or MLE-12 cells was isolated from tissue homogenates or cell lysates using a radio-immuno-precipitation assay (RIPA, Sigma, MO, USA) buffer supplemented with protease and phosphatase inhibitors. The protein concentrations were quantified with the BCA assay. The extracted protein was separated by 10% SDS-PAGE and transferred onto a polyvinylidene difluoride (PVDF) membrane (Millipore, MA, USA). Blocked the membrane with 5% non-fat milk and then incubated with PCNA (1:1000; Santa Cruz, sc-7907, CA, USA), Ki67 (1:1000; Millipore, AB9260, MA, USA) , p53 (1:1000; Millipore, 2273812, MA, USA), decorin (1:1000; Proteintech, 14667-1-AP, Rosemont, USA) , α-SMA (1:1000; Abcam, ab66050, New Territories, HK) , pro-SPC (1:1000; Abcam, ab90716, New Territories, HK), Aqp5 (1:1000; Abcam, ab72876, New Territories, HK), β-catenin (1:1000; Abcam, ab32572, New Territories, HK), E-cadherin (1:1000; Abcam, ab76055, New Territories, HK) and GATA6 (1:1000; Abcam, ab22600, New Territories, HK) in TBS buffer at 4°C overnight. The loading control was β-actin antibody (1:3000; Proteintech, 60008-1-1g, Rosemont, USA). After incubation with the secondary antibody, either HRP goat anti-rabbit IgG (1:3000; EarthOx, 7074S, Millbrae, USA), or HRP goat anti-mouse IgG (1:3000; EarthOx, 7076S, Millbrae, USA), the blots were developed with the SuperSignalTM West Femto Chemiluminescent Substrate (ThermoFisher, Rockford, USA), Gel Doc™ XR+ System (BIO-RAD, CA, USA). The intensity of the bands was analyzed using Quantity One software (BIO-RAD, CA, USA), which was implemented according to the manufacturer's instructions. The Western blotting results were representative of three independent experiments.
RNA isolation and quantitative PCR
Total RNA was isolated from fresh mice lung tissues or MLE-12 cells which stored on ice using the E.Z.N.A® Total RNA Kit (OMEGA, Georgia, USA) according to the manufacturer's instructions. First-strand cDNA synthesis and the SYBR® Green quantitative PCR (qPCR) assay were performed using the PrimeScriptTM RT reagent kit (Takara, Japan). All of the specific primers used are described in Table [Citation45]. The reverse transcription and amplification reactions were performed in Bio-Rad S1000TM (Bio-Rad, USA), and each reaction mixture was incubated at 95 °C for a 3 min for initial denaturation step and followed by 40 PCR cycles (95 °C for 5s, 60°C for 20 s, and 72 °C for 20 s) using an ABI 7000 thermal cyclers, respectively. The corresponding relative mRNA expression was normalized to β-actin and was calculated using the 2−ΔΔCq method [Citation46]. The qPCR results were representative of three independent experiments.
Cell line
MLE-12, a mouse lung epithelial cell line, was attained from ATCC (American Type Culture Collection, CRL-2110, USA). All of the cells were passaged fewer than 6 months after resuscitation and were cultured in compliance with the protocol provided by ATCC. Sera and media were purchased from Gibco. The cells were cultured in a humidified incubator with 5% CO2 at 37°C in six-well plates ((1 × 10⁶ cells/ml) containing DMEM (Gibco, Gaithersburg, MD, USA) supplemented with 10% foetal bovine serum (Gibco, Gaithersburg, MD, USA) and were exposed to 50 mM or 5.5 mM D-glucose (Sigma, MO, USA), while 50 mM mannitol was used as a control. After a 48-hour incubation, immunofluorescent staining against GATA6 (1:300; Abcam, ab22600, New Territories, HK) was performed in the incubated MLE-12 cells. A minimum of 5 images was assayed per treatment group. The cells were photographed using an inverted fluorescence microscope (Nikon, Ti-u, Japan) linked to NIS-Elements F3.2 software. XAV939 (Cayman Chemical Company, 13596, USA) and su5402 (Sigma-Aldrich, St. Louis, MO) were added to the MLE-12 cells at a final concentration of 1 μg/mL or 30 μg/mL and were harvested after 48 hours. Next, mRNA and protein extracts were well-prepared utilizing protocols according to the manufacturer, with some modifications.
Data analysis
Data analyses and the construction of statistical charts were performed using the Graphpad Prism 5 software package (Graphpad Software, CA, USA). The results are presented as the mean value (Mean ± SD). All of the data were analysed using ANOVA or t test, which was employed to establish whether there was any difference between the control and experimental data. P<0.05 was considered to be significantly different.
Results
Hyperglycemia results in mice alveolar walls thickening and alveolar spaces reduction
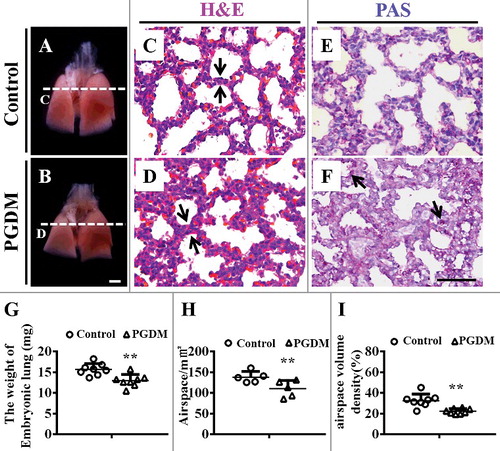
The assessment of lung development was performed with the mice lung excised at embryonic day18.5 (). Compared with the control, the PGDM group appeared a significant reduction in size () and weight of E18.5 mice lungs (Control: 15.7 ± 1.33mg, PGDM: 13.0 ± 1.41mg, P<0.01, N = 8 for each group; ). H&E () and PAS () staining were performed on the transverse sections of mice lungs at the levels indicated by arrows in A and B, respectively. Obviously, the alveolar walls of PGDM mice (, ) were much thicker than those in the control (, ), which indicated by arrows in and . Meanwhile, the areas of the alveolar air spaces in PGDM mice were less than those in control mice (Control: 138.1 ± 12.43 mm2, PGDM: 110.2 ± 17.97 mm2, P<0.05, N = 5 for each group; ), as well as the volume density of the alveolar air spaces (Control: 32.6 ± 5.97, PGDM: 22.3 ± 2.37, P<0.001, N = 8 for each group; ). Interestingly, we found much stronger PAS staining particles at the alveolar walls of PGDM mice (arrows in ), suggesting the appearance of undifferentiated alveolar epithelial cells at the alveolar walls.
Figure 1. Alteration of the airspace and histology of mouse lungs in the presence of high levels of glucose. A-B: Representative images of mouse lungs from E18.5 in the control (A) and PGDM (B) groups. C-D: The H&E-stained transverse sections of control (C) and PGDM (D) mouse lungs were taken at the levels indicated by the arrows in A-B, respectively. E-F: The PAS-stained transverse sections of control (E) and PGDM (F) mouse lungs were taken at the levels indicated by arrows in A-B, respectively. G: The point and figure chart compares mouse lung weights between the control and PGDM groups. H: The point and figure chart compares the alveolar air spaces between control and PGDM group mice. I: The point and figure chart compares the volume densities of alveolar air spaces (ratio of airspace and total volume) between control and PGDM group mice. Scale bars = 1000 μm in A-B and 50 μm in C-F. *P < 0.05, **P<0.01, ***P<0.001.
Cell proliferation and apoptosis in the lung tissue are altered by hyperglycaemia
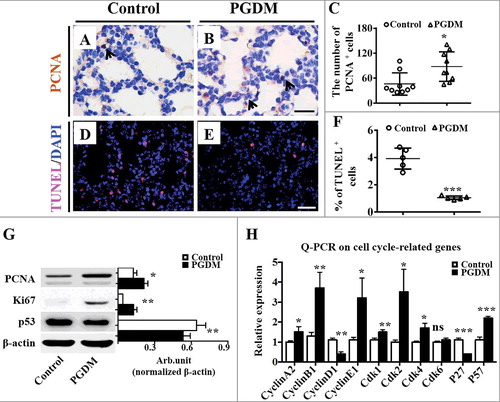
To further explore the possible mechanism underlying the thickening of alveolar walls, we assessed the cell proliferation and apoptosis of pulmonary cell by immunohistochemistry against PCNA and TUNEL on the transverse sections of mice lungs (). The results showed that more PCNA+ cell numbers in the PGDM pulmonary cell () were found than those in the control () (Control: 46.1 ± 25.12, PGDM: 87.9 ± 33.47, P<0.05, N = 9 for each group; ), implying that the cell proliferation of pulmonary cells is promoted in the presence of hyperglycaemia. Simultaneously, TUNEL+ pulmonary cells in PGDM mice at gestational age E18.5 () were significantly reduced compared with those in the control () (Control: 3.9 ± 0.6, PGDM: 1.1 ± 0.12, P<0.001, N = 5 for each group; ), indicating the apoptosis of pulmonary cells is inhibited by hyperglycaemia. Western blotting manifested that the protein levels of Ki67 in the PGDM mouse lungs were increased, and p53 expression was decreased compared with those of the control (PCNA, P<0.001; Ki67, P<0.01; p53, P<0.01. N = 3 for each group; ), also providing positive evidence for the alterations of pulmonary cell proliferation and apoptosis mentioned above. Furthermore, we detected the expression levels of cell cycle related genes in embryonic E18.5 mice lungs using qPCR. The results showed that the expression levels of CyclinA2, CyclinB1, CyclinE1, Cdk1, Cdk2, Cdk4, Cdk6 and P57 were up-regulated (CyclinA2, p<0.05; CyclinB1, p<0.01; CyclinE1, p<0.05; Cdk1, p<0.01; Cdk2, p<0.05; Cdk4, p<0.05; Cdk6, p>0.05; P57, p<0.001. N = 3 for each group; ), while that of CyclinD1 and P27 were down-regulated (CyclinD1, p<0.01; P27, p<0.001. N = 3 for each group; ), indicating that the change in the cell cycle gene expression might partially cause the alteration in the presence of hyperglycaemia.
Figure 2. Assessment of cell proliferation and apoptosis of mouse lungs in the presence of high levels of glucose. A-B: PCNA immunohistochemistry was performed on the transverse sections of embryonic (E18.5) mouse lungs from the control (A) and PGDM (B) groups. All of the sections were counterstained with haematoxylin. C: The point and figure chart compares the PCNA+ cell numbers of mouse lung sections between the control and PGDM groups. D-E: TUNEL immunohistochemistry was performed on the transverse sections of embryonic (E18.5) mouse lungs from the control (D) and PGDM (E) groups. All of the sections were counterstained with haematoxylin. F: The point and figure chart compares the percentage of TUNEL+ cell of mouse lung sections between the control and PGDM groups. G: The Western blotting data show the protein expressions of PCNA, Ki67 and p53 from the lung tissues of control and PGDM mice at E18.5 embryonic days. F: The qPCR data shows the expression levels of cyclinA2, cyclinB1, cyclinD1, cyclinE1, cdk1, cdk2, cdk4, cdk6, p27 and p57 in E18.5 mouse lung tissues from the control and PGDM groups. Scale bars = 20 μm in A-B and 25 μm in D-E. *P < 0.05, **P<0.01, ***P<0.001.
Exposure to hyperglycaemia promotes pulmonary fibrosis in developing mice
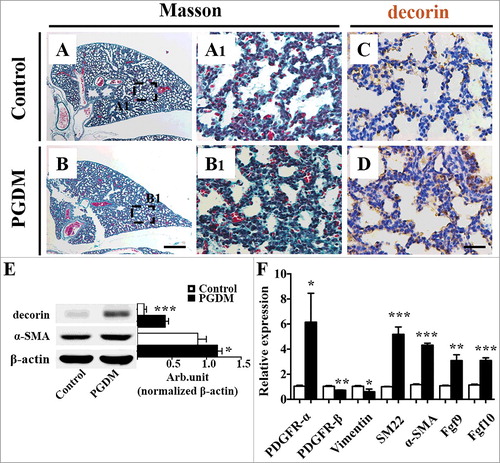
One possibility for the hyperglycaemia-induced thickened of pulmonary septal wall might be due to an increased number of interstitial tissue cells. Masson staining was performed on the transverse sections of mice lungs to comprehend whether there were significant changes in interstitial fibrous tissue (). The results showed that the alveolar walls of PGDM mice were thicker than the control (). α-SMA expression was correlated with the activation of myofibroblasts, while decorin could influence the expression of α-SMA in a human myofibroblast cell line via the cell cycle (41). Here, both immunohistochemical () and Western blot data (decorin, P<0.001; α-SMA, P = 0.001. N = 3 for each group; ) manifested that the expression of decorin in PGDM mice alveoli was up-regulated, as was the expression of α-SMA (). To further explore the contributing factor to pulmonary fibrosis, we determined the expression of other fibrosis-relevant genes using qPCR and found that the expression levels of PDGFR-α, SM22, SMA, FGF9 and FGF10 were elevated in PGDM mice lungs, while that of PDGFR-β and Vimentin were descended in PGDM mouse lungs (PDGFR-α, p<0.05; PDGFR-β, p<0.01; Vimentin, p<0.05; SM22, p<0.001; α-SMA, p<0.001; Fgf9, p<0.01; Fgf10, p<0.001. N = 3 for each group; ). Given the above, adequately suggested that PGDM indeed leads to pulmonary fibrosis in the developing mice lungs to some extent.
Figure 3. Assessment of mouse pulmonary fibrous tissue proliferation in the presence of high levels of glucose. A-B: Masson staining was performed on the transverse sections of embryonic (E18.5) mouse lungs from the control (A) and PGDM (B) groups. A1-B1: The high-magnification images were taken from the sites indicated by dotted squares in A-B, respectively. C-D: Decorin immunohistochemistry was performed on the transverse sections of embryonic (E18.5) mouse lungs from the control (C) and PGDM (D) groups. All of the sections were counterstained with haematoxylin. E: The Western blotting data show the protein expression levels of decorin and α-SMA from the lung tissues of control and PGDM mice at E18.5 embryonic days. F: The qPCR data show the expression levels of PDGFR-α, PDGFR-β, vimentin, SM22, α-SMA, FGF9 and FGF10 in E18.5 mouse lung tissues from the control and PGDM groups. Scale bars = 300 μm in A-B and 30 µm in A1-B1, C-D. *P < 0.05, **P<0.01, ***P<0.001.
Exposure to hyperglycaemia restricts the differentiation of pulmonary epithelial cells in developing mice
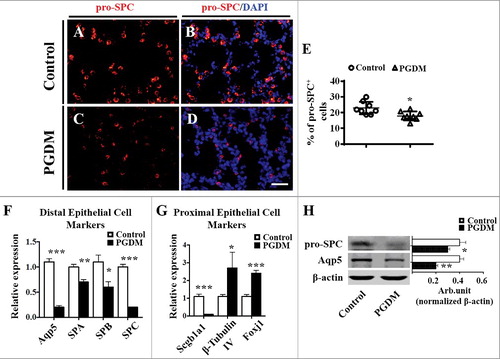
Another possibility of the augment in the pulmonary septal wall thickness in PGDM might be implicated with the barrier of pulmonary epithelial cell differentiation (36). Immunofluorescent staining of pro-SPC (type II pulmonary epithelial cell marker) showed that pro-SPC+ cell numbers in PGDM mouse lung tissue were apparently declined (Control: 22.9 ± 3.77, PGDM: 17.9 ± 2.71, P<0.05. N = 8 for each group; ). The qPCR was performed to review whether the reduction of pro-SPC+ cells was due to the alteration of distal and proximal epithelial cell gene expressions (63). The results showed that the expression levels of all of the distal epithelial cell genes, including Aqp5, SPA, SPB and SPC, were down-regulated (Aqp5, p<0.001; SPA, p<0.01; SPB, p<0.05; SPC, p<0.001. N = 3 for each group; ). Additionally, in PGDM mice lungs proximal epithelial cell genes, Scgbla1 expression was down-regulated while β-tubulin IV and Foxj1 were up-regulated (Scgb1a1, p<0.001; β-TubulinIV, p<0.05; Foxj1, p<0.001. N = 3 for each group; ). Western blot data further confirmed that pro-SPC and Aqp5 expression at the protein level was down-regulated (pro-SPC, P<0.05; Aqp5, P = 0.001. N = 3 for each group; ). All the data indicated above strongly implicated that hyperglycaemia restricted the progenitor cells differentiate into type I and II pulmonary epithelial cells in developing mice.
Figure 4. Expression of mouse pulmonary alveolar stem cells in the presence of high levels of glucose. A-D: pro-SPC immunofluorescent staining was performed on the transverse sections of embryonic (E18.5) mouse lungs from the control (A-B) and PGDM groups (C-D). E: The point and figure chart compares the percentages of pro-SPC+ cell numbers of mouse lung sections between the control and PGDM groups. F: The qPCR data show the expression levels of distal epithelial cell markers, including Aqp5, SPA, SPB and SPC, in E18.5 mouse lung tissues from the control and PGDM groups. G: The qPCR data show the expression levels of proximal epithelial cell markers, including Scgbla1, β-tubulin IV and Foxj1, in E18.5 mouse lung tissues from the control and PGDM groups. H: The Western blotting data show the protein expression levels of pro-SPC and Aqp5 from the lung tissues of control and PGDM mice at E18.5 embryonic days. Scale bars = 25 mm in A-B, *P < 0.05, **P<0.01, ***P<0.001.
Repressed GATA6 and activated Wnt signalling contribute to the abnormal differentiation of pulmonary epithelial cells
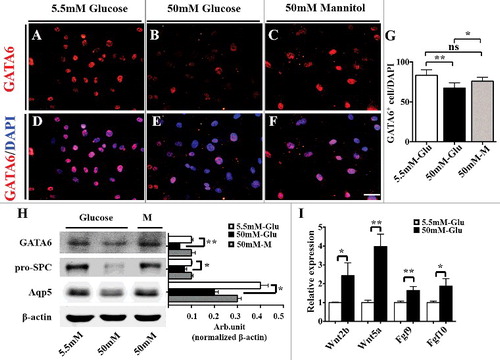
GATA6 plays a crucial role in regulating pulmonary epithelial differentiation in lung development via Wnt signalling [Citation40]. Western blot data manifested that β-catenin expression was up-regulated, and E-cadherin expression was down-regulated in PGDM mice lungs (β-catenin, P<0.05; E-cadherin, P<0.01. N = 3 for each group; ). In addition, the qPCR data showed that the expression of all Wnt signalling molecules, including Wnt2, Wnt2b, Wnt5a, Wnt7a, Wnt7b, Wnt11 and Axin2, was increased compared with that of the control (Wnt2, p<0.001; Wnt2b, p<0.001; Wnt5a, p<0.05; Wnt7a, p<0.05; Wnt7b, p<0.05; Wnt11, p<0.05; Axin2, p<0.01. N = 3 for each group; ). Meanwhile, Western blotting showed that GATA6 expression was down-regulated at both the protein (GATA6, P<0.05. N = 3 for each group; ) and mRNA levels (GATA6, p<0.01. N = 3 for each group; ) as revealed by qPCR. Moverover, MLE-12, the mouse lung epithelial type II cell line [Citation47], was employed to detect the response of GATA6 expression in the presence of high glucose (50 mM glucose) (). GATA6 immunofluorescent staining showed that GDTA6+ MLE-12 cell numbers were significantly reduced in high glucose (50 mM) compared with that in the control (5.5 mM glucose) and osmotic control (50 mM mannitol) [Control (5.5mM glucose): 83.2 ± 6.28, 50mM glucose: 67.3 ± 5.84, 50mM Mannitol: 75.9 ± 4.45; 5.5 mM &50 mM, P<0.001; 5.5 mM & 50mM Mannitol, P>0.05; 50 mM & 50mM Mannitol, P<0.05; N = 3 for each group; ]. Similarly, GATA6 expression at the protein level as revealed by Western blot was decreased in the presence of high glucose (50 mM glucose) compared with that in the control (5.5 mM glucose) and osmotic control (50 mM mannitol) [GATA6: 5.5 mM &50 mM, P<0.001; 5.5 mM & 50mM Mannitol, P>0.05; 50 mM & 50mM Mannitol, P>0.05; pro-SPC: 5.5 mM &50 mM, P<0.05; 5.5 mM & 50mM Mannitol, P>0.05; 50 mM & 50mM Mannitol, P<0.05; Aqp5: 5.5 mM &50 mM, P<0.001; 5.5 mM & 50mM Mannitol, P>0.05; 50 mM & 50mM Mannitol, P<0.05. N = 3 for each group; ]. Meanwhile, pro-SPC and Aqp5 expression at the protein level showed the same tendency as that of GATA6. Furthermore, qPCR manifested that the expression levels of Wnt2b, Wnt5a, Fgf9, Fgf10 were increased at the mRNA level [Wnt2b, P<0.05; Wnt5a, P<0.01; Fgf9, P<0.01; Fgf10, P<0.05. N = 3 for each group; ]. The experimental results demonstarted that hyperglycaemia indeed caused the activation of Wnt or Fgf signalling and the suppression of GATA6 expression, thus restricting the differentiation of pulmonary epithelial cells.
Figure 5. Expression of Wnt signalling molecules in the presence of high levels of glucose. A: The Western blotting data show the protein expression levels of β-catenin and E-cadherin from the lung tissues of control and PGDM mice at E18.5 embryonic days. B: The qPCR data show the expression levels of Wnt2, Wnt2a, Wnt5a, Wnt7a, Wnt7b, Wnt11 and Axin2 in E18.5 mouse lung tissues from the control and PGDM groups. C: The Western blotting data show the protein expression of GATA6 from the lung tissues of control and PGDM mice at E18.5 embryonic days. D: The qPCR data show the expression of GATA6 in E18.5 mouse lung tissues from the control and PGDM groups. *P < 0.05, **P<0.01, ***P<0.001.
Figure 6. Expression levels of GATA6 and AECI/AECII markers in MLE-12 cells following treatment with high glucose. A-C: pro-SPC immunofluorescent staining was performed on the cultured MLE-12 cells with 5.5 mM glucose (A, control), 50 mM glucose (B, high glucose) and 50 mM Mannitol (C, osmotic pressure control) for 48 hours. D-E: The merged images of DAPI staining+ in A-C, respectively. G: The point and figure chart compares the percentages of GATA6+ cell numbers between the control and high-glucose groups. H: The Western blotting data show the protein expression of GATA6, pro-SPC and Aqp5 in MLE-12 cells of the control and high-glucose groups. I: The qPCR data show the m-RNA level of Wnt2b, Wnt5a, Fgf9 and Fgf10 in MLE-12 cells of the control and high-glucose groups. Scale bars = 25 μm in A-F. *P < 0.05, **P<0.01, ***P<0.001.
The co-ordinate regulatory role of FGF and Wnt signalling in the differentiation of pulmonary epithelial cells in MEL-12 cells
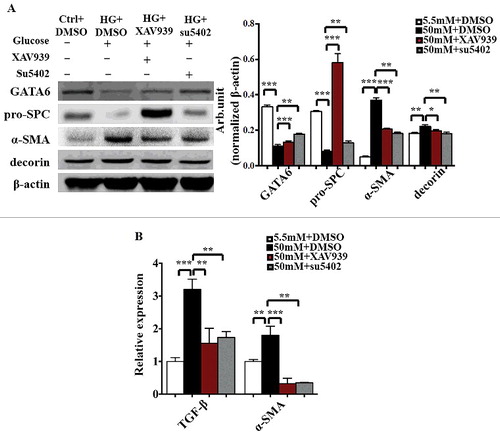
To further investigate the role of FGF and Wnt signalling in the differentiation of pulmonary epithelial cells, we assessed the differentiation of MEL-12 cells using corresponding markers in the presence/absence of high glucose with/without a Wnt signalling inhibitor (XAV939) or FGF signalling inhibitor (su5402). Western blotting showed the expression of GATA6, pro-SPC, α-SMA and decorin at the protein level (). GATA6 and pro-SPC protein levels were increased in the presence of high glucose with an addition of XAV939 or su5402. Meanwhile, α-SMA and decorin protein levels showed an opposite tendency [GATA6: Control & 50mM glucose+DMSO, P<0.001; 50mM glucose+DMSO & 50mM glucose+XAV939, P<0.001; 50mM glucose+DMSO & 50mM glucose+su5402, P<0.01; pro-SPC: Control & 50mM glucose+DMSO, P<0.001; 50mM glucose+DMSO & 50mM glucose+XAV939, P<0.001; 50mM glucose+DMSO & 50mM glucose+su5402, P<0.01; α-SMA: Control & 50mM glucose+DMSO, P<0.001; 50mM glucose+DMSO & 50mM glucose+XAV939, P<0.001; 50mM glucose+DMSO & 50mM glucose+su5402, P<0.01; decorin: Control & 50mM glucose+DMSO, P<0.01; 50mM glucose+DMSO & 50mM glucose+XAV939, P<0.01; 50mM glucose+DMSO & 50mM glucose+su5402, P<0.05. N = 3 for each group; ]. Moreover, qPCR was used to analyse the mRNA levels of TGF-β and α-SMA (). The TGF-β and α-SMA protein levels were elevated in the present of high glucose while descended with an adjunction of XAV939 or su5402 (TGF-β: Control & 50mM glucose+DMSO, P<0.001; 50mM glucose+DMSO & 50mM glucose+XAV939, P<0.01; 50mM glucose+DMSO & 50mM glucose+su5402, P<0.01; α-SMA: Control & 50mM glucose+DMSO, P<0.01; 50mM glucose+DMSO & 50mM glucose+XAV939, P<0.001; 50mM glucose+DMSO & 50mM glucose+su5402, P<0.01. N = 3 for each group; ). The above data manifested that hyperglycaemia contributed to the expression of GATA6, pro-SPC, α-SMA, decorin and TGF-β by activating Wnt signalling and Fgf signalling.
Figure 7. The expression levels of GATA6 and AECI/AECII markers in MLE-12 cells following the blockade of either FGF or Wnt signalling. A: The Western blotting data show the protein expression of GATA6, pro-SPC, α-SMA, decorin and β-actin in MLE-12 cells of the control and high-glucose groups in the presence/absence of XAV939 or su5402. B: QPCR data show the mRNA expression of TGF-β and α-SMA in MLE-12 cells of the control and high-glucose groups in the presence/absence of XAV939 or su5402. *P < 0.05, **P<0.01, ***P<0.001.
Discussion
Popov et al. demonstrated the collapse of alveolar epithelium within the airspace and apparent enlargement of the interstitium in STZ-induced DGM hamsters [Citation48], findings that are generally similar to our observation of the thickened alveolar walls in PGDM mice lungs (). Additionally, in this study, we noted that the alveolar airspace and embryo weight were decreased (). There is a variety of reasons leads to alteration in size of alveolar walls in PGDM mice, such as the interference of cell proliferation and apoptosis, interstitial fibrosis or disorder of pulmonary epithelial cell differentiation [Citation49]. As we know, bronchopulmonary dysplasia might result from pulmonary immaturity at birth or clinically caused by improper oxygen therapy, additionally, it also occurs with interstitial fibrosis in lungs.
Cell proliferation and apoptosis play different roles in all stages of lung development [Citation50], and PCNA-labelled pulmonary cell proliferation and apoptosis were appraised using the TUNEL kit (). The results explicitly indicated that hyperglycaemia increased pulmonary cell proliferation and decreased the apoptosis (), which is also supported by the enhancement of Ki67 and p53 in PGDM mice lungs as well as most of the cell cycle-related gene expression (). Notably, this effect may also due to the aberrations of cell apoptosis and proliferation in interstitial tissue and (or) lung epithelial cells. Furthermore, it is found that exposure to hyperglycaemia could promote pulmonary fibrosis () and restricte AECI and AECII in developing mice (). All of these results above indicate that the hyperglycaemia only increased the survival of cells in interstitial tissue.
High glucose exposure could cause excessive ROS production, which results in a large number of cell damage or apoptosis in embryos and foetuses [Citation51–53]. A large number of cell apoptosis also lead to the differentiation of stem cells, and AECII could be considered as adult stem cells since it will differentiate into AECI when needed [Citation9,10]. In the presence of chronic and persistent inflammation, AECII would proliferate and differentiate into AECI in lung, which results in over-proliferation of AECI and a variety of fibrotic-associated cytokines. Meanwhile, fibroblasts transdifferentiation of myofibroblasts is also quietly proceeding, and these ultimately further promote the occurrence and development of lung fibrosis [Citation54]. It has also been reported that the EMT process of lung epithelial cells will promote fibrosis, because mesenchymal cells will eventually differentiate into fibrous connective tissue, leading to interstitial heavy fibrous tissue deposition [Citation55]. In this study, substantial evidences indicated that hyperglycaemia leads to interstitial fibrosis in lung, which the mechanism was suggested as the activation of lung tissue EMT process. Decorin is a negative-feedback regulator of TGF-β1 by binding and neutralizing TGF-β1 activity, so that the TGF-β-stimulated synthesis of extracellular matrix could be restricted once decorin is activated [Citation56]. This might explain the high level of decorin in PGDM mouse lung tissues (). Profibrotic mediators, including PDGFR, Fgf and TGF-β, are known to associated with fibroplasia and extracellular matrix deposition [Citation57,58], which is a finding similar to our observation in this study (). Furthermore, pulmonary epithelial-mesenchymal transition (EMT) may enhance fibrosis by increasing the accumulation of fibroblasts in the interstitial spaces of lungs [Citation55]. Moreover, the up-regulated expressions of α-SMA and SM22 in PGDM mice lungs () confirmed the activation of EMT in the presence of hyperglycaemia. Therefore, it is suggested that high glucose level might affect the differentiation of undifferentiated lung epithelial cells into AECII and mature lung epithelial cells, and that may promote the AECII EMT process. Hence, we speculated that abnormal lung tissue proliferation was more likely derived from the alteration in pulmonary fibrous tissue rather than pulmonary epithelial cells.
Besides, we explored which signalling pathways involved in the obstacle of AECI and AECII from pulmonary progenitors in the presence of high glucose level. Zhang et al. reported that GATA6 and Wnt signalling co-ordinately regulated the expansion of stem/progenitor cells and epithelial cell differentiation during lung development and regeneration [Citation40]. Likewise, we also found the activation of Wnt signalling, including the increase of β-catenin, Wnt2, Wnt2b, Wnt5a, Wnt7a, Wnt7b, Wnt11, Axin2 expression and decrease of E-cadherin expression, while GATA6 expression was suppressed in PGDM mice lungs (). Moreover, the simultaneous reduction of GATA6 in PGDM mice lungs () further implied that the balance between the expansion of stem/progenitor cells and epithelial cell differentiation, which is regulated by GATA6-Wnt signalling, is out of order in presence of hyperglycaemia. Our in vitro MLE-12 cell experiments consolidated the above hypothesis because GATA6, pro-SPC and Aqp5 expression levels in MLE-12 cells were simultaneously inhibited by the high concentration of glucose (). Meanwhile, the ratio of GATA6 and pro-SPC protein levels in MLE-12 cells treated with high glucose plus XAV939 or su5402 was higher than that of the high glucose group without any addition. The results above indicated that the canonical Wnt signalling and Fgf signalling are involved in the obstacle of AECII cells from pulmonary progenitors in presence of high glucose. Interestingly, the expression of α-SMA and decorin were increased in MLE-12 cells treated with high glucose, while decreased after adding XAV939 or su5402 (). Given the above, it is suggested that glucose may promote the EMT process of AECII, while the canonical Wnt signalling and Fgf signalling are involved. A well-known fibrotic cytokine TGF-β signalling may possibly be responsible for the regulation of EMT process (().
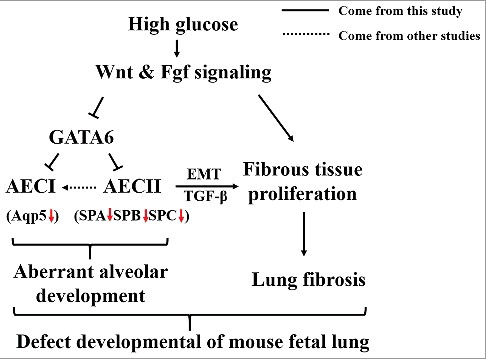
In conclusion, the hyperglycaemia-induced thickening of mice alveolar walls could have the following reasons (). Firstly, hyperglycaemia inhibited pulmonary cell apoptosis and increased pulmonary cell proliferation, especially elevated the survival of the interstitial cells in lung tissue. Secondly, the intrauterine hyperglycaemia inhibited the pulmonary epithelial cells differentiation through the alteration of canonical Wnt signalling and Fgf signalling. Thirdly, the variation of Fgf and Wnt signalling activated TGF-β signalling, which promoted the EMT process of AECII. All of the dysfunctional gene expressions described above lead to an aberrant mouse alveolar development and pulmonary fibrosis in the developing mice, despite the precise molecular biological mechanism still have to be further explored in the future.
Figure 8. A proposed model that depicts the potential mechanisms for hyperglycaemia- induced defects in alveolar development.
Competing interests
The authors declare no competing financial interests.
2017CC7704R-s03.pdf
Download PDF (63.5 KB)2017CC7704R-s02.pdf
Download PDF (58.7 KB)Additional information
Funding
Related Research Data
References
- Ejdesjo A, Wentzel P, Eriksson UJ. Influence of maternal metabolism and parental genetics on fetal maldevelopment in diabetic rat pregnancy. Am J Physiol Endocrinol Metabolism. 2012;302:E1198–E1209. doi:10.1152/ajpendo.00661.2011. PMID:22374754
- Gheorman L, Iliescu D, Ceausu I, et al. Importance of early complex evaluation in high-risk pregnancy associated to diabetes mellitus. Case presentation and review of the literature. Rom J Morphol Embryol. 2011;52:1127–1132. PMID:22119836
- Macintosh MC, Fleming KM, Bailey JA, et al. Perinatal mortality and congenital anomalies in babies of women with type 1 or type 2 diabetes in England, Wales, and Northern Ireland: population based study. Bmj. 2006;333:177. doi:10.1136/bmj.38856.692986.AE. PMID:16782722
- Bell D, Collier A, Matthews DM, et al. Are reduced lung volumes in IDDM due to defect in connective tissue? Diabetes. 1988;37:829–831. doi:10.2337/diab.37.6.829. PMID:3384183
- Hahn T, Barth S, Weiss U, et al. Sustained hyperglycemia in vitro down-regulates the GLUT1 glucose transport system of cultured human term placental trophoblast: a mechanism to protect fetal development? FASEB J Official Pub Federation Am Soc Exp Biol. 1998;12:1221–1231. PMID:9737725
- Baack ML, Forred BJ, Larsen TD, et al. Consequences of a maternal high-fat diet and late gestation diabetes on the developing Rat Lung. PLoS One. 2016;11:e0160818. doi:10.1371/journal.pone.0160818. PMID:27518105
- Mayor RS, Finch KE, Zehr J, et al. Maternal high-fat diet is associated with impaired fetal lung development. Am J Physiol Lung Cell Mol Physiol. 2015;309:L360–L368. doi:10.1152/ajplung.00105.2015. PMID:26092997
- Herriges M, Morrisey EE. Lung development: orchestrating the generation and regeneration of a complex organ. Development. 2014;141:502–513. doi:10.1242/dev.098186. PMID:24449833
- Evans MJ, Cabral LJ, Stephens RJ, et al. Renewal of alveolar epithelium in the rat following exposure to NO2. Am J Pathol. 1973;70:175–198. PMID:4566990
- Barkauskas CE, Cronce MJ, Rackley CR, et al. Type 2 alveolar cells are stem cells in adult lung. J Clin Invest. 2013;123:3025–3036. doi:10.1172/JCI68782. PMID:23921127
- Yee M, Gelein R, Mariani TJ, et al. The Oxygen environment at birth specifies the population of alveolar epithelial stem cells in the Adult Lung. Stem Cells. 2016;34:1396–1406. doi:10.1002/stem.2330. PMID:26891117
- Yin Y, Wang F, Ornitz DM. Mesothelial- and epithelial-derived FGF9 have distinct functions in the regulation of lung development. Development. 2011;138:3169–3177. doi:10.1242/dev.065110. PMID:21750028
- Sekine K, Ohuchi H, Fujiwara M, et al. Fgf10 is essential for limb and lung formation. Nat Genet. 1999;21:138–141. doi:10.1038/5096. PMID:9916808
- Ohuchi H, Hori Y, Yamasaki M, et al. FGF10 acts as a major ligand for FGF receptor 2 IIIb in mouse multi-organ development. Biochem Biophys Res Commun. 2000;277:643–649. doi:10.1006/bbrc.2000.3721. PMID:11062007
- Miyamoto M, Naruo K, Seko C, et al. Molecular cloning of a novel cytokine cDNA encoding the ninth member of the fibroblast growth factor family, which has a unique secretion property. Mol Cell Biol. 1993;13:4251–4259. doi:10.1128/MCB.13.7.4251. PMID:8321227
- Fakhry A, Ratisoontorn C, Vedhachalam C, et al. Effects of FGF-2/-9 in calvarial bone cell cultures: differentiation stage-dependent mitogenic effect, inverse regulation of BMP-2 and noggin, and enhancement of osteogenic potential. Bone. 2005;36:254–266. doi:10.1016/j.bone.2004.10.003. PMID:15780951
- Yu B, Qian T, Wang Y, et al. miR-182 inhibits Schwann cell proliferation and migration by targeting FGF9 and NTM, respectively at an early stage following sciatic nerve injury. Nucleic Acids Res. 2012;40:10356–10365. doi:10.1093/nar/gks750. PMID:22917588
- Behr B, Leucht P, Longaker MT, et al. Fgf-9 is required for angiogenesis and osteogenesis in long bone repair. Proc Natl Acad Sci U S A. 2010;107:11853–11858. doi:10.1073/pnas.1003317107. PMID:20547837
- Joannes A, Brayer S, Besnard V, et al. FGF9 and FGF18 in idiopathic pulmonary fibrosis promote survival and migration and inhibit myofibroblast differentiation of human lung fibroblasts in vitro. Am J Physiol Lung Cell Mol Physiol. 2016;310:L615–L629. doi:10.1152/ajplung.00185.2015. PMID:26773067
- Bellusci S, Furuta Y, Rush MG, et al. Involvement of Sonic hedgehog (Shh) in mouse embryonic lung growth and morphogenesis. Development. 1997;124:53–63. PMID:9006067
- Pepicelli CV, Lewis PM, McMahon AP. Sonic hedgehog regulates branching morphogenesis in the mammalian lung. Curr Biol. 1998;8:1083–1086. doi:10.1016/S0960-9822(98)70446-4. PMID:9768363
- Weaver M, Dunn NR, Hogan BL. Bmp4 and Fgf10 play opposing roles during lung bud morphogenesis. Development. 2000;127:2695–2704. PMID:10821767
- Tang M, Xu W, Wang Q, et al. Potential of DNMT and its Epigenetic Regulation for Lung Cancer Therapy. Curr Genomics. 2009;10:336–352. doi:10.2174/138920209788920994. PMID:20119531
- Igarashi M, Finch PW, Aaronson SA. Characterization of recombinant human fibroblast growth factor (FGF)-10 reveals functional similarities with keratinocyte growth factor (FGF-7). J Biol Chem. 1998;273:13230–13235. doi:10.1074/jbc.273.21.13230. PMID:9582367
- Jimenez PA, Rampy MA. Keratinocyte growth factor-2 accelerates wound healing in incisional wounds. J Surg Res. 1999;81:238–242. doi:10.1006/jsre.1998.5501. PMID:9927546
- Upadhyay D, Correa-Meyer E, Sznajder JI, et al. FGF-10 prevents mechanical stretch-induced alveolar epithelial cell DNA damage via MAPK activation. Am J Physiol Lung Cell Mol Physiol. 2003;284:L350–L359. doi:10.1152/ajplung.00161.2002. PMID:12533312
- Gupte VV, Ramasamy SK, Reddy R, et al. Overexpression of fibroblast growth factor-10 during both inflammatory and fibrotic phases attenuates bleomycin-induced pulmonary fibrosis in mice. Am J Respir Crit Care Med. 2009;180:424–436. doi:10.1164/rccm.200811-1794OC. PMID:19498056
- Yang J, Velikoff M, Canalis E, et al. Activated alveolar epithelial cells initiate fibrosis through autocrine and paracrine secretion of connective tissue growth factor. Am J Phys-Lung Cellular Mol Physiol. 2014;306:L786–L796. doi:10.1152/ajplung.00243.2013. PMID:24508728
- Lee TC, Gold LI, Reibman J, et al. Immunohistochemical localization of transforming growth factor-â and insulin-like growth factor-I in asbestosis in the sheep model. Int Arch Occup Environ Health. 1997;69:157–164. doi:10.1007/s004200050132. PMID:9049666
- Border WA, Noble NA, Yamamoto T, et al. Natural inhibitor of transforming growth factor-beta protects against scarring in experimental kidney disease. Nature. 1992;360:361–364. doi:10.1038/360361a0. PMID:1280332
- Dessimoz J, Bonnard C, Huelsken J, et al. Pancreas-specific deletion of beta-catenin reveals Wnt-dependent and Wnt-independent functions during development. Curr Biol. 2005;15:1677–1683. doi:10.1016/j.cub.2005.08.037. PMID:16169491
- Apte U, Zeng G, Thompson MD, et al. Beta-Catenin is critical for early postnatal liver growth. Am J Physiol Gastrointest Liver Physiol. 2007;292:G1578–G1585. doi:10.1152/ajpgi.00359.2006. PMID:17332475
- Mucenski ML, Wert SE, Nation JM, et al. Beta-Catenin is required for specification of proximal/distal cell fate during lung morphogenesis. J Biol Chem. 2003;278:40231–40238. doi:10.1074/jbc.M305892200. PMID:12885771
- Murtaugh LC, Law AC, Dor Y, et al. Beta-catenin is essential for pancreatic acinar but not islet development. Development. 2005;132:4663–4674. doi:10.1242/dev.02063. PMID:16192304
- Shu W, Guttentag S, Wang Z, et al. Wnt/beta-catenin signaling acts upstream of N-myc, BMP4, and FGF signaling to regulate proximal-distal patterning in the lung. Dev Biol. 2005;283:226–239. doi:10.1016/j.ydbio.2005.04.014. PMID:15907834
- Tan X, Behari J, Cieply B, et al. Conditional deletion of beta-catenin reveals its role in liver growth and regeneration. Gastroenterology. 2006;131:1561–1572. doi:10.1053/j.gastro.2006.08.042. PMID:17101329
- Goss AM, Tian Y, Tsukiyama T, et al. Wnt2/2b and beta-catenin signaling are necessary and sufficient to specify lung progenitors in the foregut. Dev Cell. 2009;17:290–298. doi:10.1016/j.devcel.2009.06.005. PMID:19686689
- Harris-Johnson KS, Domyan ET, Vezina CM, et al. beta-Catenin promotes respiratory progenitor identity in mouse foregut. Proc Natl Acad Sci U S A. 2009;106:16287–16292. doi:10.1073/pnas.0902274106. PMID:19805295
- Morrisey EE, Ip HS, Lu MM, et al. GATA-6: a zinc finger transcription factor that is expressed in multiple cell lineages derived from lateral mesoderm. Dev Biol. 1996;177:309–322. doi:10.1006/dbio.1996.0165. PMID:8660897
- Zhang Y, Goss AM, Cohen ED, et al. A Gata6-Wnt pathway required for epithelial stem cell development and airway regeneration. Nat Genet. 2008;40:862–870. doi:10.1038/ng.157. PMID:18536717
- Kumar SD, Dheen ST, Tay SS. Maternal diabetes induces congenital heart defects in mice by altering the expression of genes involved in cardiovascular development. Cardiovasc Diabetol. 2007;6:34. doi:10.1186/1475-2840-6-34. PMID:17967198
- Han SS, Wang G, Jin Y, et al. Investigating the Mechanism of Hyperglycemia-Induced Fetal Cardiac Hypertrophy. PLoS One. 2015;10:e0139141. doi:10.1371/journal.pone.0139141. PMID:26418041
- Plosa EJ, Young LR, Gulleman PM, et al. Epithelial beta1 integrin is required for lung branching morphogenesis and alveolarization. Development. 2014;141:4751–4762. doi:10.1242/dev.117200. PMID:25395457
- Kauffman SL. Acceleration of canalicular development in lungs of fetal mice exposed transplacentally to dexamethasone. Lab Invest. 1977;36:395–401. PMID:66416
- Wang X, Wang Y, Snitow ME, et al. Expression of histone deacetylase 3 instructs alveolar type I cell differentiation by regulating a Wnt signaling niche in the lung. Dev Biol. 2016;414:161–169. doi:10.1016/j.ydbio.2016.04.023. PMID:27141870
- Schmittgen TD, Livak KJ. Analyzing real-time PCR data by the comparative C(T) method. Nat Protoc. 2008;3:1101–1108. doi:10.1038/nprot.2008.73. PMID:18546601
- Bai R, Guan L, Zhang W, et al. Comparative study of the effects of PM1-induced oxidative stress on autophagy and surfactant protein B and C expressions in lung alveolar type II epithelial MLE-12 cells. Biochim Biophys Acta. 2016;1860:2782–2792. doi:10.1016/j.bbagen.2016.05.020. PMID:27208422
- Popov D, Simionescu M. Alterations of lung structure in experimental diabetes, and diabetes associated with hyperlipidaemia in hamsters. Eur Respir J. 1997;10:1850–1858. doi:10.1183/09031936.97.10081850. PMID:9272930
- Yoon DH, Lim MH, Lee YR, et al. A novel synthetic analog of Militarin, MA-1 induces mitochondrial dependent apoptosis by ROS generation in human lung cancer cells. Toxicol Appl Pharmacol. 2013;273:659–671. doi:10.1016/j.taap.2013.10.015. PMID:24161344
- Del Riccio V, van Tuyl M, Post M. Apoptosis in lung development and neonatal lung injury. Pediatr Res. 2004;55:183–189. doi:10.1203/01.PDR.0000103930.93849.B2. PMID:14630991
- Eriksson UJ, Borg LA. Diabetes and embryonic malformations. Role of substrate-induced free-oxygen radical production for dysmorphogenesis in cultured rat embryos. Diabetes. 1993;42:411–419. doi:10.2337/diab.42.3.411. PMID:8432412
- Eriksson UJ, Cederberg J, Wentzel P. Congenital malformations in offspring of diabetic mothers–animal and human studies. Rev Endocr Metab Disord. 2003;4:79–93. doi:10.1023/A:1021879504372. PMID:12618562
- Zangen SW, Yaffe P, Shechtman S, et al. The role of reactive oxygen species in diabetes-induced anomalies in embryos of Cohen diabetic rats. Int J Exp Diabetes Res. 2002;3:247–255. doi:10.1080/15604280214933. PMID:12546278
- Kim KK, Kugler MC, Wolters PJ, et al. Alveolar epithelial cell mesenchymal transition develops in vivo during pulmonary fibrosis and is regulated by the extracellular matrix. Proc Nat Acad Sci. 2006;103:13180–13185. doi:10.1073/pnas.0605669103.
- Borchers AT, Chang C, Keen CL, et al. Idiopathic pulmonary fibrosis-an epidemiological and pathological review. Clin Rev Allergy Immunol. 2011;40:117–134. doi:10.1007/s12016-010-8211-5.
- Asakura S, Kato H, Fujino S, et al. Role of transforming growth factor-beta1 and decorin in development of central fibrosis in pulmonary adenocarcinoma. Hum Pathol. 1999;30:195–198. doi:10.1016/S0046-8177(99)90275-7. PMID:10029448
- Yoshida M, Hayashi S. Role of TGF-beta and PDGF on the pathogenesis of pulmonary fibrosis–analysis by in vivo gene transfer. Nihon Rinsho Japanese J Clin Med. 1996;54:418–422. PMID:8838090
- Wollin L, Wex E, Pautsch A, et al. Mode of action of nintedanib in the treatment of idiopathic pulmonary fibrosis. Eur Respir J. 2015;45:1434–1445. doi:10.1183/09031936.00174914. PMID:25745043