
 ?Mathematical formulae have been encoded as MathML and are displayed in this HTML version using MathJax in order to improve their display. Uncheck the box to turn MathJax off. This feature requires Javascript. Click on a formula to zoom.
ABSTRACT
The cytoskeleton of eukaryotic cells relies on microtubules to perform many essential functions. We have previously shown that, in spite of the overall conservation in sequence and structure of tubulin subunits across species, there are differences between mammalian and budding yeast microtubules with likely functional consequences for the cell. Here we expand our structural and function comparison of yeast and porcine microtubules to show different distribution of protofilament number in microtubules assembled in vitro from these two species. The different geometry at lateral contacts between protofilaments is likely due to a more polar interface in yeast. We also find that yeast tubulin forms longer and less curved oligomers in solution, suggesting stronger tubulin:tubulin interactions along the protofilament. Finally, we observed species-specific plus-end tracking activity for EB proteins: yeast Bim1 tracked yeast but not mammalian MTs, and human EB1 tracked mammalian but not yeast MTs. These findings further demonstrate that subtle sequence differences in tubulin sequence can have significant structural and functional consequences in microtubule structure and behavior.
Introduction
In eukaryotic cells microtubules (MTs) are essential polymers of αβ-tubulin heterodimers. The polar MT structure can have a range of protofilament numbers when assembled in vitro, ranging from 10 to 17 [Citation1], with 13 being the most common and likely the dominant species in vivo [Citation2]. MTs are a major component of the mitotic spindle [Citation3,Citation4] and are responsible in part for organizing organelles such as mitochondria [Citation5] and other cellular constituents [Citation6]. Additionally, microtubules are intricately involved in cell migration [Citation7] and establishing cell polarity [Citation8].
MTs work in concert with a wide range of microtubule-associated proteins (MAPs) to carry out their vital tasks within cells. MAPs are important to organize the MT network into larger assemblies required for their function, and to coordinate MT interaction with down-stream effector proteins. An important class of MAPs binds selectively to the growing ends (+TIPs) of MTs. MTs stochastically switch between growing and shrinking phases [Citation9,Citation10]. This switching, termed dynamic instability, is dependent on the GTPase activity of αβ-tubulin, which occurs within the assembled MT. Molecule, but only the GTP bound to β-tubulin is hydrolyzed, while the other plays a structural role [Citation11]. Our studies using high resolution cryo-electron microscopy (cryo-EM) of mammalian tubulin have shown that the hydrolysis of GTP results in a conformational change in tubulin and a compaction across the interdimer interface [Citation12,Citation13]. The nucleotide state and the associated tubulin conformation is responsible for distinguishing the +TIP from the rest of the lattice [Citation14]. This allows the +TIP tracking proteins to bind appropriately [Citation12,Citation15] where they significantly influence the intrinsic dynamic instability of MTs [Citation16].
Until recently, studies have relied almost exclusively on mammalian brain tissue as the source of tubulin for in vitro studies. These sources contain a mixture of tubulin isotypes and post-translational modifications that complicate detailed mechanistic studies [Citation17]. Purifications of tubulin from different species provide a potential route to more homogeneous tubulin [Citation18–22], but despite some successes the resulting yields have not been reliable enough to cause widespread adoption. Recombinant expression and purification of tubulin is also not straightforward, although recent advances suggest that these obstacles are starting to fall [Citation23–25]. Nevertheless, there remains a relative dearth of in vitro data on tubulin mutants. Conversely, organisms that have been genetically tractable for the past few decades, such as the budding yeast Saccharomyces cerevisiae (hereafter referred to as yeast), have provided a wealth of in vivo data on tubulin [Citation26–30]. In principle, the yeast system also has the advantage of greater natural homogeneity, both in terms of tubulin isotype composition and post-translational modifications. But while the body of yeast work has provided invaluable information about MTs, it is not possible to reliably infer mechanistic and structural details from cellular studies alone.
To overcome this limitation and to make use of the extensive literature on yeast tubulin mutants, overexpression systems and optimized purification procedures have been developed for budding yeast [Citation31–33]. These methods produce sufficient material for rigorous in vitro characterization, including for tubulin mutants that would otherwise be lethal. Despite high conservation of αβ-tubulin sequences across evolution, it is not always safe to assume that tubulins from different species are effectively interchangeable. Indeed, our recent report highlights the fact that even subtle changes in tubulin sequence can have a dramatic effect on MT structure and interactions: we did not observe spontaneous αβ-tubulin compaction in yeast MTs, and we also identified a novel binding pattern for the +TIP tracking protein Bim1 (EB protein family in humans) that was specific to yeast MTs [Citation34]. To extend this work and further establish a comparative baseline between mammalian and yeast MTs, here we show that yeast MTs generally assemble with fewer protofilaments in vitro compared to porcine brain tubulin, and that yeast tubulin oligomers, assemblies outside of the lattice, are longer and straighter. We also show that +TIP tracking relies in part on species-specific mechanisms and only works when the species source is not mixed. Collectively, these results underscore how relatively modest changes can have significant effects, and suggest new tracking mechanisms for the growing ends of MTs that also has implications for dynamic instability.
Results
Yeast MTs assembled in vitro have fewer protofilaments, unless co-assembled with a +TIP-binding protein
To provide insights into the structure and conformational transitions of yeast MTs, as well as a foundation for future structural characterization of mutants, we carried out cryo-EM studies of yeast MTs polymerized under various assembly conditions, such as nucleotide, presence of drugs, and/or protein binding partner. The assembly conditions collectively define the lattice state that is observed in the micrographs. For most conditions, MTs were decorated with kinesin as in previous studies [Citation12,Citation13], in order to prevent averaging of α- and β-tubulin (see also Materials and Methods). We found that the protofilament (PF) number distribution for yeast MTs differs significantly from that in mammalian samples (). For dynamic yeast MTs (i.e. in the absence of any stabilizing drugs or GTP analogues) 12 PFs are the most common number (∼40%), in contrast to mammalian MTs, for which the most common PF number is 14 PFs (∼55%, with 35% being 13 PF and 12 being a very minor species) when polymerized in vitro [Citation35,Citation36]. Assembling mammalian MTs with the slowly hydrolyzable analogue GMPCPP causes a further shift to 14 PFs (∼95%) [Citation37]. Following a similar trend, yeast GMPCPP-MTs also show a shift towards an increased PF number, with 13-PFs becoming the most common (∼55%). When we investigated the effect of MT-stabilizing anti-mitotic drugs, we found that both Taxol (added to a yeast tubulin mutated to bind it) [Citation38] and epothilone further biased the distribution towards 12 PF MTs (from 40% to 55%), an effect that parallels what is seen for mammalian MTs (∼60 % 12 PF in the presence of taxol) [Citation35,Citation39]. Thus, while yeast MTs generally have lower PF numbers than their mammalian counterparts, the effect that nucleotide and drugs have on both systems follow similar trends.
Figure 1. Protofilament distribution in yeast MTs assembled under different conditions. Fraction of total MT length visualized containing different protofilament numbers (PF), as assigned by comparison with different reference models (see M&M). Total number of tubulin dimers analyzed for each condition: Dyn 1,133,455; Dyn+Bim1 46,563; GMPCPP 732,319; GTPγS 202,312; GTPγS+Bim1 201,671; Epo. 186,683; Tax. 603,552. Previously published mammalian distributions shown for comparison [Citation35].
![Figure 1. Protofilament distribution in yeast MTs assembled under different conditions. Fraction of total MT length visualized containing different protofilament numbers (PF), as assigned by comparison with different reference models (see M&M). Total number of tubulin dimers analyzed for each condition: Dyn 1,133,455; Dyn+Bim1 46,563; GMPCPP 732,319; GTPγS 202,312; GTPγS+Bim1 201,671; Epo. 186,683; Tax. 603,552. Previously published mammalian distributions shown for comparison [Citation35].](/cms/asset/aa5391b8-8e2d-4b82-bfad-680cd3cb157b/kccy_a_1415680_f0001_oc.jpg)
The +TIP protein EB binds between PFs and results in close to 100% 13-PF MTs, for both mammalian and fission yeast proteins [Citation12,Citation15,Citation40]. We see a similar but not as complete shift to 13 PF MTs (from 20% without EB to 55%) for co-assembly of yeast tubulin with Bim1, the EB homolog in yeast. Thus, likely due to their binding between PFs, the EB family of proteins largely overrides the effect of tubulin source and favors an angle between PFs corresponding to a 13-PF MT. Yeast MTs assembled with GTPγS, a non-hydrolysable GTP analogue, again formed most commonly 12 PFs MTs (∼50%). Surprisingly, we observed primarily 13 PF MTs (∼65%) when GTPγS MTs were washed with excess Bim1 on the EM grid before freezing for cryo-EM analysis, a process that took less than one minute. This result suggests that the 12 PF GTPγS lattice may transiently open to incorporate an additional PF in the presence of Bim1, but we cannot rule out alternative explanations, including preferential destabilization of MTs with smaller protofilament numbers. In summary, yeast tubulin generally assembles into MTs with fewer PFs than mammalian tubulin, while coassembly with or addition of an EB protein promotes a 13 PF lattice for both budding yeast and mammalian brain MTs.
The different PF numbers we observe could be a consequence of the amino acid differences between tubulins from yeast and mammals near the lateral MT interface (A-C). We examined atomic models for yeast [Citation34] and mammalian tubulin [Citation12] to provide a structural context for the sequence differences at the homotypic lateral tubulin interfaces (i.e. α-tubulin interacting with α-tubulin and β-tubulin interacting with β-tubulin). In spite of the fact that this interaction surface is rather small (∼100 Å2 buried surface area per monomer), we identified a number of non-conservative amino acid differences at lateral contacts. Some of the sites of variation between the two species are well conserved among neuronal tubulin isotypes present in the mammalian sample used for our studies. Yeast tubulin is also different from porcine brain tubulin at a few sites where there is already variation among mammalian isoforms. In a few of these latter cases, the yeast sequence corresponds to one specific isoform in mammals. In α-tubulin (C) there are changes in the loop between helix-H1 and β-strand S2: S54 to H and A58 to Y (the mammalian residue is referenced first). Interestingly, S54 is changed to C in the mammalian α-tubulin-IV isotype. On the other side of the interface, there are also differences in the loop between β-strand S7 and helix-H9: Q285 to S and L286 to N. These four substitutions appear to alter the Cα backbone of these regions. Substitutions in the α-tubulin M-loop (E279 to S, and Y282 to F) do not appear to affect the overall conformation of the loop. For tub3, the minor α-tubulin isotype in budding yeast (∼10%), these changes are E279 to K and Y282 to T, while the glutamate is conserved across mammalian α-tubulin isotypes. Taken together, these substitutions result in a lateral interface for yeast α-tubulin that is characterized by more polar interactions compared to the mammalian lateral interface. Similarly, there are also differences at the β-β interface that continue the trend towards a more polar lateral interface. Interestingly, the changes A57 to S and G58 to S between porcine tubulin and yeast are the same as the isotype changes from mammalian β-tubulin-II (the most abundant neuronal isoform) to β-tubulin-III for both residues (the most common amino acid for position 57 is T for other neuronal, mammalian β-tubulin isotypes). On the M-loop side, the switch from mammalian S275 to yeast A corresponds to a change from the consensus serine to a β-tubulin-III-specific A. Other changes in this region include R276 to I, Q282 to S, Y283 to F, and A285 to S. These positions do not vary among neuronal β-tubulin isotypes The number and nature of these sequence differences have the potential to alter slightly the geometry of the contacts, energetically favoring 12 PF over 13 PF MTs (see ), and may also affect the strength of tubulin:tubulin contacts.
Figure 2. Differences at lateral contact within the MT between mammalian and yeast tubulin. (A) Cα traces for the yeast tubulin model of two adjacent tubulin dimers. The boxes correspond to the regions displayed in (B) and (C). Superposition of the yeast atomic model [Citation34] aligned with mammalian tubulin [Citation12] around the lateral contacts for β-tubulin (B) and α-tubulin (C). Residue differences between yeast and mammalian tubulin near the lateral interface are indicated. Yeast models shown in darker shades (α-tubulin in green, β-tubulin in blue). Labeled residues reference mammalian tubulin residue first. Contacts between β-tubulins are similar, while in α-tubulin the loops between helix-H1 and β-strand-S2, and between β-strand-S7 and helix-H9 (C-terminal region of the M-loop) adopt different conformations.
![Figure 2. Differences at lateral contact within the MT between mammalian and yeast tubulin. (A) Cα traces for the yeast tubulin model of two adjacent tubulin dimers. The boxes correspond to the regions displayed in (B) and (C). Superposition of the yeast atomic model [Citation34] aligned with mammalian tubulin [Citation12] around the lateral contacts for β-tubulin (B) and α-tubulin (C). Residue differences between yeast and mammalian tubulin near the lateral interface are indicated. Yeast models shown in darker shades (α-tubulin in green, β-tubulin in blue). Labeled residues reference mammalian tubulin residue first. Contacts between β-tubulins are similar, while in α-tubulin the loops between helix-H1 and β-strand-S2, and between β-strand-S7 and helix-H9 (C-terminal region of the M-loop) adopt different conformations.](/cms/asset/503dd906-3859-4ce9-b0a9-cbead0f80066/kccy_a_1415680_f0002_oc.jpg)
Yeast tubulin oligomers in solution are longer and straighter than mammalian tubulin oligomers
To explore whether structural differences between yeast and mammalian tubulin are observed outside the context of the MT lattice, we used negative stain EM to visualize the morphology of tubulin at low temperature, at which MTs do not form and only small oligomers are present. We did this for GTP- and GDP-bound tubulin, and for mammalian as well as yeast tubulin (see Materials and Methods). The yeast oligomers appeared longer (A-D), even though a 5-fold lower concentration of yeast tubulin was used compared to the mammalian sample. To quantify the differences in oligomer length and to characterize the conformation of tubulin therein, we manually measured the length and curvature of oligomers traced in the micrographs.
Figure 3. Analysis of tubulin oligomers reveals differences outside the MT lattice that may contribute to distinct dynamic instability properties of mammalian and yeast MTs. A-D) Negative stain images of (A-B) GDP and (C-D) GTP bound oligomers for (A and C) mammalian, and (B and D) yeast tubulin sources. Quantification of oligomer length (E) and curvature (F) for manually traced oligomers. The number of tubulin dimers in the mammalian oligomers does not change with nucleotide, unlike for the yeast oligomers, which are longer when GTP-bound. The majority of yeast oligomers are less curved when GTP-bound than when GDP-bound, unlike the mammalian tubulin (Mann-Whitney test p < 1 × 10⁻⁵ between mammalian and yeast GTP-bound oligomers, and Mann-Whitney test p < 1 × 10⁻³ between mammalian and yeast GDP-bound oligomers). Scale bar 50 nm. n > 200 for each condition.
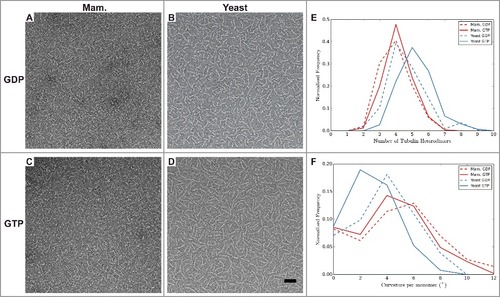
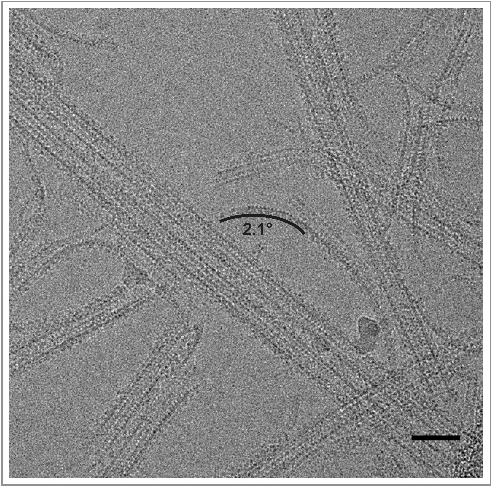
Under our experimental conditions (50 µM mammalian αβ-tubulin and 10 µM yeast αβ-tubulin), we find that the most common oligomer size for GDP-tubulin was four αβ-tubulin molecules, regardless of the tubulin origin (E). When bound to GTP, the most common oligomer length for mammalian tubulin remained centered at 4 dimers whereas for the yeast tubulin the most common oligomer length increased to 5. Obtaining oligomers of comparable or greater length using reduced concentration likely indicates that yeast tubulin forms more stable longitudinal interfaces compared to mammalian tubulin. Measurements of oligomer curvature, defined as the average curvature per monomer for an oligomer (see Materials and Methods) showed that GTP-bound yeast tubulin had a single peak around 2°. This is straighter than the mammalian GTP-bound tubulin, which had a peak around 4°. While this difference is small, the observed shift in distributions is robust (Mann-Whitney test p < 1 × 10⁻⁵, ). When bound to GDP, the mammalian oligomers angle distribution shifted to having a peak at around 6°. GDP-bound yeast tubulin also showed an increase in curvature of oligomers over the GTP-bound sample with a peak around 4° and thus resembled the mammalian GTP distribution. All of these oligomers display curvatures that are less than the curvature that has been observed in “ram's horn” depolymerization products or in crystallographic studies of tubulin bound to a variety of other proteins [Citation41]. We cannot discard the possibility that interactions with the supporting film on the EM grid influence the oligomer geometries, but we expect the influence of the support film to be the same for both types of tubulin. Interestingly, we observed long extensions at the ends of dynamic yeast MTs (), which are much rarer when imaging mammalian dynamic MTs (data not shown). These extensions have a curvature that corresponds closely to that most commonly observed for GTP-bound yeast oligomers (F), and thus could be formed by longitudinal addition of these oligomers.
Figure 4. Long extensions observed for dynamic yeast MTs. Examples of long extensions of tubulin from the ends of MTs. Curvature (degrees per monomer) for one of these extensions is indicated, and corresponds closely to that most commonly observed for GTP-bound yeast oligomers (see F). Many of these extensions appear to be more than one protofilament wide. Scale bar 50 nm. MTs are decorated with kinesin motor domain.
+TIP tracking mechanisms are not fully conserved between yeast and mammalian MTs
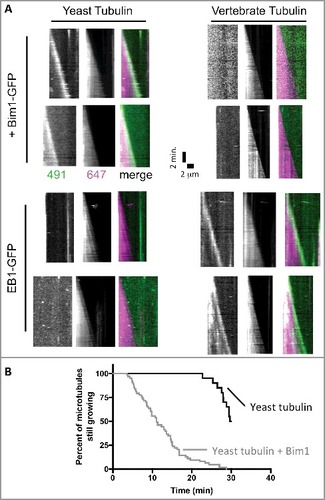
The data described above reveal different structural and biochemical properties of yeast tubulin. Do the changes in sequence also affect regulatory proteins? A recent study reported that Bim1 was an inefficient plus-end tracker in assays using vertebrate MTs [Citation42], but this claim was apparently in conflict with prior work from one of our labs showing apparently normal plus end tracking of Bim1 on yeast MTs [Citation33]. Because different microtubules (mammalian vs yeast) were used in the two studies, we sought to determine if species-specific effects might explain these apparently conflicting observations. We used two-color TIRF microscopy to examine the plus-end tracking of yeast Bim1 and human EB1 proteins on yeast and porcine MTs (A). These experiments showed that Bim1 robustly tracked the growing ends of yeast, but not vertebrate, MTs. Likewise, we observed that human EB1 robustly tracked vertebrate, but not yeast, MTs (A). We also observed, consistent with reports on other EB-family proteins, that Bim1 increases the frequency of catastrophe for yeast MTs (B), Thus, only cognate, species-specific EB1-MT pairs showed robust plus-end tracking at the low concentrations (<100 nM) used in these assays.
Figure 5. The plus-end tracking activity of Bim1 and EB1 shows species specificity. (A) Kymographs showing the behavior of Bim1-GFP (top rows) or EB1-GFP (bottom rows) on yeast (left columns) or bovine (right columns) microtubules labeled with Alexa-647. GFP and 647 channels are shows separately in greyscale, with the corresponding merged image in color. Robust tracking was only observed for ‘all yeast’ or ‘all mammalian’ combinations of EB and tubulin. All microtubules in the assay behaved consistently with the two representative microtubules shown for each condition. (B) Survival curve representing the percentage of microtubules still growing at the indicated time. Under the conditions of our assay, yeast microtubules were relatively long-lived in the absence of Bim1 (black curve; only 10 of 20 microtubules measured underwent catastrophe from the 20 axonemes monitored during the 30 minute recording). Addition of Bim1-GFP greatly increased the frequency of catastrophe (64 catastrophes recorded from the 20 axonemes monitored).
Discussion
Our studies have unveiled a number of differences in the structure and interactions of in vitro assembled yeast and mammalian MTs. The most obvious difference in our cryo-EM analysis is the reduction in protofilament number for yeast with respect to mammalian MTs. We speculate that a small number of sequence changes between porcine and yeast tubulin at the lateral interface may be the source of the PF differences. Both the number and nature of these sequence differences have the potential to alter slightly the geometry of the contacts, energetically favoring 12 PF over 13 PF MTs for yeast tubulin (see ). The large number of serine residues (at positions 57, 58, 282 and 285) in the yeast β-tubulin lateral contact makes this region significantly more polar than the corresponding region in mammalian tubulin, and a similar trend is also seen for α-tubulin. These differences at the lateral interface may alter the stability of lateral contacts and potentially also their stability as a function of temperature. MT dynamics depend strongly on temperature, and yeast cells tolerate a much larger range of growth temperatures than mammalian cells. We speculate that these changes at the lateral interface might reflect part of an adaptation that preserves microtubule function over a broader range of temperatures.
An important consideration when comparing porcine brain and yeast tubulin is the diversity of isotypes for α- and β-tubulin in mammals (https://www.genenames.org/cgi-bin/genefamilies/set/778). Neuronal sources in adult mammals are predominantly α-tubulin-I [Citation43,Citation44] and β-tubulin-II [Citation45]. Yeast has only two α-tubulin isotypes [Citation46], with α-tubulin-I (tub1) as the most predominant, and a single β-tubulin [Citation47]. The diversity of mammalian isotypes stems, in large part, from complex developmental needs and a large variety of tissues with distinct MT requirements, while such diversity can be dispensed with in yeast. While sequence differences, both between species and between isotypes, are largely confined to the C-terminal tails of both tubulin subunits, a few differences are present in the core of the protein and near lateral interfaces. Some of the changes between porcine brain and yeast tubulin highlighted here due to their involvement in polymerization interfaces (at positions 57, 58 and 275 in beta tubulin) are interestingly also seen for the mammalian β-tubulin-III, an isoform expressed almost uniquely in neurons. Perhaps these positions represent sites where mutations can modulate microtubule dynamics. Overall, 5 out of 6 differences between yeast and mammalian α-tub, and 4 out of 7 differences between yeast and mammalian β-tub, are at sites that do not vary across mammalian isoforms.
Another difference between mammalian and yeast tubulin stems from the different pattern of post-translational modifications, which are more abundant in the former. For example, acetylation of K40 is present for some fraction of porcine brain α-tubulin, but is absent in yeast. This modified residue lies near the lateral interface and can influence the mechanical properties of MTs [Citation48]. K40 is present within a disordered loop and acetylation does not alter MT structure or the PF distribution [Citation49]. All other modifications reside in the variable and unstructured C-terminal tails. In summary, it seems most likely that the differences we observe do indeed result from the sequence differences between porcine brain and yeast sources, but future work specifically addressing isotype differences and modifications will more directly address this possibility.
In this study, we also characterized structural differences for yeast and mammalian oligomers formed at low temperature where MTs do not assemble. Our analysis shows that yeast tubulin forms longer and less curved oligomers than its mammalian counterpart. Given that we used lower concentrations of yeast tubulin, observing longer oligomers strongly suggests stronger tubulin:tubulin binding for yeast tubulin. Stronger self-association contacts are consistent with observation that yeast MTs elongate at lower free tubulin concentration than mammalian MTs [Citation19,Citation33,Citation50]. We also observed long extensions at the ends of dynamic yeast MTs (see ). Such extensions are much rarer when imaging mammalian dynamic MTs. These distinctive extensions on yeast MTs might reflect a different propensity for yeast tubulin to become straight, and/or a more asymmetric mode of protofilament elongation that could be a consequence of stronger interactions along the protofilament.
The species-specific plus-end tracking we observed rationalizes the apparently conflicting prior reports of poor Bim1 tip-tracking on porcine MTs [Citation42], but robust tracking of Bim1 on yeast MTs [Citation33]. Taken with the intradimer binding of Bim1 yeast MTs [Citation34], these data support the idea that the differences in sequence and mode of binding across species are important for the functional interaction of EB proteins with the MT. The isotype diversity may also play a role as different mammalian and yeast isotypes have been shown to influence MT dynamics [Citation51–53] and are differentially expressed in tissues with stable or more dynamic MT structures [Citation54]. It is interesting to note that some of the changes we observe between the most common mammalian sequence and yeast tubulins are mirrored by changes in the β-tubulin-III isotype, which displays different dynamics than mixed mammalian MTs [Citation53]. The species-specific differences in structure and activity we observed are not unique to EB proteins. Of notice, species-specific differences in binding stoichiometry have also been observed in cryo-EM studies of Ndc80 kinetochore complexes. Whereas two human Ndc80 complex binds per αβ-tubulin on the MT [Citation55], only one C. elegans Ndc80 complex binds per tubulin dimer [Citation56]. Likewise, species-specific differences in activity have been observed for MT nucleation by γ-tubulin complexes where the yeast γ-tubulin ring complex promoted MT nucleation for yeast tubulin more significantly than for brain tubulin [Citation57]. Lastly, MT elongation was accelerated by the yeast microtubule polymerase Stu2 more for yeast tubulin than porcine [Citation58]. Given that Bim1 is primarily responsible for recruiting other proteins to the ends of growing MTs, the relevance of its different behavior across species may also extend to +TIP cargoes.
In closing, the high level of sequence and structure conservation between yeast and mammalian tubulin predicts that these proteins should behave similarly. However, we find that the cumulative effect of modest residue changes leads to significant differences in both tubulin oligomers and +TIP tracking. It remains to be seen whether the in vitro differences for these distant species result in different MT behavior in vivo, where the combined effect of many protein interactions will all influence such behavior.
Materials and methods
All reagents were purchased from Sigma-Aldrich (St. Louis) unless otherwise specified.
+TIP protein and microtubule preparation for cryo-EM
Yeast tubulin, including a mutant that binds taxol [Citation38], was purified as previously described [Citation20,Citation33]. The taxol-binding yeast tubulin contained both isotypes of α-tubulin (in the normal ratio of ∼10% tub3) while the other yeast tubulin preparations contained closer to single isotype because they were purified from strains that overexpressed Tub1 and Tub2, but not Tub3. Porcine tubulin was purchased from Cytoskeleton (Denver, CO, Cat #T240) and resuspended in BRB80 buffer (80 mM PIPES, pH 6.9, 1 mM EGTA, 1 mM MgCl2, 1 mM DTT) supplemented with 10% (v/v) glycerol and 1 mM GTP to 10 mg/ml and stored in 10 µl aliquots at −80 °C until needed. This preparation is a mixture of tubulin isotypes and post-translational modifications, with α-tubulin-I and β-tubulin-II being the most common isotypes. A Bim1-EGFP monomer construct, comprising Bim1 amino acids 1–210, was purified according to previous protocols [Citation59] as was the human EB3 monomer with amino acids 1–200 [Citation12]. The construct for EB1-GFP was generously loaned from the Kapoor Lab (Rockefeller University). Expression and purification of EB1-GFP was performed as previously described [Citation60]. Yeast MTs in various states were prepared following protocols in Howes et al. [Citation34]. Briefly, tubulin in BRB80 buffer that also contained 10% (v/v) glycerol and the appropriate nucleotide and/or drug was warmed to 30°C. After polymerization microtubules were spun down for 20 minutes at 17,000 x g and resuspended in BRB80 and the appropriate nucleotide and/or drug to remove unpolymerized tubulin and glycerol. MTs were applied to plasma cleaned C-flat grids (Protochips). The Vitrobot, Mark IV (Thermo Fisher, formerly FEI) was used for blotting, as previously described [Citation34].
Cryo-EM sample imaging and data processing
Micrographs were collected on a low-base Titan electron microscope (Thermo Fisher) operated at 300kV and equipped with a K2 direct detector (Gatan) using the Leginon automated software [Citation61]. The micrographs were collected at a nominal magnification of 27,500x, resulting in a final pixel size of 1.32 Å per pixel at the sample. Twenty frames of 300ms each were collected at a dose rate of 8 e− per pixel per s, with a total dose of 28 e−/Å2.
Micrographs were processed as previously described [Citation12,Citation34,Citation62]. Briefly, frame alignments were performed using MOTIONCORR [Citation63], and CTF estimation using CTFFIND4 [Citation64]. MTs were manually identified and extracted using overlapping square boxes with an edge length of ∼675 Å that were spaced ∼80 Å apart, corresponding to approximately on turn of tubulin dimers. Each of these boxes was treated as an independent, single particle [Citation65] during sorting by protofilament number and initial 3D alignment using EMAN2 [Citation66] with models of 12, 13, 14, and 15 protofilament MTs [Citation67]. The total number of dimers imaged for each MT protofilament number was calculated by multiplying the number of boxes that were assigned to the model by its protofilament number.
Tubulin oligomer sample preparation, imaging and analysis
Dynamic microtubules were prepared as above from mammalian and yeast tubulin. The dynamic microtubules were split into two tubes of equal volume and pelleted. Each pellet was resuspended in cold BRB80 to approximately 10 µM for yeast tubulin and 50 µM for mammalian tubulin supplemented with 10% glycerol and either 1 mM GTP or 2 mM GDP. This helped ensure that the oligomers from each sample had a defined nucleotide bound. The tubulin pellets were all resuspended to a concentration above the critical concentration, but kept on ice at all times to prevent polymerization. EM grids were prepared by depositing the oligomers onto freshly glow-discharged continuous carbon grids prepared in house. Mammalian tubulin, which has a higher critical concentration, 5 µM compared to 1 µM for yeast [Citation19], was incubated on the grid for a shorter time than the yeast samples to ensure that the oligomers remained separated. Grids were then stained by swirling the grid in three drops of 2% (w/v) uranyl acetate and excess stain was blotted away by touching a piece of filter paper to the side of the grid. Images of the oligomers were collected under low dose conditions using Leginon (Suloway et al., 2005) on a Tecnai F20 (Thermo Fisher) operating at 120 kV and equipped with a 4k Ultrascan CCD camera (Gatan). Micrographs were recorded at a nominal magnification of 80,000 × , giving a final size of 1.37 Å/pixel at the sample.
Oligomers were manually traced from the raw micrographs along their length using ImageJ [Citation68]. The number of tubulin heterodimers in each oligomer was estimated by dividing the length of the traced oligomer by the size of the tubulin dimer (8 nm) and rounding to the nearest integer. The curvature per monomer was calculated as the angle that would reduce the end-to-end distance of a straight oligomer with the measured number of dimers (number of dimers multiplied by 8 nm) to the measured end-to-end distance, assuming equal curvature between monomers. The exact form of the equation depends on the number of monomers. For example, in the case of an oligomer with 4 dimers (8 monomers of length a, 4 nm and seven angles between the monomers) the equation relating end-to-end distance (d) to the curvature per monomer (θ) is:
Dynamic assays with Bim1-GFP and EB1-GFP
We prepared a plasmid to express wild-type yeast αβ-tubulin containing a C-terminal ‘KCK’ tag on Tub2. Purified, cycled bovine tubulin was purchased from PurSolutions (Charlottesville, VA Cat #032005) and stored as recommended by the manufacturer. The construct for EB1-GFP was a gift from T. Kapoor (Rockefeller University).
Wild-type or KCK-tagged yeast αβ-tubulin was purified from inducibly overexpressing strains of S. cerevisiae using Ni-affinity and ion exchange chromatography as described previously [Citation33]. Tubulin samples were stored in storage buffer (10 mM PIPES pH 6.9, 1 mM MgCl2, 1 mM EGTA) containing 50 μM GTP. Expression and purification of Bim1-GFP and EB1-GFP was performed as previously described [Citation33,Citation60].
Prior to use in assays, KCK-tagged yeast tubulin was freshly labeled with Alexa Fluor 647 (Thermo Fisher, Cat# 064705). Briefly, wild-type yeast tubulin was quickly thawed and hardspun at 4 °C for 10 minutes, 16k RCF. Alexa Fluor 647 was mixed in a 3:1 ratio with tubulin, along with 2 mM TCEP, and the sample was placed in the dark at RT for 90 minutes. Samples were desalted with 0.5 mL, 7 kDa MWCO spin desalting columns (Zeba) into 1X BRB80/50 uM GTP. We used two-color TIRF microscopy to test for species-specific plus-end tracking. Tubulin mixtures containing a low (1-2%) fraction of labeled tubulin mixed with unlabeled wild-type tubulin were prepared containing 50 nM of either Bim1-GFP or EB1-GFP; tubulin concentration was 0.8 µM for yeast and 5 µM for bovine. These samples were mixed on ice in imaging buffer previously described [Citation33] and then introduced into the flow chambers. Incubation temperatures were 30 °C for yeast MTs and 37 °C for animal MTs, controlled at using a WeatherStation temperature controller with enclosure fit to the microscope's body. The reactions were imaged by total internal reflection fluorescence microscopy using an Olympus IX81 microscope with a TIRF ApoN 60x/1.49 objective lens, a 491 nm 50 mW solid-state laser, a 647 nm 100 mW solid-state laser and Photometrics Prime 95B CMOS camera (Photometrics). Micro-Manager 1.4.16 (Edelstein et al., 2010) was used to control the microscope. Images of MTs were taken in 5 sec increments from 15–30 min. Kymograph images were created in ImageJ (Schneider et al., 2012) using the ReSlice function. Overlay TIRF images were created by merging the 491 (Bim1/EB1) and 647 (tubulin) channels together in ImageJ.
We used differential interference contrast (DIC) microscopy to test if Bim1 increased the frequency of catastrophe. Samples containing either 0.8 µM wild-type yeast tubulin, or 0.8 µM wild-type yeast tubulin with 100 nM Bim1-GFP were introduced into flow chambers. MT dynamics were imaged by differential interference contrast (DIC) microscopy, as previously described [Citation33] using a UPlan S Apo 100X/1.40 NA objective lens (Olympus), DIC prisms and a Photometrics Prime 95B CMOS camera (Photometrics). Microtubule dynamics were recorded at 30 °C, in batches of 10 25 ms images, spaced 5 seconds apart for a duration of 30 min. The batches of 10 images were averaged together using Micro-Manger 2.0 beta's On the Fly image processor. At the end of the movie, background images were taken and averaged. From each condition, microtubules growing from 20 axonemes were chosen for quantification. Assays were then analyzed in ImageJ (Schneider et al., 2012) where kymographs were constructed using the ReSlice function and the number of catastrophes that occurred over the length of the assays were manually counted.
Disclosure of potential conflicts of interest
There is no conflict of interest.
Acknowledgements
We thank Patricia Grob and Tom Houweling for EM and computer support, respectively. Nathaniel Krefman, Itziar Ibarlucea, and Georjana Barnes helped with the purification of the taxol-sensitized yeast tubulin; Robert A. Welch Foundation [grant number I-1908].
Additional information
Funding
References
- Chrétien D, Wade RH. New data on the microtubule surface lattice. Biol Cell. 1991;71:161–74. doi:10.1016/0248-4900(91)90062-R. PMID:1912942
- Tilney LG, Bryan J, Bush DJ, et al. Microtubules: evidence for 13 protofilaments. J Cell Biol. 1973;59:267–75. doi:10.1083/jcb.59.2.267. PMID:4805001
- Heald R, Khodjakov A. Thirty years of search and capture: The complex simplicity of mitotic spindle assembly. J Cell Biol. 2015;211:1103–11. doi:10.1083/jcb.201510015. PMID:26668328
- Ward JJ, Roque H, Antony C, et al. Mechanical design principles of a mitotic spindle. Elife. 2014;3:e03398–e03398. doi:10.7554/eLife.03398. PMID:25521247
- Saxton WM, Hollenbeck PJ. The axonal transport of mitochondria. J Cell Sci. 2012;125:2095–104. doi:10.1242/jcs.053850. PMID:22619228
- Gurel PS, Hatch AL, Higgs HN. Connecting the Cytoskeleton to the Endoplasmic Reticulum and Golgi. Curr Biol. 2014;24:R660–72. doi:10.1016/j.cub.2014.05.033. PMID:25050967
- Etienne-Manneville S. Microtubules in cell migration. Annu Rev Cell Dev Biol. 2013;29:471–99. doi:10.1146/annurev-cellbio-101011-155711. PMID:23875648
- Cearns MD, Escuin S, Alexandre P, et al. Microtubules, polarity and vertebrate neural tube morphogenesis. J Anat. 2016;229:63–74. doi:10.1111/joa.12468. PMID:27025884
- Mitchison TJ, Kirschner M. Dynamic instability of microtubule growth. Nature. 1984;312:237–42. doi:10.1038/312237a0. PMID:6504138
- Desai A, Mitchison TJ. Microtubule polymerization dynamics. Annu Rev Cell Dev Biol. 1997;13:83–117. doi:10.1146/annurev.cellbio.13.1.83. PMID:9442869
- Nogales E, Wolf SG, Downing KH. Structure of the alpha beta tubulin dimer by electron crystallography. Nature. 1998;391:199–203. doi:10.1038/34465. PMID:9428769
- Zhang R, Alushin GM, Brown A, et al. Mechanistic Origin of Microtubule Dynamic Instability and Its Modulation by EB Proteins. Cell. 2015;162:849–59. doi:10.1016/j.cell.2015.07.012. PMID:26234155
- Alushin GM, Lander GC, Kellogg EH, et al. High-resolution microtubule structures reveal the structural transitions in αβ-tubulin upon GTP hydrolysis. Cell. 2014;157:1117–29. doi:10.1016/j.cell.2014.03.053. PMID:24855948
- Maurer SP, Bieling P, Cope J, et al. GTPgammaS microtubules mimic the growing microtubule end structure recognized by end-binding proteins (EBs). Proc Natl Acad Sci. 2011;108:3988–93. doi:10.1073/pnas.1014758108. PMID:21368119
- Maurer SP, Fourniol FJ, Bohner G, et al. EBs recognize a nucleotide-dependent structural cap at growing microtubule ends. Cell. 2012;149:371–82. doi:10.1016/j.cell.2012.02.049. PMID:22500803
- Maurer SP, Cade NI, Bohner G, et al. EB1 accelerates two conformational transitions important for microtubule maturation and dynamics. Curr Biol. 2014;24:372–84. doi:10.1016/j.cub.2013.12.042. PMID:24508171
- Janke C, Bulinski JC. Post-translational regulation of the microtubule cytoskeleton: mechanisms and functions. Nat Rev Mol Cell Biol. 2011;12:773–86. doi:10.1038/nrm3227. PMID:22086369
- Widlund PO, Podolski M, Reber S, et al. One-step purification of assembly competent tubulin from diverse eukaryotic sources. Mol Biol Cell. 2012;23:4393–401. doi:10.1091/mbc.E12-06-0444. PMID:22993214
- Davis A, Sage CR, Wilson L, et al. Purification and biochemical characterization of tubulin from the budding yeast Saccharomyces cerevisiae. Biochemistry. 1993;32:8823–35. doi:10.1021/bi00085a013. PMID:8364030
- Drummond DR, Kain S, Newcombe A, et al. Purification of Tubulin from the Fission Yeast Schizosaccharomyces pombe. Methods Mol Biol. 2011;777:29–55. doi:10.1007/978-1-61779-252-6_3. PMID:21773919
- Sackett DL, Werbovetz Ka, Morrissette NS. Isolating tubulin from nonneural sources. Methods Cell Biol. 2010;95:17–32. doi:10.1016/S0091-679X(10)95002-4.
- Yoon Y, Oakley BR. Purification and characterization of assembly-competent tubulin from Aspergillus nidulans. Biochemistry. 1995;34:6373–81. doi:10.1021/bi00019a016. PMID:7756266
- Minoura I, Hachikubo Y, Yamakita Y, et al. Overexpression, purification, and functional analysis of recombinant human tubulin dimer. FEBS Lett. 2013;587:3450–5. doi:10.1016/j.febslet.2013.08.032. PMID:24021646
- Ti S-C, Pamula MC, Howes SC, et al. Mutations in human tubulin proximal to the kinesin-binding site alter dynamic instability at microtubule plus- and minus-ends. Dev Cell. 2016;37:72–84. doi:10.1016/j.devcel.2016.03.003. PMID:27046833
- Valenstein ML, Roll-Mecak A. Graded control of microtubule severing by tubulin glutamylation. Cell. 2016;164:911–21. doi:10.1016/j.cell.2016.01.019. PMID:26875866
- Machin NA, Lee JM, Barnes G. Microtubule stability in budding yeast: characterization and dosage suppression of a benomyl-dependent tubulin mutant. Mol Biol Cell. 1995;6:1241–59. doi:10.1091/mbc.6.9.1241. PMID:8534919
- Schatz PJ, Solomon F, Botstein D. Isolation and characterization of conditional-lethal mutations in the TUB1 alpha-tubulin gene of the yeast Saccharomyces cerevisiae. Genetics. 1988;120:681–95. PMID:3066684
- Thomas JH, Neff NF, Botstein D. Isolation and characterization of mutations in the beta-tubulin gene of Saccharomyces cerevisiae. Genetics. 1985;111:715–34. PMID:2998923
- Richards KL, Anders KR, Nogales E, et al. Structure-function relationships in yeast tubulins. Mol Biol Cell. 2000;11:1887–903. doi:10.1091/mbc.11.5.1887. PMID:10793159
- Reijo RA, Cooper EM, Beagle GJ, et al. Systematic mutational analysis of the yeast beta-tubulin gene. Mol Biol Cell. 1994;5:29–43. doi:10.1091/mbc.5.1.29. PMID:8186463
- Ayaz P, Ye X, Huddleston P, et al. A TOG:αβ-tubulin complex structure reveals conformation-based mechanisms for a microtubule polymerase. Science (80-). 2012;337:857–60. doi:10.1126/science.1221698.
- Johnson V, Ayaz P, Huddleston P, et al. Design, overexpression, and purification of polymerization-blocked yeast αβ-tubulin mutants. Biochemistry. 2011;50:8636–44. doi:10.1021/bi2005174. PMID:21888381
- Geyer EA, Burns A, Lalonde BA, et al. A mutation uncouples the tubulin conformational and GTPase cycles, revealing allosteric control of microtubule dynamics. Elife. 2015;4:e10113. doi:10.7554/eLife.10113. PMID:26439009
- Howes SC, Geyer EA, LaFrance B, et al. Structural differences between yeast and mammalian microtubules revealed by cryo-EM. J Cell Biol. 2017;216:jcb.201612195. doi:10.1083/jcb.201612195.
- Meurer-Grob P, Kasparian J, Wade RH. Microtubule structure at improved resolution. Biochemistry. 2001;40:8000–8. doi:10.1021/bi010343p. PMID:11434769
- Wade RH, Chrétien D, Job D. Characterization of microtubule protofilament numbers. How does the surface lattice accommodate? J Mol Biol. 1990;212:775–86. doi:10.1016/0022-2836(90)90236-F. PMID:2329582
- Hyman AA, Chrétien D, Arnal I, et al. Structural changes accompanying GTP hydrolysis in microtubules: information from a slowly hydrolyzable analogue guanylyl-(alpha,beta)-methylene-diphosphonate. J Cell Biol. 1995;128:117–25. doi:10.1083/jcb.128.1.117. PMID:7822409
- Gupta ML, Bode CJ, Georg GI, et al. Understanding tubulin-Taxol interactions: mutations that impart Taxol binding to yeast tubulin. Proc Natl Acad Sci. 2003;100:6394–7. doi:10.1073/pnas.1131967100. PMID:12740436
- Andreu JM, Bordas J, Diaz JF, et al. Low resolution structure of microtubules in solution. Synchrotron X-ray scattering and electron microscopy of taxol-induced microtubules assembled from purified tubulin in comparison with glycerol and MAP-induced microtubules. J Mol Biol. 1992;226:169–84. doi:10.1016/0022-2836(92)90132-4. PMID:1352357
- des Georges A, Katsuki M, Drummond DR, et al. Mal3, the Schizosaccharomyces pombe homolog of EB1, changes the microtubule lattice. Nat Struct Mol Biol. 2008;15:1102–8. doi:10.1038/nsmb.1482. PMID:18794845
- Brouhard GJ, Rice LM. The contribution of αβ-tubulin curvature to microtubule dynamics. J Cell Biol. 2014;207:323–34. doi:10.1083/jcb.201407095. PMID:25385183
- Molodtsov MI, Mieck C, Dobbelaere J, et al. A force-induced directional switch of a molecular motor enables parallel microtubule bundle formation. Cell. 2016;167:539–552.e14. doi:10.1016/j.cell.2016.09.029. PMID:27716509
- Aiken J, Buscaglia G, Bates EA, et al. The α-Tubulin gene TUBA1A in brain development: a key ingredient in the neuronal isotype blend. J Dev Biol. 2017;5:8. doi:10.3390/jdb5030008. PMID:29057214
- Miller FD, Naus CC, Durand M, et al. Isotypes of alpha-tubulin are differentially regulated during neuronal maturation. J Cell Biol. 1987;105:3065–73. doi:10.1083/jcb.105.6.3065. PMID:3693406
- Banerjee A, Luduena RF. Kinetics of colchicine binding to purified beta-tubulin isotypes from bovine brain. J Biol Chem. 1992;267:13335–9. PMID:1618835
- Schatz PJ, Pillus L, Grisafi P, et al. Two functional alpha-tubulin genes of the yeast Saccharomyces cerevisiae encode divergent proteins. Mol Cell Biol. 1986;6:3711–21. doi:10.1128/MCB.6.11.3711. PMID:3025610
- Neff NF, Thomas JH, Grisafi P, et al. Isolation of the beta-tubulin gene from yeast and demonstration of its essential function in vivo. Cell. 1983;33:211–9. doi:10.1016/0092-8674(83)90350-1. PMID:6380751
- Portran D, Schaedel L, Xu Z, et al. Tubulin acetylation protects long-lived microtubules against mechanical ageing. Nat Cell Biol. 2017;19:391–8. doi:10.1038/ncb3481. PMID:28250419
- Howes SC, Alushin GM, Shida T, et al. Effects of tubulin acetylation and tubulin acetyltransferase binding on microtubule structure. Mol Biol Cell. 2014;25:257–66. doi:10.1091/mbc.E13-07-0387. PMID:24227885
- Gupta ML, Bode CJ, Thrower DA, et al. beta-Tubulin C354 mutations that severely decrease microtubule dynamics do not prevent nuclear migration in yeast. Mol Biol Cell. 2002;13:2919–32. doi:10.1091/mbc.E02-01-0003. PMID:12181356
- Bode CJ, Gupta ML, Suprenant KA, et al. The two alpha-tubulin isotypes in budding yeast have opposing effects on microtubule dynamics in vitro. EMBO Rep. 2003;4:94–9. doi:10.1038/sj.embor.embor716. PMID:12524528
- Pamula MC, Ti SC, Kapoor TM. The structured core of human β tubulin confers isotype-specific polymerization properties. J Cell Biol. 2016;213:425–33. doi:10.1083/jcb.201603050. PMID:27185835
- Vemu A, Atherton J, Spector JO, et al. Structure and dynamics of single-isoform recombinant neuronal human tubulin. J Biol Chem. 2016;291:12907–15. doi:10.1074/jbc.C116.731133. PMID:27129203
- Leandro-García LJ, Leskelä S, Landa I, et al. Tumoral and tissue-specific expression of the major human β-tubulin isotypes. Cytoskeleton. 2010;67:214–23. doi:10.1002/cm.20436. PMID:20191564
- Alushin GM, Ramey VH, Pasqualato S, et al. The Ndc80 kinetochore complex forms oligomeric arrays along microtubules. Nature. 2010;467:805–10. doi:10.1038/nature09423. PMID:20944740
- Wilson-Kubalek EM, Cheeseman IM, Milligan RA. Structural comparison of the Caenorhabditis elegans and human Ndc80 complexes bound to microtubules reveals distinct binding behavior. Mol Biol Cell. 2016;27:1197–203. doi:10.1091/mbc.E15-12-0858. PMID:26941333
- Kollman JM, Greenberg CH, Li S, et al.. Ring closure activates yeast γTuRC for species-specific microtubule nucleation. Nat Struct Mol Biol. 2015;22:132–7. doi:10.1038/nsmb.2953. PMID:25599398
- Podolski M, Mahamdeh M, Howard J. Stu2, the budding yeast XMAP215/Dis1 homolog, promotes assembly of yeast microtubules by increasing growth rate and decreasing catastrophe frequency. J Biol Chem. 2014;289:28087–93. doi:10.1074/jbc.M114.584300. PMID:25172511
- Zimniak T, Stengl K, Mechtler K, et al. Phosphoregulation of the budding yeast EB1 homologue Bim1p by Aurora/Ipl1p. J Cell Biol. 2009;186:379–91. doi:10.1083/jcb.200901036. PMID:19667128
- Forth S, Hsia K-C, Shimamoto Y, et al. Asymmetric friction of nonmotor MAPs can lead to their directional motion in active microtubule networks. Cell. 2014;157:420–32. doi:10.1016/j.cell.2014.02.018. PMID:24725408
- Suloway C, Pulokas J, Fellmann D, et al. Automated molecular microscopy: the new Leginon system. J Struct Biol. 2005;151:41–60. doi:10.1016/j.jsb.2005.03.010. PMID:15890530
- Zhang R, Nogales E. A new protocol to accurately determine microtubule lattice seam location. J Struct Biol. 2015;192:245–54. doi:10.1016/j.jsb.2015.09.015. PMID:26424086
- Li X, Mooney P, Zheng S, et al. Electron counting and beam-induced motion correction enable near-atomic-resolution single-particle cryo-EM. Nat Methods. 2013;10:584–90. doi:10.1038/nmeth.2472. PMID:23644547
- Rohou A, Grigorieff N. CTFFIND4: Fast and accurate defocus estimation from electron micrographs. J Struct Biol. 2015;192:216–21. doi:10.1016/j.jsb.2015.08.008. PMID:26278980
- Egelman EH. The iterative helical real space reconstruction method: surmounting the problems posed by real polymers. J Struct Biol. 2007;157:83–94. doi:10.1016/j.jsb.2006.05.015. PMID:16919474
- Tang G, Peng L, Baldwin PR, et al. EMAN2: an extensible image processing suite for electron microscopy. J Struct Biol. 2007;157:38–46. doi:10.1016/j.jsb.2006.05.009. PMID:16859925
- Sui H, Downing KH. Structural Basis of Interprotofilament Interaction and Lateral Deformation of Microtubules. Structure. 2010;18:1022–31. doi:10.1016/j.str.2010.05.010. PMID:20696402
- Schneider CA, Rasband WS, Eliceiri KW. NIH Image to ImageJ: 25 years of image analysis. Nat Methods. 2012;9:671–5. doi:10.1038/nmeth.2089. PMID:22930834