
ABSTRACT
Barrett's esophagus (BE) is defined as a metaplasia condition in the distal esophagus, in which the native squamous epithelium lining is replaced by a columnar epithelium with or without intestinal metaplasia. It is commonly accepted that BE is a precancerous lesion for esophageal adenocarcinoma. The aim of this study was to investigate the aberrant microRNAs (miRNAs) and differentially expressed genes (DEGs) associated with BE based on online microarray datasets. One miRNA and five gene expression profiling datasets were retrieved from the Gene Expression Omnibus Database. Aberrant microRNAs and DEGs were obtained using R/Bioconductor statistical analysis language and software. 23 dysregulated miRNAs and 632 DEGs demonstrating consistent expression tendencies in the five gene microarrays were identified in BE. Moreover, 1962 target genes of aberrant miRNAs were predicted using three bioinformatic tools, namely TargetScan, RNA22-HSA and miRDB. Ultimately, 93 target DEGs were obtained, after which functional annotation was performed on DAVID Bioinformatics Resources. Among Gene Ontology (GO) biological processes, digestive tract development and epithelial cell differentiation have demonstrated significant associations with BE pathogenesis. In addition, analysis of the KEGG pathways has revealed associations with cancer. To enable further study, one miRNA-target DEGs regulatory network was constructed using Cytoscape. 6 target DEGs demonstrated higher-degree distributions in the network, and ROC analysis indicated that FNDC3B may be the best potential biomarker for BE diagnosis. The data presented herein may provide new perspectives for exploring BE pathogenesis and may offer hits with regard to potential biomarkers in BE diagnosis, prediction and therapeutic evaluation.
Introduction
Barrett's esophagus (BE) is defined as a metaplasia condition in the distal esophagus, in which the native squamous epithelium lining is replaced by a columnar epithelium with or without intestinal metaplasia [Citation1]. It is a commonly accepted risk factor and important precancerous lesion for esophageal adenocarcinoma (EAC). In recent years, the incidences of BE and EAC have risen consistently, and the risk of BE progressing to EAC has increased by 30–125 times in the general population [Citation2]. It is noteworthy that most studies regarding BE pertain to its carcinogenesis, the underlying pathogenesis of which remains unclear. Therefore, further study is required to clarify BE pathogenesis [Citation3].
MicroRNAs (miRNAs) are a class of endogenous small (18-25 nucleotides) non-coding RNAs derived from long primary transcripts and are found in eukaryotic organisms [Citation4]. Mature miRNAs can identify and bind to target mRNA 3'-untranslated regions (3'-UTR) by means of complementary base pairing, by which the degradation or translational repression of mRNA targets at the post-transcriptional level are regulated [Citation5,Citation6]. Known as post-transcriptional regulators, miRNAs have received substantial attention from researches, and many pertinent studies have already been performed. Recent studies have indicated that miRNAs may be involved in regulating various biological activities, such as development, organ formation, cell proliferation, differentiation, migration and apoptosis [Citation7–9]. Furthermore, some miRNAs have been reported to function as oncogenes or tumor suppressor genes [Citation10–12]. Interestingly, miRNAs present several advantages. First, the number of human miRNAs is significantly smaller than that of mRNAs. In addition, as small non-coding RNA fragments, miRNAs exhibit greater stabilities than mRNAs. Finally, one miRNA could regulate translation of hundreds of mRNAs, and one mRNA could be regulated by a number of miRNAs. Therefore, expression analyses of miRNAs may improve risk stratification analyses for different types of disorders. Microarrays have been widely used to explore expression genes, including miRNAs expression profiling. A series of studies [Citation11,Citation13–17] have indicated that microarrays provide a more effective means of identifying and verifying potential biomarkers in BE at the molecular level.
A number of studies have used microarrays for expression profiling of miRNAs in BE patients [Citation15,Citation18–21]. Compared with healthy controls, these differentially expressed miRNAs may regulate different mRNA targets and influence the pathogenesis of BE. Hence, miRNAs have the potential to become new biomarkers for BE diagnosis, prediction and therapeutic evaluation [Citation10,Citation11,Citation15,Citation18,Citation20,Citation22]. However, the functional roles of these aberrant miRNAs in BE pathogenesis remain unclear and their mRNA targets are poorly studied.
Focusing on BE pathogenesis, the present study investigates the potential miRNAs that are expressed differently in miRNAs expression profiling and differentially expressed genes (DEGs) in five mRNA expression profiling datasets that correlate with BE as determined using online microarrays. Bioinformatic analyses were performed to explore the enrichment in Gene Ontology (GO) and Kyoto Encyclopedia of Genes and Genomes (KEGG) pathway terms. For further study, the interaction network between aberrant miRNAs and target DEGs was constructed, and biomarkers were investigated.
Results
Expression profiling datasets retrieved from GEO Datasets of NCBI
All the microarray samples considered in this study were fresh frozen tissues from human esophagi. First, we applied quality control to the expression microarray chips with QC function in R/Bioconductor to guarantee the quality of our study. In this study, the miRNAs profiling dataset, which included results from 10 BE and 10 NE samples, was GSE24839 using the GPL8871 Platform, which was generated by the University of Padova. The mRNA expression profiling datasets were GSE13083, GSE13898, GSE26886, GSE34619 and GSE39491, respectively. GSE13083 originated from the University of Pennsylvania, which used the GPL96 [HG-U133A] Affymetrix Human Genome U133A Array Platform, and 7 BE and 7 NE samples. GSE26886, generated from Charite-Berlin on the GPL570 [HG-U133_Plus_2] Affymetrix Human Genome U133 Plus 2.0 Array Platform, included 20 BE and 19 NE samples originally. However, the sample numbers were reduced to 8 BE and 10 NE after quality control. All pertinent details are listed in .
Table 1. Information of expression profiling microarray datasets.
Identification of aberrant miRNAs and DEGs in Barrett's esophagus
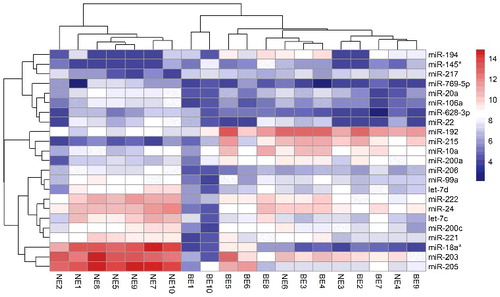
A total of 23 miRNAs were identified as dysregulated in BE tissues compared to those in NE mucosa (|FC|> 2, P values < 0.05, see Supplementary for details). Among these miRNAs, 7 miRNAs were significantly up-regulated (hsa-miR-215, hsa-miR-192, hsa-miR-194, hsa-miR-10a, hsa-miR-145*, hsa-miR-200a and hsa-miR-217), while the expression levels of the other 16 miRNAs were decreased conversely in BE. The top 6 dysregulated miRNAs were hsa-miR-18a*, hsa-miR-205, hsa-miR-215, hsa-miR-203, hsa-miR-192 and hsa-miR-194, for which the values of Log2|FC| were -5.06, -3.92, 3.83, -3.39, 2.21 and 2.13, respectively. Bi-cluster analysis was conducted, and the data showed that most of the BE tissues investigated could be separated well from NE tissues ().
Figure 1. Bi-cluster analysis of differentially expressed miRNAs in Barrett's esophagus tissue Each row represents one of the dysregulated miRNA, and each column represents a tissue sample from Barrett's esophagus and normal esophagus mucosa. Column “BE” represents Barrett's esophagus tissue, while column “NE” represents tissue from normal esophagus. The heat map was constructed based on miRNAs expression value in each sample.
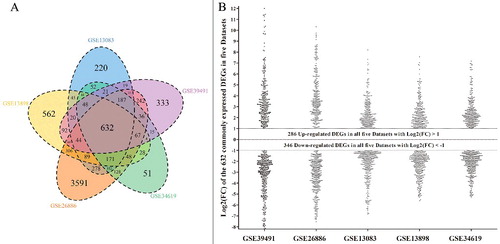
For analyses of the mRNA expression profiling datasets, the limma algorithm was utilized to obtain DEGs in BE, and five lists of DEGs were generated from the above five datasets (P values < 0.05). Then, we applied statistical methods to acquire a final list of common DEGs, and 632 DEGs were identified in all five microarrays (Supplementary Table 2). The gene numbers of each dataset and the intersections among these datasets are shown in (A). Of the 632 commonly expressed DEGs, 286 genes were up-regulated and 346 genes were down-regulated in BE tissues ((B)). Moreover, each gene of the 632 common DEGs displayed the same expression tendency in all five datasets.
Figure 2. Exhibition of differentially expressed genes among the five mRNA expression profiling datasets in Barrett's esophagus; (A) Venn diagram of individual dataset comparisons among the five mRNA expression profiling datasets. The venn diagram was drawn based on each gene expression profiling data from the five datasets. Each circle depicts the number of expressed genes. Overlapping expressed genes shared more than one dataset are represented in the areas of intersection among corresponding circles. The 632 genes in the center of the venn diagram represents the genes commonly expressed in all the five datasets; (B) Scatter diagram of differentially expressed genes among the five mRNA expression profiling datasets. The scatter diagram was constructed based on the Log2(FC) values of the 632 commonly expressed DEGs derived from five datasets. These five datasets were GSE39491, GSE26886, GSE12083, GSE13898 and GSE34619 as the diagram shows.
Bioinformatic analyses of interactions between the potential targets of aberrant miRNAs and DEGs
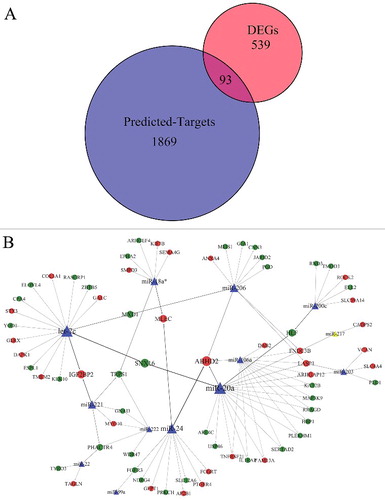
MiRNAs could interact with their mRNA targets, resulting in post-transcriptional suppression of their target genes. Three main bioinformatic tools (TargetScan, RNA22-HSA and miRDB) were used to predict the potential candidate targets of the 23 dysregulated miRNAs. The target genes for each aberrant miRNA were considered common genes identified using all three bioinformatic tools. Then, we determined the intersection between the target genes and common DEGs in the five mRNA expression profiling datasets ((A)). There were 93 common target DEGs in this intersection.
Figure 3. Bioinformatic analysis of predicted targets of aberrant miRNAs and DEGs in Barrett's esophagus; (A) Venn diagram of comparison between predicted targets of aberrant miRNAs and DEGs in the five mRNA expression profiling datasets. Each circle depicts the number of expressed genes. Overlapping expressed genes shared more than one dataset is represented in the area of intersection between 2 circles. The 93 genes in the center of the venn diagram represent the target genes of aberrant miRNAs, which are also commonly expressed in all the five mRNA expression profiling datasets; (B) Regulatory network of aberrant miRNAs and target common DEGs in Barrett's esophagus. Triangles represent aberrant miRNAs (yellow for up-regulated miRNAs and blue for down-regulated miRNAs), and circles represent target common DEGs (red for up-regulated DEGs and green for down-regulated DEGs). The direction of arrows is from dysregulated miRNAs to target DEGs.
To explore the biological functions of the 93 common target DEGs with regard to the regulation of BE pathogenesis, DAVID functional annotation was performed to obtain GO and KEGG pathway enrichment data. First, we uploaded the list containing these 93 DEGs for functional annotation. Then, data pertaining to the GO and KEGG pathway was collected as statistically significant enrichment (P values < 0.05) for further analyses ( and ). The information we obtained regarding biological function and pathway annotation indicated that the 93 DEGs were enriched in 5 Gene Ontology_Biological Process (GO_BP), 4 Gene Ontology_Cellular Component (GO_CC) and 1 Gene Ontology_Molecular Funtion (GO_MF) terms as well as in 5 KEGG pathway terms. Among these GO biological processes, digestive tract development and epithelial cell differentiation were found to be significantly related to BE pathogenesis. Genes included in the digestive tract development process were CLDN18, TRPS1 and COL3A1, with a fold enrichment value of 18.24. Genes enriched in the epithelial cell differentiation process were TAGLN, CNN3 and ANXA4, with a fold enrichment value of 10.09. Moreover, analysis of the enriched KEGG pathway revealed that pathways in cancer were involved with a fold enrichment of 2.90. The related genes were GNAI3, FGFR3, ROCK2, RASGRP1, TGFA, PLCB1 and DAPK1. The predominant, related pathways were MAPK and VEGF signaling pathways, which could regulate sustained angiogenesis and cell proliferation [Citation23–26].
Table 2. GO terms of the commonly expressed 93 DEGs in five mRNA expression profiling datasets.
Table 3. KEGG pathway terms of the selected 93 DEGs.
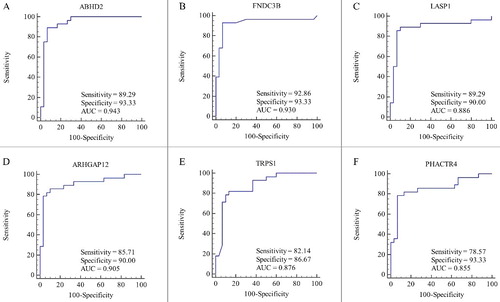
For further elucidation of interactions between the aberrant miRNAs considered herein and their potential common target DEGs, one miRNA-target gene network was constructed using Cytoscape ((B)). The network was composed of two basic elements (miRNAs and genes) and their connections, which represented miRNA-target gene interactions. Our results showed that one miRNA could target multiple genes, and one gene could be affected by multiple miRNAs. The miRNAs with the highest numbers of interactions were hsa-miR-20a, let-7c, hsa-miR-24, hsa-miR-106a, hsa-miR-206, hsa-miR-200c, hsa-miR-221, hsa-miR-222, hsa-miR-18* and hsa-miR-203, each one possessing no less than 5 connections. Moreover, 6 target DEGs (ABHD2, FNDC3B, LASP1, ARHGAP12, TRPS1 and PHACTR4) were found to have higher-degree distributions in the network. We assumed that genes with higher-degree distributions in the regulatory network played an important role in BE pathogenesis. ABHD2, FNDC3B and LASP1 were predicted to be regulated by 4 miRNAs, while ARHGAP12, TRPS1 and PHACTR4 were each predicted to be the targets of 3 miRNAs. Next, we performed ROC analysis on the 6 genes based on GSE39491 dataset because of its sample number. The ROC curves indicated that the expression of these 6 genes provided a means of discriminating between BE and NE tissues, as shown in . Among these, FNDC3B expression provided better differentiation conditions with a sensitivity of 92.86, a specificity of 93.33 and an AUC value of 0.930 (P values < 0.05) ((B)).
Figure 4. Receiver operating characteristic curve analysis for discriminating BE from NE (BE vs. NE); (A) ROC curve of ABHD2; (B) ROC curve of FNDC3B; (C) ROC curve of LASP1; (D) ROC curve of ARHGAP12; (E) ROC curve of TRPS1; (F) ROC curve of PHACTR4.
Discussion
Gastroesophageal reflux disease (GERD) [Citation27] is a common chronic disorder that occurs predominantly when the contents of the stomach are refluxed into the esophagus. The clinical symptoms not only include gastrointestinal symptoms, such as acid reflux and heartburn, but also extraesophageal symptoms. In 2006, the first GERD global consensus was determined using evidence-based medicine, referred to as the Montreal definition [Citation27]. Experts in the Asia Pacific Region made several revisions, after which the Asia Pacific Regional Consensus of GERD was established and renewed [Citation1]. Using upper gastrointestinal endoscopy, GERD patients could be divided into cases of non-erosive reflux disease (NERD) and reflux esophagitis (RE), and were found to involve Barrett's esophagus and esophageal adenocarcinoma (EAC) among other complications [Citation27]. In addition, patients who presented no GERD symptoms may also have been diagnosed with GERD upon exhibiting GERD-related complications or pathological reflux, as determined by examinations. As one of the complications of GERD, BE is characterized by pathological metaplasia in the distal esophagus, in which the squamous epithelial lining is replaced by columnar epithelium with or without intestinal goblet cells [Citation1]. Because intestinal metaplasia with goblet cells is more relevant to EAC, an aggressive malignant cancer, we focused on Barrett's esophagus with intestinal metaplasia [Citation1,Citation28]. MiRNAs are a group of non-coding small RNAs that play an important role in regulating a spectrum of basic cellular processes [Citation7,Citation8]. Endogenous miRNAs interact with the 3'-UTR of target mRNA to suppress post-transcription of genes [Citation5,Citation6]. Previous studies have underscored the relevance of miRNAs as potential biomarkers for disease diagnosis, cancer prediction and prognosis assessment, including BE and EAC [Citation10,Citation11,Citation13,Citation15,Citation17–20,Citation22,Citation29–33]. These studies mostly focused on BE carcinogenesis and were less concerned with its pathogenesis. Therefore, the pathological mechanism of intestinal metaplasia associated with BE is not fully understood. However, studies regarding BE pathogenesis could assist with preventing its occurrence and progression, which would constitute a significant development. To date, only a few studies regarding BE pathogenesis have been reported, so the resulting lack of data entices more researches in this field [Citation3]. Microarrays provide a new methodology for exploring changes in BE pathogenesis on the molecular level. A series of studies have indicated that BE pathogenesis may be related to various factors, including aberrant miRNAs, and that dysregulated miRNAs could be relevant to BE development [Citation15,Citation18–21]. However, studies involving the interactions between aberrant miRNAs and target DEGs in BE are still rare. To our knowledge, the present study is the first to reveal interactions between dysregulated miRNAs and differentially expressed genes in miRNAs and mRNA expression profiling datasets. Identification and analyses of aberrant miRNAs and target DEGs in BE may reveal the underlying pathogenesis of BE on the molecular level and provide improvements in BE diagnosis, treatment and prevention.
After sophisticated arithmetic based on R [Citation34], the microarray results will be visualized and presented as tables corresponding to differentially expressed genes [Citation35]. In the present study, GSE24839, an miRNAs expression profiling dataset containing 10 BE and 10 NE tissue samples, was retrieved and analyzed. Then, 23 dysregulated miRNAs were identified, and bi-cluster analysis was conducted to evaluate data reliability. We found that most of the BE samples could be well differentiated from NE tissue samples, so these dysregulated miRNAs were credible and could be used for further analysis. Among these 23 miRNAs, 7 were significantly up-regulated in BE and the other 16 miRNAs were down-regulated in BE. The 7 up-regulated miRNAs were hsa-miR-215, hsa-miR-192, hsa-miR-194, hsa-miR-10a, hsa-miR-145*, hsa-miR-200a and hsa-miR-217, while the top 6 dysregulated miRNAs were hsa-miR-18a*, hsa-miR-205, hsa-miR-215, hsa-miR-203, hsa-miR-192 and hsa-miR-194, with high values of Log2|FC|. A series of other studies [Citation10,Citation11,Citation15,Citation18,Citation20,Citation22] has already revealed that miRNAs expression in BE is quite different from that in NE. Luzna P et al. [Citation13] proposed that miR-192 and miR-196a were up-regulated with an increase during BE progression. Cabibi D et al. [Citation17] found increased expression levels of miR-143, miR-145, miR-194 and miR-215 in BE, while miR-203 and miR-205 were down-regulated. Wijnhoven B P et al [Citation19]. indicated that miR-21, miR-143, miR-145, miR-193 and miR-215 were expressed in higher levels, and miR-203 and miR-205 were down-regulated in BE compared to NE. Moreover, miR-205, which was down-regulated in BE, was expressed at levels equivalent to NE after endoscopic ablation [Citation33]. Leidner R S et al. [Citation10] also investigated miRNAs expression by next-generation sequencing and found that, among 26 miRNAs related to EAC, as many as 23 miRNAs demonstrated early-stage (BE) dysregulation. Furthermore, Slaby O et al. [Citation11] found that miR-21, miR-25, miR-194 and miR-196a expression levels increased gradually during BE progression to EAC, while miRNA-203, miRNA-205, miRNA-210 and miRNA-378 decreased during the same period. Previous studies have demonstrated the down-regulation of miR-203 in BE as well in other squamous epithelia such as the skin and upper respiratory tract [Citation19,Citation36,Citation37]. This action may target p63 and Zfp281 to regulate stem cell renewal in stratified epithelia [Citation38]. In contrast, expression levels of miR-215 were high in BE. Braun CJ et al. [Citation39] demonstrated that miR-215 may be up-regulated by genotoxic stress, inducing cell cycle arrest, and that p53 played an important role in induction. Therefore, it is possible that miR-215 may act as a tumor suppressor during BE development. Although miRNAs expression profiling in BE has received much attention of late, the regulating mechanisms involved remain unclear, such that the functions of most dysregulated miRNAs remain to be clarified.
In addition to the miRNAs microarray, we applied R/Bioconductor statistics to the mRNA expression data processing [Citation34]. Finally, 632 common DEGs were identified among the five mRNA expression profiling datasets. Interestingly, all 632 DEGs in these datasets displayed consistent expression tendencies. That is, the five datasets selected are of high quality and our results are reliable. To investigate the interactions between the aberrant miRNAs and DEGs derived from microarrays, we first predicted target genes for these 23 dysregulated miRNAs utilizing three main bioinformatic tools (TargetScan, RNA22-HSA and miRDB) [Citation40–42]. In this way, 1962 target genes were obtained. To improve precision, we obtained the intersection of these 1962 target genes and the 632 DEGs and identified 93 potential DEGs.
Subsequently, we utilized DAVID Bioinformatics Resources to analyze these 93 potential DEGs. Functional annotation was performed to reveal the enriched GO and KEGG terms. We found that 5 GO_BP, 4 GO_CC and 1 GO_MF terms were involved. Among these GO biological processes, digestive tract development and epithelial cell differentiation were found to be significantly related to BE pathogenesis. The genes involved in digestive tract development process were CLDN18, TRPS1 and COL3A1 with a fold enrichment value of 18.24. The genes involved in epithelial cell differentiation process were TAGLN, CNN3 and ANXA4 with a fold enrichment value of 10.09. BE is defined as a metaplasia condition in the distal esophagus, in which the squamous epithelial lining is replaced by columnar epithelium [Citation1]. Therefore, the digestive tract development and the epithelial cell differentiation processes are particularly important. Moreover, pathways in cancer were also involved in the 5 enriched KEGG pathway terms with a fold enrichment value of 2.90. The predominant related pathways included the MAPK and VEGF signaling pathways, which have been shown to regulate sustained angiogenesis and cell proliferation [Citation23–26]. BE is the only well-recognized precancerous lesion of EAC, so it was no surprise to find that pathways in cancer were involved. The MAPK (mitogen-activated protein kinase, MAPK) signaling pathway involves an important group of proteins that carry extracellular signals from cell membrane receptors to the nucleus of the cell. This pathway is comprised of the following three principal components: ERK (extracellular signal-regulated kinase, ERK), JNK (c-Jun NH2-terminal kinase, JNK) and p38 kinase [Citation43]. These proteins regulate cell proliferation, differentiation, and many other important biological progresses depending on signaling mediators [Citation23,Citation24,Citation43]. Souza RF et al. [Citation44] have shown that acid can activate MAPK signaling in BAR-T and EAC cells, mediating cell proliferation and apoptosis suppression. Angiogenesis is quite important for the formation of new vascular supplies and is mainly regulated by VEGF (vascular endothelial growth factor, VEGF) signaling pathway [Citation25]. VEGF not only affects angiogenesis in endothelial cells but also plays an important role in tumor cell proliferation and apoptosis inhibition [Citation26]. Many different tumor cells have been reported to co-express VEGF and its receptors, including Barrett's metaplastic epithelium [Citation26,Citation45]. However, the underlying mechanisms remain to be revealed, in particular, the regulatory role of miRNAs.
For further elucidation, the miRNA-target gene network was constructed using Cytoscape with miRNAs and genes as the two basic elements. The miRNAs demonstrating the highest numbers of interactions were hsa-miR-20a, let-7c, hsa-miR-24, hsa-miR-106a, hsa-miR-206, hsa-miR-200c, hsa-miR-221, hsa-miR-222, hsa-miR-18* and hsa-miR-203, all of which possessed no fewer than 5 connections. Moreover, ABHD2, FNDC3B and LASP1 were predicted to be targets of 4 miRNAs, while ARHGAP12, PHACTR4 and TRPS1 were predicted to be targets of 3 miRNAs. It has been shown that one miRNA can target multiple genes and one gene can be affected by multiple miRNAs, consistent with previous researches [Citation31,Citation46]. The aforementioned 6 genes demonstrating higher-degree network distributions were selected for ROC analysis. The ROC curves showed that FNDC3B expression provided superior differentiation, exhibiting a sensitivity of 92.86, a specificity of 93.33 and an AUC value of 0.930 ((B)). FNDC3B, which is located at 3q26 and may amplified in several cancers [Citation47], was identified as an important oncogenic driver of 3q amplicons, such as hepatocytes, and mammary and kidney epithelial cells. Recently, Xu H et al. [Citation48] speculated that FNDC3B may be related to cellular process inhibition, including viability, proliferation, migration and invasiveness. However, FNDC3B studies are somewhat rare, and we could find no published data regarding FNDC3B and BE. This facet indicates the importance of the present study with regard to understanding BE pathogenesis; indeed, this work may provide insight into new biomarkers for BE diagnosis, prediction and therapeutic evaluation. However, more studies are required to elucidate the exact mechanisms of dysregulated miRNAs and miRNA-targeted DEGs.
Although microarray analysis has some limitations, this methodology can provide additional information without selection bias [Citation49]. The sample size of the microarray data utilized herein was not large enough for most of the datasets, so we selected five mRNA expression profiling datasets to reduce the bias caused by insufficient sample size. In the same way, the influence of tissue heterogeneity could also be minimized. However, the quantity of the miRNA profiling datasets was quite small online, so further investigation with larger samples is needed urgently. A study that correlates miRNAs profiling with the clinical outcomes would be a very valuable addition to this field.
Altogether, our results provide evidence that biological processes like digestive tract development and epithelial cell differentiation may be involved in BE pathogenesis and that MAPK and VEGF pathways may also participate in the processes. Furthermore, our results indicate the potential of FNDC3B as a new biomarker in BE diagnosis and prediction.
Materials and methods
Retrieval of microarray datasets from an online database
Microarray datasets of miRNAs and gene expression profiling from BE and normal esophageal mucosa (NE) were obtained and downloaded from Gene Expression Omnibus (GEO) Datasets on the National Center for Biotechnology Information (NCBI) Database (http://www.ncbi.nlm.nih.gov/gds/). The search keywords were Barrett's esophagus. The selection was restricted to Homo sapiens and expression profiling. Finally, the non-coding miRNA profiling dataset (GSE24839) and the mRNA expression profiling datasets (GSE13083, GSE13898, GSE26886, GSE34619 and GSE39491) were downloaded for further analyses.
Bioinformatic analyses of aberrant miRNAs and DEGs
R/Bioconductor statistical analysis language and software [Citation34,Citation50] were utilized for miRNAs and mRNA expression microarray processing, and limma algorithm package was used for identification of differentially expressed miRNAs and mRNA genes. NE was used as control in all these datasets, such that comparisons between BE and NE were conducted. Differentially expressed miRNAs with cut-off-values of at least 2-FC and P values < 0.05 were considered as aberrant miRNAs. DEGs in BE compared to those in NE were defined as commonly expressed and exhibiting consistent tendencies in all five mRNA expression profiling datasets with cut-off-values of at least 2-FC and P values < 0.05.
The target genes of aberrant miRNAs were predicted using three main bioinformatic tools, namely TargetScan (http://www.targetscan.org/), RNA22-HSA (https://cm.jefferson.edu/) and miRDB (http://mirdb.org/cgi-bin/search.cgi). The target genes of each aberrant miRNA were defined as common in all the lists generated from the above three bioinformatic tools. Subsequently, the Database for Annotation, Visualization and Integrated Discovery (DAVID) Bioinformatics Resources (https://david.ncifcrf.gov/) was used for functional annotation [Citation35], and the miRNA-target genes interaction network was constructed using Cytoscape [Citation51].
Statistical analysis
All statistical analyses were performed using SPSS software (version 18.0) and GraphPad Prism software (version 6). Furthermore, receiver operating characteristic (ROC) curve analysis was performed using Med-Calc statistical software (version 15.2.2.2), and P values < 0.05 were considered statistically significant when sensitivity, specificity and the area under the curve (AUC) were calculated.
Disclosure of potential conflicts of interest
The authors report no conflict of interest.
supplementary.rar
Download (60.9 KB)Acknowledgements
This work was supported by grants from the National Natural Science Foundation of China (No. 81702067), China Postdoctoral Science Foundation (#2017M613176) and Shaanxi Natural Science Foundation of China (#2017JQ8041).
Additional information
Funding
Related Research Data
References
- Fock KM, Talley N, Goh KL, et al. Asia-Pacific consensus on the management of gastro-oesophageal reflux disease: an update focusing on refractory reflux disease and Barrett's oesophagus. Gut. 2016;65:1402–1415. doi:10.1136/gutjnl-2016-311715. PMID:27261337.
- de Jonge PJ, van Blankenstein M, Grady WM, et al. Barrett's oesophagus: epidemiology, cancer risk and implications for management. Gut. 2014;63:191–202. doi:10.1136/gutjnl-2013-305490. PMID:24092861.
- Brown CS, Ujiki MB. Risk factors affecting the Barrett's metaplasia-dysplasia-neoplasia sequence. World J Gastroint Endosc. 2015;7:438–445. doi:10.4253/wjge.v7.i5.438. PMID:25992184.
- Doench JG, Sharp PA. Specificity of microRNA target selection in translational repression. Gene Dev. 2004;18:504–511. doi:10.1101/gad.1184404.
- Bartel DP. MicroRNAs: target recognition and regulatory functions. Cell. 2009;136:215–233. doi:10.1016/j.cell.2009.01.002. PMID:19167326.
- Gao J, Wang WY, Mao YW, et al. A novel pathway regulates memory and plasticity via SIRT1 and miR-134. Nature. 2010;466:1105–1109. doi:10.1038/nature09271. PMID:20622856.
- Guo F, Tian J, Lin Y, et al. Serum microRNA-92 expression in patients with ovarian epithelial carcinoma. J Int Med Res. 2013;41:1456–1461. doi:10.1177/0300060513487652. PMID:23963852.
- Peng WZ, Ma R, Wang F, et al. Role of miR-191/425 cluster in tumorigenesis and diagnosis of gastric cancer. Int Journal Mol Sci. 2014;15:4031–4048. doi:10.3390/ijms15034031. PMID:24603541.
- Chugh P, Dittmer DP. Potential pitfalls in microRNA profiling. Wiley Interdiscipl Rev RNA. 2012;3:601–616. doi:10.1002/wrna.1120. PMID:22566380.
- Leidner RS, Ravi L, Leahy P, et al. The microRNAs, MiR-31 and MiR-375, as candidate markers in Barrett's esophageal carcinogenesis. Genes Chromosom Canc. 2012;51:473–479. doi:10.1002/gcc.21934.
- Slaby O, Srovnal J, Radova L, et al. Dynamic changes in microRNA expression profiles reflect progression of Barrett's esophagus to esophageal adenocarcinoma. Carcinogenesis. 2015;36:521–527. doi:10.1093/carcin/bgv023. PMID:25784377.
- Kan T, Meltzer SJ. MicroRNAs in Barrett's esophagus and esophageal adenocarcinoma. Current Opin Pharmacol. 2009;9:727–732. doi:10.1016/j.coph.2009.08.009. PMID:19773200.
- Luzna P, Gregar J, Uberall I, et al. Changes of microRNAs-192, 196a and 203 correlate with Barrett's esophagus diagnosis and its progression compared to normal healthy individuals. Diagn Pathol. 2011;6:114. doi:10.1186/1746-1596-6-114. PMID:22094011.
- Bansal A, Gupta V, Wang K. MicroRNA expression signatures during malignant progression from Barrett's esophagus. J Cell Biochem. 2016;117:1288–1295. doi:10.1002/jcb.25497. PMID:26808728.
- van Baal JW, Verbeek RE, Bus P, et al. microRNA-145 in Barrett's oesophagus: regulating BMP4 signalling via GATA6. Gut. 2013;62:664–675. doi:10.1136/gutjnl-2011-301061. PMID:22504665.
- Bus P, Kestens C, Ten Kate FJ, et al. Profiling of circulating microRNAs in patients with Barrett's esophagus and esophageal adenocarcinoma. J Gastroenterol. 2016;51:560–570. doi:10.1007/s00535-015-1133-5. PMID:26585599.
- Cabibi D, Caruso S, Bazan V, et al. Analysis of tissue and circulating microRNA expression during metaplastic transformation of the esophagus. Oncotarget. 2016;7:47821–47830. doi:10.18632/oncotarget.10291. PMID:27374102.
- Yang H, Gu J, Wang KK, et al. MicroRNA expression signatures in Barrett's esophagus and esophageal adenocarcinoma. Clin Cancer Res Off J Am Assoc Cancer Res. 2009;15:5744–5752. doi:10.1158/1078-0432.CCR-09-0385. PMID:19737949.
- Wijnhoven BP, Hussey DJ, Watson DI, et al. South Australian oesophageal research G. MicroRNA profiling of Barrett's oesophagus and oesophageal adenocarcinoma. British J Surg. 2010;97:853–861. doi:10.1002/bjs.7000. PMID:20301167.
- Fassan M, Volinia S, Palatini J, et al. MicroRNA expression profiling in human Barrett's carcinogenesis. Int J Cancer. 2011;129:1661–1670. doi:10.1002/ijc.25823. PMID:21128279.
- Fassan M, Volinia S, Palatini J, et al. MicroRNA expression profiling in the histological subtypes of Barrett's Metaplasia. Clin Transl Gastroenterol. 2013;4:e34. doi:10.1038/ctg.2013.5. PMID:23677165.
- Mathe EA, Nguyen GH, Bowman ED, et al. MicroRNA expression in squamous cell carcinoma and adenocarcinoma of the esophagus: associations with survival. Clinical Cancer Res Off J Am Assoc Cancer Res. 2009;15:6192–6200. doi:10.1158/1078-0432.CCR-09-1467. PMID:19789312.
- Roberts PJ, Der CJ. Targeting the Raf-MEK-ERK mitogen-activated protein kinase cascade for the treatment of cancer. Oncogene. 2007;26:3291–3310. doi:10.1038/sj.onc.1210422. PMID:17496923.
- Looby E, Abdel-Latif MM, Athie-Morales V, et al. Deoxycholate induces COX-2 expression via Erk1/2-, p38-MAPK and AP-1-dependent mechanisms in esophageal cancer cells. BMC Cancer. 2009;9:190. doi:10.1186/1471-2407-9-190. PMID:19534809.
- Ferrara N, Gerber HP, LeCouter J. The biology of VEGF and its receptors. Nat. Med. 2003;9:669–676. doi:10.1038/nm0603-669. PMID:12778165.
- Zhang Q, Yu C, Peng S, et al. Autocrine VEGF signaling promotes proliferation of neoplastic Barrett's epithelial cells through a PLC-dependent pathway. Gastroenterology. 2014;146:461–472. e6. doi:10.1053/j.gastro.2013.10.011. PMID:24120473.
- Vakil N, van Zanten SV, Kahrilas P, et al. The Montreal definition and classification of gastroesophageal reflux disease: a global evidence-based consensus. Am J Gastroenterol. 2006;101:1900–1920. quiz 43. doi:10.1111/j.1572-0241.2006.00630.x. PMID:16928254.
- Shaheen NJ. Falk GW, Iyer PG, Gerson LB, American College of G. ACG Clinical Guideline: diagnosis and management of Barrett's Esophagus. Am J Gastroenterol. 2016;111:30–50. quiz 1. doi:10.1038/ajg.2015.322. PMID:26526079.
- Poehlmann A, Kuester D, Malfertheiner P, et al. Inflammation and Barrett's carcinogenesis. Pathol Res Pract. 2012;208:269–280. doi:10.1016/j.prp.2012.03.007. PMID:22541897.
- Mavrakis KJ, Van Der Meulen J, Wolfe AL, et al. A cooperative microRNA-tumor suppressor gene network in acute T-cell lymphoblastic leukemia (T-ALL). Nat Genet. 2011;43:673–678. doi:10.1038/ng.858. PMID:21642990.
- Yang N, Coukos G, Zhang L. MicroRNA epigenetic alterations in human cancer: one step forward in diagnosis and treatment. Int J Cancer. 2008;122:963–968. doi:10.1002/ijc.23325. PMID:18098137.
- Chen H, Zhang Z, Lu Y, et al. Downregulation of ULK1 by microRNA-372 inhibits the survival of human pancreatic adenocarcinoma cells. Cancer Sci. 2017;108:1811–1819. doi:10.1111/cas.13315. PMID:28677209.
- Dijckmeester WA, Wijnhoven BP, Watson DI, et al. MicroRNA-143 and -205 expression in neosquamous esophageal epithelium following Argon plasma ablation of Barrett's esophagus. J Gastrointest Surg Off J Soc Surg Aliment Tract. 2009;13:846–853. doi:10.1007/s11605-009-0799-5. PMID:19190970.
- Barrett T, Wilhite SE, Ledoux P, et al. NCBI GEO: archive for functional genomics data sets–update. Nucleic Acid Res. 2013;41:D991–D995. doi:10.1093/nar/gks1193. PMID:23193258.
- Huang da W, Sherman BT, Lempicki RA. Systematic and integrative analysis of large gene lists using DAVID bioinformatics resources. Nat Protoc. 2009;4:44–57. doi:10.1038/nprot.2008.211. PMID:19131956.
- Yi R, O'Carroll D, Pasolli HA, et al. Morphogenesis in skin is governed by discrete sets of differentially expressed microRNAs. Nat Genet. 2006;38:356–362. doi:10.1038/ng1744. PMID:16462742.
- Tran N, McLean T, Zhang X, et al. MicroRNA expression profiles in head and neck cancer cell lines. Biochem Bioph Res Commun. 2007;358:12–17. doi:10.1016/j.bbrc.2007.03.201. PMID:17475218.
- Yi R, Poy MN, Stoffel M, et al. A skin microRNA promotes differentiation by repressing ‘stemness’. Nature. 2008;452:225–229. doi:10.1038/nature06642. PMID:18311128.
- Braun CJ, Zhang X, Savelyeva I, et al. p53-Responsive micrornas 192 and 215 are capable of inducing cell cycle arrest. Cancer Res. 2008;68:10094–10104. doi:10.1158/0008-5472.CAN-08-1569. PMID:19074875.
- Oliveira AC, Bovolenta LA, Nachtigall PG, et al. Combining results from distinct MicroRNA target prediction tools enhances the performance of analyses. Front Genet. 2017;8:59. doi:10.3389/fgene.2017.00059. PMID:28559915.
- Riffo-Campos AL, Riquelme I, Brebi-Mieville P. Tools for sequence-based miRNA target prediction: what to choose? Int J Mol Sci. 2016;17:1987. doi:10.3390/ijms17121987. PMID: 27941681.
- Peterson SM, Thompson JA, Ufkin ML, et al. Common features of microRNA target prediction tools. Front Genet. 2014;5:23. doi:10.3389/fgene.2014.00023. PMID: 24600468.
- Kim EK, Choi EJ. Compromised MAPK signaling in human diseases: an update. Arch Toxicol. 2015;89:867–882. doi:10.1007/s00204-015-1472-2. PMID: 25690731.
- Souza RF, Shewmake K, Terada LS, et al. Acid exposure activates the mitogen-activated protein kinase pathways in Barrett's esophagus. Gastroenterology. 2002;122:299–307. doi:10.1053/gast.2002.30993. PMID: 11832445.
- Griffiths EA, Pritchard SA, McGrath SM, et al. Increasing expression of hypoxia-inducible proteins in the Barrett's metaplasia-dysplasia-adenocarcinoma sequence. Brit J Cancer. 2007;96:1377–1383. doi:10.1038/sj.bjc.6603744. PMID: 17437013.
- Slack FJ, Weidhaas JB. MicroRNA in cancer prognosis. New Engl J Med. 2008;359:2720–2722. doi:10.1056/NEJMe0808667. PMID: 19092157.
- Cai C, Rajaram M, Zhou X, et al. Activation of multiple cancer pathways and tumor maintenance function of the 3q amplified oncogene FNDC3B. Cell Cycle. 2012;11:1773–1781. doi:10.4161/cc.20121. PMID: 22510613.
- Xu H, Hu Y, Qiu W. Potential mechanisms of microRNA-129-5p in inhibiting cell processes including viability, proliferation, migration and invasiveness of glioblastoma cells U87 through targeting FNDC3B. Biomed Pharmac Biomed Pharmacotherapie. 2017;87:405–411. doi:10.1016/j.biopha.2016.12.100.
- Wang Y, Barbacioru C, Hyland F, et al. Large scale real-time PCR validation on gene expression measurements from two commercial long-oligonucleotide microarrays. BMC Genom. 2006;7:59. doi:10.1186/1471-2164-7-59. PMID: 16551369.
- Gregory Alvord W, Roayaei JA, Quinones OA, et al. A microarray analysis for differential gene expression in the soybean genome using Bioconductor and R. Briefings Bioinform. 2007;8:415–431. doi:10.1093/bib/bbm043. PMID: 17906332.
- Shannon P, Markiel A, Ozier O, et al. Cytoscape: a software environment for integrated models of biomolecular interaction networks. Genome Res. 2003;13:2498–2504. doi:10.1101/gr.1239303. PMID: 14597658.