
ABSTRACT
Although a lot of effort has been put into the search for factors responsible for aging in yeast mother cells, our knowledge of cellular changes in daughter cells originating from old mothers is still very limited. It has been shown that an old mother is not able to compensate for all negative changes within its cell and therefore transfers them to the bud. In this paper, we show for the first time that daughter cells of an old mother have a reset lifespan expressed in units of time despite drastic reduction of their budding lifespan, which suggests that a single yeast cell has a fixed programmed longevity regardless of the time point at which it was originated. Moreover, in our study we found that longevity parameters are not correlated with the rDNA level, DNA damage, chromosome structure or aging parameters (budding lifespan and total lifespan).
Introduction
The nature and mechanisms of aging remain one of the mysteries of biology [Citation1]. For better understanding of the processes occurring in cells we use model organisms, e.g. the budding yeast Saccharomyces cerevisiae. Yeast represents one of the simplest and most acceptable model organisms for the studies on aging. In a standard approach, the lifespan of S. cerevisiae is measured either by determining the survival time of the population of non-budding cells (chronological lifespan, CLS) [Citation2–Citation4] or by monitoring the budding lifespan of single yeast cells (replicative lifespan, reproductive potential, RLS) [Citation5–Citation7]. In this paper, we focused only on the budding lifespan.
In 1959, Mortimer and Johnston discovered that yeast cells have a limited budding lifespan [Citation8]. For nearly all of the first half of their reproductive limit, yeast mother cells produce daughters with full reproductive capacity. At the extreme, daughters of old mothers (in the last 10% of their lifespan) had 75% lower budding lifespans compared to the mother cell [Citation9]. This suggests that mother cells might have accumulated a senescence factor. Henderson and Gottschling (2008) described four criteria for a senescence factor: it is more abundant in the mother cell than in daughters; a high level of that factor limits the budding lifespan in young cells; reduction of the senescence factor in old mother cells extends the budding lifespan; the factor should be asymmetrically distributed between the mother and daughters [Citation10]. Over the last decades, many hypotheses and factors have been described as potentially influencing yeast aging. Recently, hypotheses such as extrachromosomal rDNA circles [Citation11], DNA instability [Citation12], protein damage [Citation13], mitochondrial dysfunction [Citation14] or hypertrophy [Citation15,Citation16] have been proposed as senescence factors.
As yeast age, a sequence of changes occurs in yeast cells. These changes apply to the whole cell and occur at the level of cell organelles. During budding, bud scars are created on the cell wall surface [Citation17]; therefore, chitin accumulation was proposed to be a hypothetical factor determining the budding lifespan. Early reports suggested that the bud scar (built, among others, of chitin) occupies about 1 percent of the cell surface. Therefore, according to these findings, a yeast cell is able to perform 100 doublings [Citation18]. Recent data suggest, however, that bud scars can hardly influence budding lifespan as yeast cells can achieve a maximum of 60 – 80 buddings [Citation19]. When the mother cell produces subsequent daughters, its cell size increases [Citation20–Citation22], which is the unavoidable result of budding as the method of asexual reproduction. Also, the doubling time increases with the mother’s age [Citation23], mainly during the last five buddings [Citation24,Citation25]. Other impact on old cells includes insensitivity to pheromone[Citation26] or decrease in mating frequency [Citation27].
Changes occurring during aging are not only metabolic changes in the cell as a whole but also changes in cell organelles: the vacuole [Citation28], mitochondrion [Citation29] and nucleus [Citation30]. All changes have been reviewed extensively in a relevant paper [Citation31].
It is clear that a young mother produces daughter cells with full budding lifespans. The rejuvenation mechanism allows maintenance of a lineage with full budding lifespan. Rejuvenation becomes impaired as the mother ages [Citation9] but meiosis of old diploid cells contributes to generation of rejuvenated haploid cells [Citation32]. These data favour the hypothesis that aging occurs through accumulation of aging factors.
Much attention has been devoted to changes during aging in yeast mother cells, yet little is known about the fate of daughters coming from old mothers. Previous data suggest that daughters of old mothers have their budding lifespans altered in comparison to daughters from young mothers; however, there are no data showing the exact age (expressed in units of time) of these cells. Therefore, the main aim of this report was to determine the budding lifespan and total lifespan expectancy of daughters from old mothers and to cast more light on factors affecting aging in the examined cells.
Materials and methods
Strains
All yeast strains used in this study are listed in .
Table 1. Saccharomyces cerevisiae strains used in the study
Clone separation
During a routine analysis of reproductive potential, daughters from old mothers (in the 20th budding) in each strain were moved to a separate place in the same Petri dish. After 2 days, a small quantity of cells was taken and transferred to fresh YPD medium. The clones were used for all analyses. Mitochondrial dysfunction in the clones was confirmed with the use of YPGly medium. In rho°Clones, the loss of mtDNA was verified by DAPI – 4,6-diamidino-2-phenylindole.
Generation of rho° strains
Strains lacking mtDNA (rho°) were generated by treatment of the wild-type strains (BY4741) and the analysed rho+ mutants (lcl1Δ, lcl2Δ and bud1Δ) with ethidium described elsewhere [Citation33]. Ethidium bromide was added to reach the concentration of 10 μg/ml and the cells were incubated at room temperature with shaking for approximately 30 h in rich medium (YPD). After the second and third treatment with 10 μg/ml ethidium bromide for 30 h, the cells were diluted (1:100). Following incubation, the cells were diluted in sterile water and plated on solid YPD medium to obtain single colonies. The mutants were selected as the cells unable to form colonies on YPGly plates (1% yeast extract, 1% peptone, 3% (v/v) glycerol, 2% agar). In the rho°Cells, the loss of mtDNA was verified by DAPI – 4,6-diamidino-2-phenylindole (Sigma-Aldrich) staining [Citation34]. Representative photographs are shown in Figure 1.
Media and growth conditions
Yeast was grown in standard liquid YPD medium (1% yeast extract, 1% yeast Bacto-Peptone, 2% glucose) on a rotary shaker at 150 rpm at the temperature of 28°C. All analyses were performed using yeast cells in the logarithmic phase of growth.
Kinetics of growth assay
Growth assays were carried out on liquid medium. Yeast cell suspension was incubated for 12 h in a shaking incubator at 28°C (Heidolph Incubator 1000 at 1200 rpm). The growth was monitored in the Anthos 2010 type 17550 microplate reader at 600 nm by performing measurements at 2 h intervals for 12 h.
Determination of budding lifespan
The budding lifespan of individual mother yeast cells was defined as the number of mitotic cycles (buddings) during the cell’s life. After overnight growth, cells were arrayed on a YPD plate using a micromanipulator. The reproductive potential was determined microscopically by a routine procedure with the use of a micromanipulator as described previously [Citation35]. The number of buds formed by each mother cell signifies its reproductive potential. In each experiment, forty-five single cells were analysed. The results represent measurements for at least 90 cells analysed in two independent experiments. The analysis was performed by micromanipulation using the Nikon Eclipse E200 optical microscope with an attached micromanipulator.
Determination of total lifespan
The total lifespan was defined as the length of life of a single mother cell expressed in units of time. The total lifespan was calculated as the sum of reproductive and post-reproductive lifespans. The reproductive lifespan was defined as the length of time between the first and the last budding, and the post-reproductive lifespan as the length of time from the last budding until cell death. The lifespan of the Saccharomyces cerevisiae yeast was determined as previously described by Minois et al [Citation36]. with small modification [Citation35]. Ten microliter aliquots of an overnight grown culture of yeast were collected and transferred on YPD plates with solid medium containing Phloxine B (10 μg/ml). Phloxine B was used to stain Saccharomyces cerevisiae dead cells. Dead yeast cells lose membrane integrity and Phloxine B entered cell space giving pink/red coloration of cytosol. In each experiment, forty-five single cells were analysed. During manipulation, the plates were kept at 28°C for 15 h and at 4°C during the night. The results represent measurements for at least 90 cells analysed in two independent experiments. The analysis was performed by micromanipulation using the Nikon Eclipse E200 optical microscope with an attached micromanipulator.
Pulsed-field gel electrophoresis (PFGE)
Preparation of agarose-embedded yeast DNA and PFGE separation of yeast DNA were conducted as described elsewhere [Citation37].
Comet assay
DNA double-strand breaks (DSBs) were assessed by neutral single-cell microgel electrophoresis (comet assay) as described elsewhere [Citation38] with minor modifications. The slides were stained with 0.25 µM YOYO-1 (Invitrogen Corporation, Grand Island, NY, USA) in 2.5% DMSO and 0.5% sucrose (CAS registry number 57–50-1) mounted with a coverslip and digital comet images were immediately captured with an Olympus BX61 fluorescence microscope equipped with a DP72 CCD camera and Olympus CellF software. The CCD capture conditions were: exposure time 100 ms, magnification 400. Images were saved as TIFF files. At least 100 comets were measured per each sample triplicate using Comet Assay Software Project (CASP), v.1.2.2, http://www.casp.of.pl. The percentage of tail DNA was used as a parameter of DNA damage. The quality of spheroplast procedure was checked under the microscope; a suspension of 5 µl of yeast cells in one drop of 2% SDS on the slide was analysed. The percentage of yeast cells that were correctly permeabilised was determined as 99.5 ± 0.5%.
Array-based comparative genomic hybridisation (a-CGH)
Genomic DNA (0.5 μg) was labelled with SureTag DNA Labeling Kit and either Cy3- or Cy5-dUTP. Equal amounts of labelled DNA of tested and of the reference strain (BY4741) were combined and hybridised to Yeast (V2) Gene Expression Microarray, 8x15K using Oligo aCGH Hybridization Kit. All components were supplied by Agilent Technologies Inc. (Santa Clara, CA, USA) and all steps of the experiment were performed according to the manufacturer’s protocols. Following hybridisation and washing, the slides were scanned using Axon GenePix 4000B. Feature extraction was conducted using GenePix Pro 6.1 and normalisation using Acuity 4.0 (Molecular Devices, Sunnyvale, CA, USA). CGH profiles with superimposed piecewise regression plots to highlight aneuploidies were generated using CGH-Explorer v3.2 [Citation39]. The original CGH profiles obtained after the comparison of analysed strains to BY4741 gave consistently high noise due most probably to genomic DNA sequence differences between BY4741 and the bud1Δ strains, which influenced the hybridisation strength of individual probes. Therefore, to obtain final CGH profiles, the data for each strain were compared to the average of all strains used in the experiment.
Gene analysis after array-CGH
The analysis of over-representation of functional categories was performed using Cytoscape v. 2.8.2 with BiNGO v. 2.44 plug-in and hypergeometric test using Benjamini and Hochberg False Discovery Rate (FDR) correction and significance level of 0.05.
rDNA analyses
rDNA was detected with rDNA specific probe and fluorescence in situ hybridisation (FISH) using whole chromosome XII painting probe. Biotin-labelled chromosome XII-specific DNA was detected using Star*FISH_ Biotin Painting Kit – FITC Label (Cambio, UK) as described elsewhere [Citation40] . To analyse the nucleolar rDNA content, ImageJ software http://rsbweb.nih.gov/ij/was used.
Nucleolus morphology
To visualise the nucleolus, silver staining of nucleolar organiser regions (AgNOR) was performed. Silver staining of nucleolar argyrophilic proteins was conducted according to [Citation41]. A total of 100 cells were analysed and their nucleolus morphological type was determined (unaffected or fragmented nucleolus) %.
Yeast polysome profile analysis
Yeast polysome profile was determined with the use of the previously described method [Citation42,Citation43]. Briefly, yeast cells were cultured to OD600 0.4–0.6 in YPD or appropriate minimal medium and treated with cycloheximide (Sigma-Aldrich) to the final concentration of 100 μg/ml for 20 min for preservation of polysomes. Afterwards, ice was added to the culture, and cells were harvested by centrifugation for 2 min at 8,000 rpm at 4°C in a JLA-16.250 rotor (Beckman Coulter). Pellet of cells was resuspended in 10 ml of ice-cold lysis buffer [10 mM Tris-HCl pH 7.5, 100 mM NaCl, 30 mM MgCl2, 100 μg/ml cycloheximide, 1 mM PMSF, 6 mM β-Me, 1 nM pepstatin A, 10 nM leupeptin, 10 ng/ml aprotinin, 200 μg/ml heparin and RNase inhibitor (Sigma-Aldrich)], and cells were harvested by centrifugation for 3 min at 4500 rpm at 4°C in a SX4250 rotor (Beckman Coulter). The cells were subsequently resuspended in 0.5 ml of lysis buffer and added to 0.5 ml of chilled acid-washed glass beads (diameter 425–600 μm, Sigma-Aldrich) and disrupted by vigorous shaking on a vortex mixer eight times for 45 s with 1 min cooling on ice. The cell lysate was clarified by centrifugation at 12,000 rpm for 10 min at 4°C in a 12,154-H rotor (Sigma-Aldrich), and 12 OD260 units of cell extract were loaded on a 7–47% sucrose gradient [prepared in 50 mM Tris-acetate (pH 7.0), 12 mM MgCl2, 50mM NH4Cl and 1mM dithiothreitol] and centrifuged for 4.5 h at 26,500 rpm at 4°C in a SW 32 Ti rotor (Beckman Coulter). Absorbance at 254 nm was detected along sucrose gradient using density gradient fractionation system (Brandel) and polysome profile was obtained.
Phenotypic analysis – spot test for sensitivity to congo red, calcofluor white and MMS
Yeast cultures were grown to exponential phase (OD600 between 0.8 and 1) and serially diluted to different cellular concentrations as indicated. Five microliters of each cell suspension were spotted onto agar plates containing various concentrations of Congo red (Sigma-Aldrich), Calcofluor White (Sigma-Aldrich), MMS (Sigma-Aldrich) and sodium chloride. Growth was registered 48 h after incubation at 30°C. All phenotypes described in this work were confirmed by multiple tests.
Statistical analysis
The results represent the mean ± SD values for all cells tested in two independent experiments (90 cells). The differences between the wild type, the isogenic mutant strains lcl1Δ, lcl2Δ and bud1Δ (rho+ and rho°) compared to their clonal progeny were estimated using the one-way ANOVA and Dunnett’s post-hoc test. The values were considered significant if p < 0.05. Statistical analysis was performed using the Statistica 10 software or GraphPad Prism 5.
Results
In the course of studies on longevity, we used the lcl1Δ, lcl2Δ and bud1Δ mutants in the BY4741 genetic background. The lcl1Δ and lcl2Δ mutants have been shown to have an extended chronological lifespan [Citation44], while bud1Δ, which has mutation in Ras-like GTPase, is required for the first stage of budding [Citation45], and it was shown that the mutants exhibit a decrease in the budding lifespans [Citation46]. Initially, we analysed the budding lifespan of these mutants. During the analysis, we separated the daughters originated from an old mother (several from each strain; ); in this report we call them clones. The experimental set-up is shown in Supplementary data 1. Next, we confirmed that all of the isolated clones had mitochondrial dysfunctions. Using protocols with DAPI stain, we verified that all clones displayed a loss of mtDNA (). As a positive control, we generated the rho° lcl1Δ, lcl2Δ, bud1Δ and BY4741 (wild-type) strains by using ethidium bromide treatment. Then we analysed the budding lifespans of all of the obtained clones and the rho° mutants as control. As seen in Figure 2, deletion of the LCL1, LCL2 and BUD1 genes had no significant effect on the budding lifespan. In turn, in the case of the BY4741rho0 and bud1Δrho0 strains, a significant increase in the parameter (p < 0.001) was observed compared to the rho+ strains. Lack of mtDNA in lcl1Δ did not affect the budding lifespan which decreased dramatically in lcl2Δ (p > 0.001). Daughters from the old mother (clones) had different budding lifespans within the strain compared to the rho°Control. As seen in ), wild-type clones had no significantly different budding lifespans. In the case of lcl1Δ and bud1Δ most of the analysed clones had significantly lower budding lifespans (p < 0.001); only in the case of bud1_clone 2 the decrease in budding lifespan was less prominent, although statistically significant (p < 0.05). It is worth noting that not all cells (of most of the clones within the lcl1Δ, lcl2Δ and bud1Δ strains) had the capacity to start the cell cycle. This seems to be unrelated to the loss of mtDNA, but it probably might be linked to disorders affecting genome DNA replication and related processes.
Figure 1. DAPI staining of BY4741 (rho+) and BY4741 (rho°) budding yeast cells. Yeast strains rho+ (a) and rho° (b) were observed under DAPI staining (top panel) and DIC (bottom panel). The white arrows indicate nucleolar DNA and the red arrows indicate mitochondrial DNA. The figure presents representative photographs for rho+ and rho° (1000× magnification)
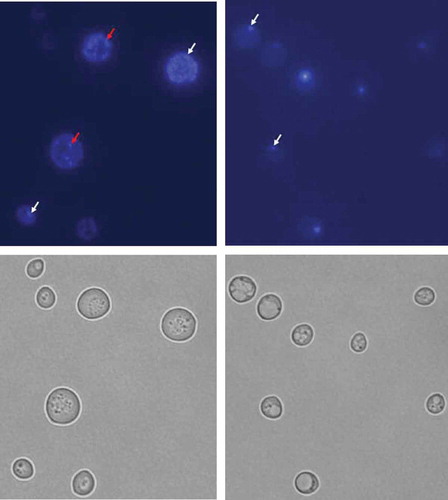
Figure 2. Comparison of the budding lifespan (a) and the total lifespan (b) of the haploid wild-type yeast strain BY4741, isogenic mutant strains lcl1Δ, lcl2Δ and bud1Δ (rho+ and rho°) and clones generates as daughters of an old mother. The values in parentheses are the mean values (for total 80 cells from two independent experiments) of the budding lifespan (a) and the total lifespan (b). Statistical significance was assessed using ANOVA and the Dunnett’s post-hoc test (*<0,01**p < 0.05, ***p < 0.001)
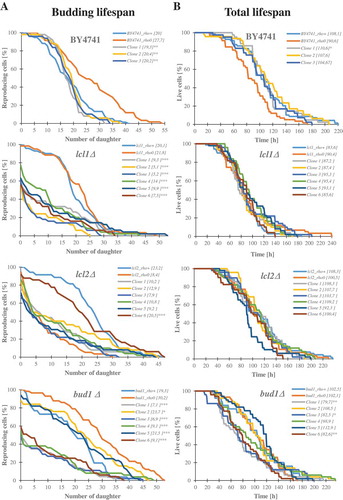
In a general view of the budding lifespan (replicative lifespan), the number of daughters produced by the mother cell during its life is regarded as a determinant of aging. In this paper, we show the age of all analysed strains expressed in units of time. The total lifespan is measured as a function of the time that elapses during reproduction and post-reproduction. Although the budding lifespan analysis did reveal significant differences between daughters from the old mother and the control rho° strain, no significant differences between strains were noted in the total lifespan. Only the bud1Δ clones 1,3 and 6 displayed a statistically significant decrease in the total lifespan (), S2).
Because most of the strains did not reveal differences in total lifespans, we calculated the reproductive and post-reproductive lifespans. The reproductive lifespan is defined as the time that elapses between the cell’s birth and its loss of budding capability. That time is closely correlated with the budding lifespan; therefore, as seen in Fig. S2, clones with significantly changed budding lifespan had statistically significant reproductive lifespans. In turn, the post-reproductive lifespan is defined as the time between the last budding and cell death. Our data show that post reproductive lifespan is strongly extended when the duration of the reproductive phase is short. These data suggest that drawing conclusions from the analysis of the budding lifespan only may be misleading. For the purpose of summarising the aging analysis, we also collected all data concerning the strains in question (). ) shows that the time of life (total lifespan) of the strains and clones is much more stable than the budding lifespan value. The value of the trend line shows a weak correlation as the Pearson correlation coefficient equals 0.3. In turn, ) presents the data on post-reproductive lifespans of all strains and clones. It appears that the negative correlation between post-reproductive lifespan and budding lifespan is evident. The trend line suggests a moderate negative correlation between these parameters. The value of the correlation coefficient is −0.68. In )
Figure 3. Scatter plots present relationship between: the mean number of daughters (budding lifespan) and the mean lengths of the total lifespan (a), the mean number of daughters (budding lifespan) and post-reproductive lifespan (b), reproductive lifespan and post-reproductive lifespan (c). Each dot represents strains or clones
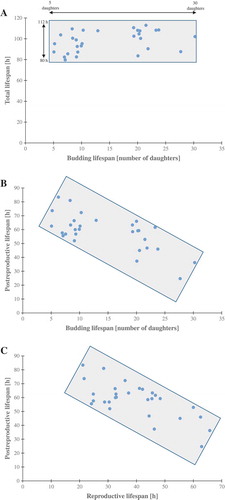
we also show the relationship between reproductive lifespan and post-reproductive lifespan in the scatter plot diagram. The value of the correlation coefficient is −0.7, suggesting a strong negative correlation between those two lifespans.
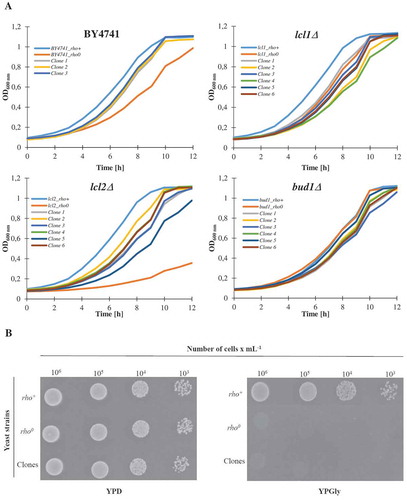
Subsequently, we analysed the growth kinetics. As seen in , almost all of the analysed rho° strains (except bud1Δrho0) and clones had a decreased growth rate compared to rho+; the differences were most prominent within lcl2Δ. As shown in the studies, almost all of the control rho° strains exhibit extended doubling times in comparison to the rho+ strain. The extended doubling time is probably a result of the loss of mtDNA. In turn, ) is presented as spotted test (on glucose and glycerol) to show the growth rate representative for rho+ and rho°. Clones and rho° have no oxygen respiration ability and do not grow on a non-fermentable carbon source.
Figure 4. The growth curves of the haploid wild type yeast strain BY4741, isogenic mutant strains lcl1Δ, lcl2Δ and bud1Δ (rho+ and rho0) and clones generated as daughters of an old mother. Graphic representation of cell growth in rich YPD (Yeast extract, Peptone, Dextrose) medium (a). Growth of mutant yeast strains on various carbon sources. Yeast cells were spotted onto agar plates with YP medium supplemented with dextrose and glycerol; growth was continued for 3 days (b). The presented data are replicates from two independent cultures ± SEM where these are larger than the symbol dimensions. The data for each condition are representative of at least two independent experiments performed on different days
Having analysed the aging parameters and the growth rate of the separated clones, we
turned our attention to the genome and the issues related to the translational apparatus that might have affected the observed growth perturbations. We analysed genome instability at the karyotypes (whole chromosomes) level, genomic DNA double strand breaks, genomic changes in gene dosage, rDNA stability as well as performance of the translational apparatus using polysome profiling.
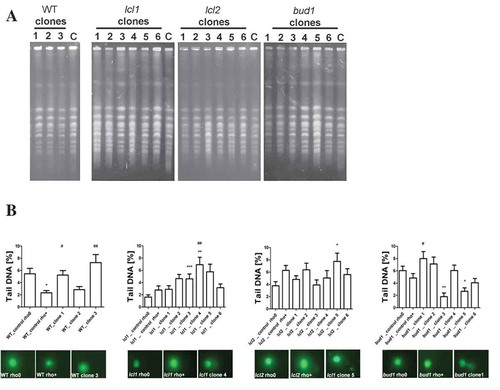
First, we focused on the karyotype analysis using PFGE separation; the obtained data suggested that decreases in the growth rate and the budding lifespan were not associated with large chromosome aberrations and karyotype pattern changes (. Next, we analysed the DNA breaks with the use of a standard comet assay method. As seen in ), most of the DNA damage occurs in the lcl1Δ and bud1Δ clones, with less damage in the wild-type strains and the lcl2Δ mutant. Thus, we may conclude that a small but significant amount of DNA breaks is accumulated in the analysed clones.
Figure 5. Evaluation of genomic instability at the karyotype level (a) and DNA double-strand breaks level (b) A. Electrophoretic karyotyping (PFGE separation) of haploid wild-type yeast strain BY4741, isogenic mutant strains lcl1Δ, lcl2Δ and bud1Δ (rho+ and rho°) and clones generated as daughters of an old mother. B. DNA double-strand breaks (DSBs) assessment was performed using neutral comet assay. As a DNA damage marker, the %tail DNA was used. The bars indicate SEM, n = 100, *p < 0.05, **p < 0.01, ***p < 0.001 compared to the rho+ strain, #p < 0.05, ##p < 0.01, ###p < 0.001 compared to the rho° strain (ANOVA and Dunnett’s a posteriori test). The typical micrographs are shown (bottom). DNA was visualised using YOYO-1 staining (green)
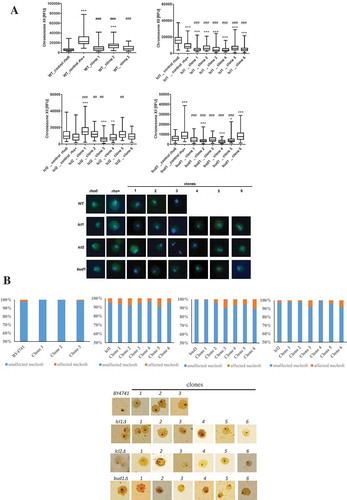
We then addressed the rDNA stability in the analysed strains, as it is important for the growth rate. In the Saccharomyces cerevisiae yeast chromosome XII contains the rDNA locus [Citation47,Citation48], and rDNA was proposed to be the one of most unstable regions in yeast genome[Citation12]. Nearly all of the analysed clones showed statistically significant changes in the chromosome XII level (p < 0.001) (. Thus, our data suggest that there is a correlation between DNA breaks and the chromosome XII level, mainly in the wild-type, lcl1Δ and bud1Δ strains. In general, the analysed clones (daughters of old mothers) are more susceptible to a double strand DNA break, and that break is in turn dependent on the rDNA level. Additionally, we were also interested in correlating the differences in the budding lifespan with changes in nucleolus architecture, shape and size, which reflects the transcriptional potential of rRNA and biogenesis of translational apparatus; therefore, we used silver staining of the nucleolar proteins associated with rDNA. Two main types of nucleolus morphology were revealed: normal and fragmented. As seen in ), nucleolus fragmentation (%) was observed in all analysed mutant clones (lcl1Δ, lcl2Δ, bud1Δ except the wild-type clones). The most significant fragmentation was observed within the bud1Δ clones 3 and 6 (10 and 11%, respectively). In the case of the lcl2Δ clones, we observed the most significant nucleolus fragmentation in clones 3 and 6. Interestingly, within lcl1Δ (control and clones) the fragmentation was at about 5%; only for clones 2 and 5 was it 8% and 9%, respectively. Since nucleolus represent the main site of ribosome biogenesis, we may conclude that in analysed clones the perturbations within translational apparatus may take place. Our data may therefore suggest that there is a relationship between the budding lifespan and the rDNA level and DNA damage.
Figure 6. Evaluation of lifespan-mediated changes in nucleolus in haploid wild-type yeast strain BY4741, isogenic mutant strains lcl1Δ, lcl2Δ and bud1Δ (rho+ and rho°) and clones generated as daughters of an old mother. (a) Analysis of rDNA content. rDNA was visualised using WCPP specific to chromosome XII that contains rDNA locus in yeast. Fluorescence signals of chromosome XII were quantified using the ImageJ software. The integrated fluorescence density is presented in relative fluorescence units (RFUs). Box-and-whisker plots are shown, n = 100. The typical micrographs are shown (bottom). *p < 0.05, **p < 0.01, ***p < 0.001compared to the rho+ strain, #p < 0.05, ##p < 0.01, ###p < 0.001 compared to the rho° strain (ANOVA and Dunnett’s a posteriori test). The cells were labelled with FITC to detect chromosome XII-specific signals (green). DNA was visualised using DAPI staining (blue). (b) Silver staining of nucleolar organiser region-based analysis of nucleolus fragmentation. Fragmented nucleoli were scored (%). The typical micrographs are also shown (bottom)
Next, we analysed the polysome profile, which represents a powerful approach to characterising steady-state status of translational machinery. The relationship between individual fractions, including 40S, 60S, 80S and polysomes may bring insight into several metabolic events such as biogenesis, initiation, elongation and termination within translational machinery. In our analysis, we used two control strains: wild-type BY4741 and mutant strain BY4741rho0 (). The profile for BY4741 reflects a typical shape of ribosomal fractions found in the wild-type yeast strain, with well-marked 40S, 60S, 80S and polysomes. BY4741rho0 showed perturbations within the polysome profile; first of all the 60S fraction dominate, indicating accumulation of free 60S ribosomal subunit, and there is substantial reduction of the 80S monosomes. In the case of the analysed mutants lcl1Δ, lcl2Δ and bud1Δ in the genetic background of wild-type BY4741, polysome profiles reflected the wild-type one; on the other hand, the lcl1Δ and bud1Δ mutants showed the same profile in comparison to the isogenic strain BY4741rho0 (, S3). The lcl2Δ mutant in BY4741rho0 genetic background is a separate case as it displays a wild-type polysome profile indicating that the lcl2Δ mutation positively complements the translational defect found in the BY4741rho0 yeast strain. Our polysome profile data indicate that in BY4741rho0 strain and in lcl1Δ and bud1Δ clones there is 60S accumulation indicating biogenesis defect; the observation is in line with the nucleolus morphology approach.
Figure 7. Polysome profile analyses using equal numbers of cells. The positions of individual ribosomal subunits are indicated in all graphs. More details about the polysome profile are available on supplementary data 3
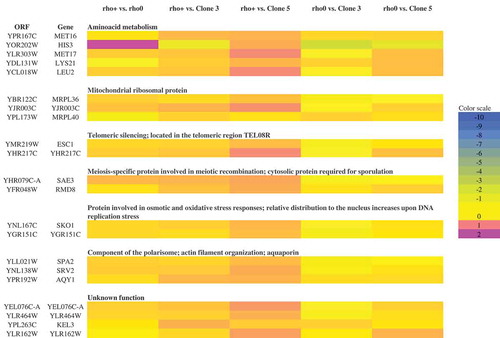
To further characterise the chromosome status in analysed mutant strains, an array-based CGH analysis was conducted (). There, we focused on few representative clones (bud1Δrho0, bud1Δrho+, clone 3 and clone 5). Our data showed no gross variations in the number of chromosomes of strains. Data from the aCGH method suggested that there is also no significant aneuploidy. Additionally, the data confirmed that the clones are devoid of mtDNA (rho°). What is interesting is the under-representation of ends of all chromosomes in rho°Cells compared to rho+ cells (LogRatio around −0.1). However, it must be emphasised that these changes are rather insignificant. Using the aCGH method we checked whether during aging the mother cells transfer the modified gene dosage to their daughters. The heat map presented in shows that changes in gene dosage are related to the loss of mtDNA; however, we may also note changes in gene dosage between rho+ and clones 3 and 5. The most significant variations are related to metabolism of amino acids, mainly methionine, histidine, lysine and leucine. These changes occur in genes MET16, MET17, HIS3, LYS21, LEU2. We also showed that the changes affect proteins involved in the structure of mitochondrial ribosomes whose genes are located in the nuclear genome (MRPL36, MRPL40, YJR003C). Other changes in gene dosage are related to silencing of telomeres (ESC1, YHR217C), oxidative stress and osmotic stress (SKO1, YGR151C), meiosis-specific protein (SAE3, RMD8), as well as genes involved in the structure of the polarisome, aquaporins or actin filaments (SPA2, SRV2, AQY1). Furthermore, we demonstrated the modified dosage of four genes of a so far unknown biological function (YEL076C-A, YLR464W, KEL3, YLR162W). The aCGH analysis also revealed that cells devoid of functional genes that are responsible for cell cytokinesis polarisation during mitosis (bud1Δ) demonstrate an increased susceptibility to heteroplasmy.
Figure 8. Analysis of the variability in the gene copy number of strains bud1Δ rho+, rho° and two clones 3 and 5 using array CGH. Each gray dot represents the value of the log2 ratio for an individual gene. Blue lines were provided to emphasise the most accented differences (DNA losses and gains)
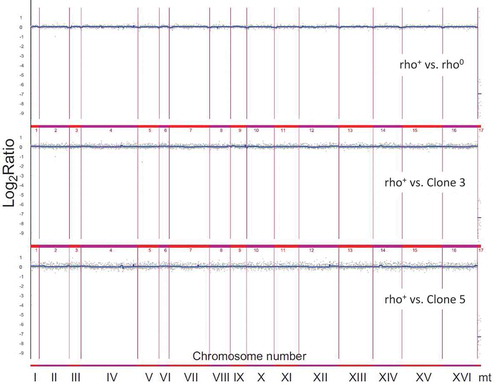
Figure 9. A heat map generated from array-CGH data. Functional categories overrepresented in the group of genes (according to their functional assignment) that were the most divergent among analysed strains are shown
Finally, we analysed sensitivity to Congo red (CR), Calcofluor White (CW), MMS, H2O2 and cycloheximide in all strains and clones (Fig. S4). Our data show that none of the analysed strains (rho+) were sensitive to CR, NaCl, MMS and cycloheximide. In turn, BY4741rho0 and lcl2Δrho0 were more sensitive to H2O2 than other strains. Calcofluor White had the greatest impact. The lcl1Δrho+ and lcl1Δrho0 strains and clones were found to be more resistant to CW.
Discussion
Aging is a multifactorial phenomenon defined as an age-specific increase in mortality, which means that old cells are more likely to die than young cells [Citation31]. Aging is considered to be caused by accumulation of aging factors [Citation10]. However, we still lack a clear answer to the question: What is the main factor determining longevity? In yeast, aging studies are additionally complicated by problems with defining the organism’s age. It is considered that the number of daughters produced by a single mother cell may determine longevity, although it should be considered the unit of fertility rather than lifetime. Therefore, using time units to define yeast aging may affect final conclusions. Our previous data suggest that appropriate definition of yeast lifetime units is key to understanding the mechanisms leading to an extended lifespan [Citation21,Citation35,Citation49,Citation50]. In a majority of reports, the authors use young mother cells or derived young daughter cells; however, hardly anyone analysed the longevity phenomenon in the daughter cells formed from old mother cells. Thus, in our study we used the clones formed as daughters from an old mother (mother cell after 20 cell cycles). For the purpose of the analysis, we used three mutant yeast strains, namely lcl1Δ, lcl2Δ and bud1Δ in the BY4741 genetic background. It should be underlined that none of the used strains changed the budding lifespan or longevity compared to wild-type, which is an important finding for our comparative analyses to study the clones of daughter cells.
In 1994, Kennedy et al. showed that daughters from an old mother had decreased budding lifespans that might be regarded as reproductive potentials [Citation9]. Our initial analyses supported this observation, showing that in our experimental set-up the clones of daughter cells displayed reduced budding lifespan, indeed. However, in the case of some clones, the budding lifespan was the same as in the wild-type strains, which suggests that the decrease in the aging parameters in the case of daughters from an old mother is not a general phenomenon. It is well known that during yeast aging a sequence of changes occurs, e.g. impairment of oxygen respiration. Our data suggest that daughters from old mother cells lack mtDNA (rho° cells), which is consistent with the previous findings [Citation29]. Many studies suggest that mitochondria are associated with the aging process. Also, the slow growth rate in the analysed rho° mutants and clones in those studies is associated with loss of mtDNA and formation of petite phenotype of yeast cells. The observation that some old mother cells form rho° daughter cells suggests that either old cells lose their mtDNA and therefore cannot pass mitochondria containing DNA to their daughters, or that the DNA-containing mitochondria are retained in the old mother cell [Citation31]. But the latter statement contradicts the asymmetric division of the aging factor between mothers and daughters [Citation10] because mother cells accumulating mitochondria fail to produce rejuvenated daughter cells [Citation51,Citation52]. Alternatively, mother cells lost their mtDNA during previous cell cycles. Despite many years of yeast aging studies, little is known about the stability and partitioning of mtDNA in old yeast cells or why some strains are more defective in proper mtDNA segregation compared to others [Citation53]. Lack of mtDNA in young cells may influence the budding lifespan in different ways compared to the rho+ strain. In this paper, we show that in the case of wild-typerho0 and bud1Δrho0 this leads to a significantly increased budding lifespan, and in the case of lcl2Δrho0 to a dramatic decrease in that parameter. It is worth noting that the analysis of the influence of loss of mitochondrial DNA (rho°) on the budding lifespan in four different backgrounds showed that in two cases the lifespan was shortened, in one case there was no impact, and in the last case the lifespan was extended [Citation54]. In the budding yeast Saccharomyces cerevisiae, loss of mtDNA (rho°) can induce a retrograde response under appropriate conditions, resulting in increased budding lifespan [Citation55]. Activation of the retrograde response in rho° cells extends the budding lifespan [Citation54]. One of the mechanisms inducing the retrograde response is loss of the mitochondrial membrane potential (MMP). Previous studies suggest that lowering of MMP has been shown to increase budding lifespan in yeast [Citation56]. However, recent data suggest that in addition to the MMP there are other signals generated by mitochondria that impinge on the retrograde response and affect budding lifespan [Citation57]. However, the relevance that retrograde response is important in determination budding lifespan has been difficult to determine because deletion of mitochondrial DNA increases number of produces daughter only in few analysed strains in which it has been studied [Citation54,Citation57,Citation58]. Moreover, it has been reported that respiration-deficient cells experience shorter budding lifespan [Citation57]. Therefore, respiratory function is not critical, but certain mitochondrial activities are necessary for some strains or interfering with mitochondrial functions can cause toxicity which leads to an abnormally short budding lifespan, e.g. lcl2Δrho0. In respiratory deficient yeast calorie restriction may also lead to an increased budding lifespan [Citation58]. Interestingly, mtDNA has a higher mutation frequency rate than nuclear DNA [Citation59], while mutation in mtDNA decreases the budding lifespan [Citation60] and the loss of mitochondrial DNA does not limit the budding lifespan in some wild-type yeast strains [Citation14,Citation58].
Despite varied data on the impact of the loss of mtDNA on yeast aging, it is important to note that functional mitochondria have a key role in maintaining nuclear genome stability [Citation61]. Our data suggest that loss of mtDNA and the resulting mitochondrial dysfunction have certain impact on gene dosage in the cell nucleus. Furthermore, as shown in our detailed results obtained through the use of the aCGH method, the increase in gene dosage results in prolonging the budding lifespan of the control rho° strain but has no impact on the total lifespan. There is, however, a connection between mitochondrial defects and changes in the rDNA amount as well as dosage of nuclear genes responsible among others for amino acid metabolism, telomere muting, or structure of ribosomes located in the mitochondrion. This may have significant impact on changes and lead to an increase in spontaneous intercellular variances in the cell population as well as diversification of cell lifetime and budding lifespan. A more detailed description of that mechanism is presented in the review paper [Citation61].
The budding lifespan represents only part of the yeast cell’s life because the cell does not die after the last budding. The time between the last budding and cell death is defined as post-reproductive lifespan, and the sum of the time that elapses during reproductive and post-reproductive phases is called total lifespan. Some wild-type strains and mutants are able to modulate duration of these two phases [Citation21,Citation49,Citation50,Citation62]. In our study, most of the analysed strains and clones did not change their total lifespans. The data suggest that in optimum conditions (rich medium and appropriate temperature) cells have a clearly defined time of life. Most of the clones analysed in our study had lowered budding and reproductive lifespans. We noted therefore that the short reproduction time was compensated by a significant extension of the post-reproductive lifespan. Our research confirms the earlier data that the extension of budding lifespan leads to shortening of post-reproductive lifespan. Similarly, extension of reproductive lifespan leads to shortening of post-reproductive lifespan. Yet despite substantial changes in the budding lifespan no change in longevity (total lifespan) occurred, which may challenge our understanding of yeast aging and the approaches to measurement of longevity. These data support the previous data showing that in many mutants there was no change in the total lifespan despite changes in the budding lifespan [Citation19,Citation21,Citation49]. Moreover, yeast produce sensu stricto longevity mutants [Citation19,Citation49], and it has been observed that growth conditions, such as lower growth temperature, can lead to yeast longevity [Citation50].
A lot of effort has been put into searching for factors responsible for aging. It is essential to understand molecular mechanisms of aging. Recently, nucleolus and ribosome linkage to aging has often been discussed. The nucleolus, which is called a ribosome factory, acts as a guardian of cellular homeostasis and genome integrity [Citation63]. The nucleolus is also involved in regulation of both the budding lifespan [Citation64,Citation65] and chronological aging [Citation41]. We wanted to determine whether nucleolus morphology and ribosomal profile were affected in daughters of old mothers. To strengthen our results, all of the analysed strains and clones were used. We found a certain percentage of clone cells with nucleolus fragmentation but with no correlation between those changes and the budding lifespan or longevity. Interestingly, previous data suggested chronological aging-mediated nucleolus fragmentation [Citation41].
It is clear that changes in the translational machinery may influence the budding lifespan [Citation66] and longevity [Citation19]. Here, we shed new light on the study of the effect of changes in the 60S ribosomal subunit level on the budding lifespan. Previous relevant data suggested that yeast budding lifespan was extended by a specific reduction in the 60S ribosomal subunit level [Citation66]. In the present study, the opposite was observed: an increase in the 60S ribosomal subunit caused a significant increase in the budding lifespan of the wild-type, lcl1Δ and bud1Δ cells with lack of mtDNA. Presumably, the 60S ribosomal level is also not crucial in determining yeast aging parameters as suggested previously. Possible explanation for the phenomenon is that in the BY4741rho0 strain reduction of the 80S monosomes might be attributed to perturbations in the regulatory short-lived mRNA translation, as the monosomes are recognised as key contributors to the overall cellular regulatory translatome. Thus, monosomes were found to be mainly engaged in translation of short open-reading-frames (ORF) or mRNA with regulatory upstream ORFs, which are associated with low-abundance regulatory proteins. Therefore, it seems likely that the BY4741rho0 strain has a restricted ability to form the 80S monosomes and the lcl2Δ mutation restores translational potential of monosomes. In turn, Motizuki and Tsurugi studies show that in yeast protein synthesis level decreases with age. In old cells, the incorporation rate was half the rate demonstrated by young cells while the ribosome amount was elevated. This implies an age-related decline in protein synthesis [Citation67].
ERCs were proposed as the first senescence factor. Numerous studies were conducted to explain the mechanisms of formation and segregation between the mother and the daughter cells [Citation11,Citation68–Citation70]. Despite numerous studies, the role of ERCs in determining the budding lifespan of yeast cells is not obvious [Citation53,Citation68,Citation71,Citation72]. Cells undergo cumulative damage to chromosomes, most likely focused on rDNA [Citation73]. It seems that rDNA may be the cell’s Achilles’ heel because it comprises a potentially unstable array of tandemly repeated DNA sequences [Citation64]. Recently, a rDNA theory of aging has been subject to a heated debate [Citation12,Citation74,Citation75]. T. Kobayashi has suggested that rDNA may be more susceptible to damage than other DNA regions. It is in line with the postulated hypothesis that shifts in rDNA levels act as a genome buffer promoting chromosome homeostasis [Citation38]. Therefore, we addressed the question of whether rDNA level may affect budding lifespan and longevity in the analysed clones. In fact, we found significant changes at the rDNA (chromosome XII) level. This observation may to some extent explain the decreased budding lifespan, but not for all clones. More recent data obtained with the use of sgs1Δ and rad52Δ show that a decreased budding lifespan is independent of the level of ERCs [Citation76]. Additionally, our previous data suggest that decrease in the ERCs level by deletion of the FOB1 gene leads to a significant increase in the budding lifespan but not the total lifespan [Citation19,Citation21,Citation49].
Failla and Szilard evidenced that random somatic mutations cause cell dysfunctions which lead to aging [Citation77,Citation78]. Another study suggests that dysfunction of the protein involved in repairing the DNA damage leads to mutation accumulation and aging [Citation79,Citation80]. In turn, more recent data suggest that in the case of Saccharomyces cerevisiae mutation accumulation does not cause changes in the budding lifespan [Citation81]. Moreover, Kaya et al. (2015) also suggest that during yeast aging no structural genome rearrangements occur in yeast cells [Citation81]. In our study, we confirm that observation although other data offer contradictory conclusions [Citation82]. Kaya et al. suggest a possibility that structural rearrangements are associated with methodological approaches. As the main factor (albeit highly unlikely), they propose the selection that occurs during expansion of the colony of daughters coming from old mothers, which may eliminate rearrangements [Citation81].
To conclude, we show for the first time that daughters from an old mother have reset lifespans expressed in units of time despite drastic reduction of their budding lifespans. Interestingly, a broad molecular analysis does not offer unequivocal answers about the mechanism of aging. It seems that ERCs and DNA damage cannot be the main factors determining aging, as assumed earlier. Our data also show that the increase in the 60S ribosomal subunit level, which may be connected to perturbation in the biogenesis of translational machinery, extends the budding lifespan in non-respiring strains, adds a new meaning to the putative role of ribosomes in aging. We suggest that accumulation of damage, including lack of mitochondrial DNA, had a significant role in determining the budding lifespans of the analysed clones, probably by gene dosage and nuclear genome stability. Moreover, we show that old yeast mother cells do indeed transmit damage (e.g. mitochondrial damage) to daughters, but these daughters have their total lifespans reset. It seems that further data are needed before attempts at discovering the secret of longevity may be undertaken.
Summarising our data, we postulate that none of the yeast aging mechanisms proposed so far is unequivocally involved in determining budding lifespan. Additionally, we think that this is clearly a multifactorial and stochastic process. Therefore, although all of the factors proposed and analysed above may influence aging, it is probable that no single mechanism is either necessary or sufficient to promote yeast aging.
Authors’ contributions
Conceived and designed the experiments: MM. Performed the experiments: MM, AP, EM, MW, MS. Analysed the data: MM, MW, MS, MT. Contributed reagents/materials/analysis tools: MW, MT, MM. Wrote the paper: MM.
Supplemental Material
Download Zip (1.9 MB)Disclosure statement
No potential conflict of interest was reported by the authors.
Supplementary material
Supplementary data for this article can be accessed here.
Additional information
Funding
Related Research Data
References
- Kirkwood TBL, Austad SN. Why do we age? Nature. 2000;408:233–238.
- Fabrizio P, Longo VD. The chronological life span of Saccharomyces cerevisiae. Aging Cell. 2003;2:73–81.
- MacLean M, Harris N, Piper PW. Chronological lifespan of stationary phase yeast cells; a model for investigating the factors that might influence the ageing of postmitotic tissues in higher organisms. Yeast. 2001;18:499–509.
- Lefevre SD, Kumar S. van der Klei IJ. Inhibition of peroxisome fission, but not mitochondrial fission, increases yeast chronological lifespan. Cell Cycle. 2015;14:1698–1703.
- Longo VD, Shadel GS, Kaeberlein M, et al. Replicative and Chronological Aging in Saccharomyces cerevisiae. Cell Metabolism. 2012;16:18–31.
- Arlia-Ciommo A, Piano A, Leonov A, et al. Quasi-programmed aging of budding yeast: a trade-off between programmed processes of cell proliferation, differentiation, stress response, survival and death defines yeast lifespan. Cell Cycle. 2014;13:3336–3349.
- Molon M, Woznicka O, Zebrowski J. Cell wall biosynthesis impairment affects the budding lifespan of the Saccharomyces cerevisiae yeast. Biogerontology. 2018;19:67–79.
- Mortimer RK, Johnston JR. LIFE SPAN OF INDIVIDUAL YEAST CELLS. Nature. 1959;183:1751–1752.
- Kennedy BK, Austriaco NR, Guarente L. DAUGHTER CELLS OF SACCHAROMYCES-CEREVISIAE FROM OLD MOTHERS DISPLAY A REDUCED LIFE-SPAN. J Biol. 1994;127:1985–1993.
- Henderson KA, Gottschling DE. A mother’s sacrifice: what is she keeping for herself? Curr Opin Cell Biol. 2008;20:723–728.
- Sinclair DA, Guarente L. Extrachromosomal rDNA circles - A cause of aging in yeast. Cell. 1997;91:1033–1042.
- Kobayashi T. A new role of the rDNA and nucleolus in the nucleus-rDNA instability maintains genome integrity. Bioessays. 2008;30:267–272.
- Aguilaniu H, Gustafsson L, Rigoulet M, et al. Asymmetric inheritance of oxidatively damaged proteins during cytokinesis. Science. 2003;299:1751–1753.
- Woo DK, Poyton RO. The absence of a mitochondrial genome in rho(0) yeast cells extends lifespan independently of retrograde regulation. Exp Gerontol. 2009;44:390–397.
- Bilinski T, Bartosz G. Hypothesis: cell volume limits cell divisions. Acta Biochimica Polonica. 2006;53:833–835.
- Bilinski T, Zadrag-Tecza R, Bartosz G. Hypertrophy hypothesis as an alternative explanation of the phenomenon of replicative aging of yeast. FEMS Yeast Res. 2012;12:97–101.
- Barton AA. Some aspects of cell division in Saccharomyces-cerevisiae. J Gen Microbiol. 1950;4:84–86.
- Bartholomew JW, Mittwer T. Demonstration of yeast bud scars with the electron microscope. J Bacteriol. 1953;65:272–275.
- Molon M, Szajwaj M, Tchorzewski M, et al. The rate of metabolism as a factor determining longevity of the Saccharomyces cerevisiae yeast. Age. 2016;38:1–15.
- Zadrag-Tecza R, Kwolek-Mirek M, Bartosz G, et al. Cell volume as a factor limiting the replicative lifespan of the yeast Saccharomyces cerevisiae. Biogerontology. 2009;10:481–488.
- Molon M, Zadrag-Tecza R. The links between hypertrophy, reproductive potential and longevity in the Saccharomyces cerevisiae yeast. Acta Biochimica Polonica. 2016;63:329–334.
- Yang JY, Dungrawala H, Hua H, et al. Cell size and growth rate are major determinants of replicative lifespan. Cell Cycle. 2011;10:144–155.
- Egilmez NK, Jazwinski SM. EVIDENCE FOR THE INVOLVEMENT OF A CYTOPLASMIC FACTOR IN THE AGING OF THE YEAST SACCHAROMYCES-CEREVISIAE. J Bacteriol. 1989;171:37–42.
- Lee SS, Avalos Vizcarra I, Huberts D, et al. Whole lifespan microscopic observation of budding yeast aging through a microfluidic dissection platform. Proc Natl Acad Sci U S A. 2012;109:4916–4920.
- Xie ZW, Zhang Y, Zou K, et al. Molecular phenotyping of aging in single yeast cells using a novel microfluidic device. Aging Cell. 2012;11:599–606.
- Smeal T, Claus J, Kennedy B, et al. Loss of transcriptional silencing causes sterility in old mother cells of S-cerevisiae. Cell. 1996;84:633–642.
- Muller I. PARENTAL AGE AND THE LIFE-SPAN OF ZYGOTES OF SACCHAROMYCES-CEREVISIAE. Antonie Van Leeuwenhoek Journal of Microbiology. 1985;51:1–10.
- Tang FS, Watkins JW, Bermudez M, et al. A life-span extending form of autophagy employs the vacuole-vacuole fusion machinery. Autophagy. 2008;4:874–886.
- Veatch JR, McMurray MA, Nelson ZW, et al. Mitochondrial dysfunction leads to nuclear genome instability via an iron-sulfur cluster defect. Cell. 2009;137:1247–1258.
- Dang WW, Steffen KK, Perry R, et al. Histone H4 lysine 16 acetylation regulates cellular lifespan. Nature. 2009;459:802–U2.
- Lippuner AD, Julou T, Barral Y. Budding yeast as a model organism to study the effects of age. FEMS Microbiol Rev. 2014;38:300–325.
- Unal E, Kinde B, Amon A. Gametogenesis eliminates age-induced cellular damage and resets life span in yeast. Science. 2011;332:1554–1557.
- Sherman F, Fink GR, Hicks JB. Methods in yeast genetics: a laboratory manual. Plainview, NY: Cold Spring Harbor Laboratory Press; 1994.
- Baruffini E, Ferrero I, Foury F. In vivo analysis of mtDNA replication defects in yeast. Methods. 2010;51(4):426–436.
- Molon M, Zebrowski J. Phylogenetic relationship and Fourier-transform infrared spectroscopy-derived lipid determinants of lifespan parameters in the Saccharomyces cerevisiae yeast. FEMS Yeast Res. 2017;17:1–10.
- Minois N, Frajnt M, Wilson C, et al. Advances in measuring lifespan in the yeast Saccharomyces cerevisiae. Proc Natl Acad Sci U S A. 2005;102:402–406.
- Lewinska A, Miedziak B, Wnuk M. Assessment of yeast chromosome XII instability: single chromosome comet assay. Fungal Genet Biol. 2014;63:9–16.
- Azevedo F, Marques F, Fokt H, et al. Measuring oxidative DNA damage and DNA repair using the yeast comet assay. Yeast. 2011;28(1):55–61.
- Lingjaerde OC, Baumbusch LO, Liestol K, et al. CGH-Explorer: a program for analysis of array-CGH data. Bioinformatics. 2005;21:821–822.
- Wnuk M, Miedziak B, Kulak K, et al. Single-cell analysis of aneuploidy events using yeast whole chromosome painting probes (WCPPs). J Microbiol Methods. 2015;111:40–49.
- Lewinska A, Miedziak B, Kulak K, et al. Links between nucleolar activity, rDNA stability, aneuploidy and chronological aging in the yeast Saccharomyces cerevisiae. Biogerontology. 2014;15:289–316.
- Wawiorka L, Molestak E, Szajwaj M, et al. Multiplication of ribosomal P-stalk proteins contributes to the fidelity of translation. Mol Cell Biol. 2017;37.
- Warner JR, Mitra G, Schwindinger WF, et al. Saccharomyces-cerevisiae coordinates accumulation of yeast ribosomal-proteins by modulating messenger-rna splicing, translational initiation, and protein-turnover. Mol Cell Biol. 1985;5:1512–1521.
- Matecic M, Smith DL, Pan XW, et al. A microarray-based genetic screen for yeast chronological aging factors. PLoS Genet. 2010;6.
- Cabib E, Drgonova J, Drgon T. Role of small G proteins in yeast cell polarization and wall biosynthesis. Annu Rev Biochem. 1998;67:307–333.
- Clay L, Caudron F, Denoth-Lippuner A, et al. A sphingolipid-dependent diffusion barrier confines ER stress to the yeast mother cell. Elife. 2014;3.
- Petes TD. YEAST RIBOSOMAL DNA GENES ARE LOCATED ON CHROMOSOME-XII. Proc Natl Acad Sci U S A. 1979;76:410–414.
- Kim YH, Ishikawa D, Ha HP, et al. Chromosome XII context is important for rDNA function in yeast. Nucleic Acids Res. 2006;34:2914–2924.
- Molon M, Zadrag-Tecza R, Bilinski T. The longevity in the yeast Saccharomyces cerevisiae: A comparison of two approaches for assessment the lifespan. Biochem Biophys Res Commun. 2015;460:651–656.
- Molon M, Zadrag-Tecza R. Effect of temperature on replicative aging of the budding yeast Saccharomyces cerevisiae. Biogerontology. 2016;17:347–357.
- Lai CY, Jaruga E, Borghouts C, et al. A mutation in the ATP2 gene abrogates the age asymmetry between mother and daughter cells of the yeast Saccharomyces cerevisiae. Genetics. 2002;162:73–87.
- Jazwinski SM. Yeast replicative life span the mitochondrial connection. FEMS Yeast Res. 2004;5:119–125.
- Lindstrom DL, Leverich CK, Henderson KA, et al. Replicative age induces mitotic recombination in the ribosomal rna gene cluster of Saccharomyces cerevisiae. PLoS Genet. 2011;7:1–13.
- Kirchman PA, Kim S, Lai CY, et al. Interorganelle signaling is a determinant of longevity in Saccharomyces cerevisiae. Genetics. 1999;152:179–190.
- Miceli MV, Jiang JC, Tiwari A, et al. Loss of mitochondrial membrane potential triggers the retrograde response extending yeast replicative lifespan. Front Genet. 2012;102:1–11.
- Barros MH, Bandy B, Tahara EB, et al. Higher respiratory activity decreases mitochondrial reactive oxygen release and increases life span in Saccharomyces cerevisiae. J Biol Chem. 2004;279:49883–4988810.
- Kaeberlein M, Kirkland KT, Fields S, et al. Genes determining yeast replicative life span in a long-lived genetic background. Mechanism of Ageing and Development. 2005;126:491–504.
- Kaeberlein M, Hu D, Kerr EO, et al. Increased life span due to calorie restriction in respiratory-deficient yeast. PLoS Genet. 2005;1:614–621.
- Lynch M, Sung W, Morris K, et al. A genome-wide view of the spectrum of spontaneous mutations in yeast. Proc Natl Acad Sci U S A. 2008;105:9272–9277.
- Breitenbach M, Laun P, Dickinson JR, et al. The role of mitochondria in the aging processes of yeast. Aging Research in Yeast. 2012;57:55–78.
- Kaniak-Golik A, Skoneczna A. Mitochondria-nucleus network for genome stability. Free Radic Biol Med. 2015;82:73–104.
- Zadrag-Tecza R, Molon M, Mamczur J, et al. Dependence of the yeast Saccharomyces cerevisiae post-reproductive lifespan on the reproductive potential. Acta Biochimica Polonica. 2013;60:111–115.
- Grummt I. The nucleolus-guardian of cellular homeostasis and genome integrity. Chromosoma. 2013;122:487–497.
- Guarente L. Link between aging and the nucleolus. Genes Dev. 1997;11:2449–2455.
- Johnson FB, Marciniak RA, Guarente L. Telomeres, the nucleolus and aging. Curr Opin Cell Biol. 1998;10:332–338.
- Steffen KK, MacKay VL, Kerr EO, et al. Yeast life span extension by depletion of 60S ribosomal subunits is mediated by Gcn4. Cell. 2008;133:292–302.
- Motizuki M, Tsurugi K. THE EFFECT OF AGING ON PROTEIN-SYNTHESIS IN THE YEAST SACCHAROMYCES-CEREVISIAE. Mech Ageing Dev. 1992;64:235–245.
- Ganley ARD, Ide S, Saka K, et al. The effect of replication initiation on gene amplification in the rdna and its relationship to aging. Mol Cell. 2009;35:683–693.
- Ganley ARD, Kobayashi T. Highly efficient concerted evolution in the ribosomal DNA repeats: total rDNA repeat variation revealed by whole-genome shotgun sequence data. Genome Res. 2007;17:184–191.
- Shcheprova Z, Baldi S, Frei SB, et al. A mechanism for asymmetric segregation of age during yeast budding. Nature. 2008;454:728–734.
- Park PU, Defossez PA, Guarente L. Effects of mutations in DNA repair genes on formation of ribosomal DNA circles and life span in Saccharomyces cerevisiae. Mol Cell Biol. 1999;19:3848–3856.
- Poole AM, Kobayashi T, Ganley ARD. A positive role for yeast extrachromosomal rDNA circles? Bioessays. 2012;34:725–729.
- Guarente L. Do changes in chromosomes cause aging? Cell. 1996;86:9–12.
- Kobayashi T. How does genome instability affect lifespan? Genes to Cells. 2011;16:617–624.
- Saka K, Ide S, Ganley ARD, et al. Cellular senescence in yeast is regulated by rDNA noncoding transcription. Curr Biol. 2013;23:1794–1798.
- Zadrag-Tecza R, Skoneczna A. Reproductive potential and instability of the rDNA region of the Saccharomyces cerevisiae yeast: common or separate mechanisms of regulation? Exp Gerontol. 2016;84:29–39.
- Failla G. THE AGING PROCESS AND CANCEROGENESIS. Ann N Y Acad Sci. 1958;71:1124–1140.
- Szilard L. ON THE NATURE OF THE AGING PROCESS. Proc Natl Acad Sci U S A. 1959;45:30–45.
- Andressoo JO, Hoeijmakers JHJ, Mitchell JR. Nucleotide excision repair disorders and the balance between cancer and aging. Cell Cycle. 2006;5:2886–2888.
- Gorbunova V, Seluanov A, Mao Z, et al. Changes in DNA repair during aging. Nucleic Acids Res. 2007;35:7466–7474.
- Kaya A, Lobanov AV, Gladyshev VN. Evidence that mutation accumulation does not cause aging in Saccharomyces cerevisiae. Aging Cell. 2015;14:366–371.
- McMurray MA, Gottschling DE. An age-induced switch to a hyper-recombinational state. Science. 2003;301:1908–1911.