
ABSTRACT
The role of melatonin in promoting the yield of Cashmere goat wool has been demonstrated for decades though there remains a lack of knowledge regarding melatonin mediated hair follicle growth. Recent studies have demonstrated that long non-coding RNAs (lncRNAs) are widely transcribed in the genome and play ubiquitous roles in regulating biological processes. However, the role of lncRNAs in regulating melatonin mediated hair follicle growth remains unclear. In this study, we established an in vitro Cashmere goat secondary hair follicle culture system, and demonstrated that 500 ng/L melatonin exposure promoted hair follicle fiber growth. Based on long intergenic RNA sequencing, we demonstrated that melatonin promoted hair follicle elongation via regulating genes involved in focal adhesion and extracellular matrix receptor pathways and further cis predicting of lncRNAs targeted genes indicated that melatonin mediated lncRNAs mainly targeted vascular smooth muscle contraction and signaling pathways regulating the pluripotency of stem cells. We proposed that melatonin exposure not only perturbed key signals secreted from hair follicle stem cells to regulate hair follicle development, but also mediated lncRNAs mainly targeted to pathways involved in the microvascular system and extracellular matrix, which constitute the highly orchestrated microenvironment for hair follicle stem cell. Taken together, our findings here provide a profound view of lncRNAs in regulating Cashmere goat hair follicle circadian rhythms and broaden our knowledge on melatonin mediated hair follicle morphological changes.
Introduction
Melatonin (N-acetyl-5-methoxytryptamine) is a highly conserved indole mainly secreted by the pineal gland and plays vital roles in physiological functions such as the circadian cycle, pubertal development, and seasonal adaptation [Citation1]. Besides, it is now increasingly believed that melatonin can also be synthesized via extrapineal sites while the dose is limited [Citation2]. The serum melatonin level is highly dynamic and shows circadian rhythm changes. Melatonin mainly exerts biological effects via activating two high-affinity G protein–coupled receptors melatonin receptor type 1, 2 (MT1, MT2, cell membrane receptor) and retinoid-related orphan nuclear hormone receptor (RZR/RORα, nuclear receptor) [Citation3]. Research on in vitro cellular exposure to melatonin demonstrate that melatonin can function as an antioxidant in mammalian cells and participate in apoptosis, DNA damage repair, stem cell differentiation and inflammatory pathways [Citation4–Citation7]. Of particular interest, melatonin has been known for orchestrating hair growth and pigmentation for decades [Citation8–Citation11]. It has long been demonstrated that hypodermic implantation of melatonin can alter wool and cashmere production in Cashmere goat, besides, pinealectomized rats show abnormal hair follicle growth, further illustrating that melatonin play vital roles during hair follicle development [Citation12]. However, there is still limited information concerning the machinery underlying melatonin regulated cashmere growth [Citation13].
Cashmere is an important economic trait worldwide and the world market for cashmere is increasing while the current production of cashmere is limiting [Citation14]. The growth of cashmere is photoperiod-dependent, which manifest as seasonal molting in many goat varieties. Cashmere goats harbor two different kinds of fleece: a short and fine non-medullated cashmere fiber and a long and coarse medullated guard hair. The growth of secondary hair follicles produces cashmere while the growth of primary follicles produces guard hairs [Citation15]. The growth of hair follicles is a highly orchestrated and cyclic progress which involves three main stages: anagen (growth), catagen (regression), and telogen (resting) [Citation16,Citation17]. Every year beginning in August, in north China, Cashmere goats enter a rapid secondary hair follicle growth stage (anagen) in response to seasonal daylight mediated serum melatonin levels. By using high-throughput transcriptome sequencing technologies, studies have revealed that focal adhesion, extracellular matrix (ECM) receptor interaction and Wnt/β-catenin/Lef1 signaling pathways play vital roles during hair morphogenesis in Cashmere goat and Bai et al. demonstrated that miRNAs also show stage specific expression during the telogen and catagen transition, further demonstrating the role of non-coding RNAs in hair follicle development [Citation18,Citation19].
Increasing studies have demonstrated that noncoding portions of the genome play vital roles in regulating development processes [Citation20], and it is estimated that only 1.5% of the genome constitutes protein coding genes [Citation21]. LncRNAs are transcripts longer than 200 nucleotides and have been demonstrated to participate in biological processes such as cell growth, proliferation and differentiation [Citation22,Citation23]. Furthermore, recent studies have demonstrated that lncRNAs are localized within micro-vesicles and body fluids including urine and blood, further illustrating their role in intracellular regulation [Citation24–Citation26]. LncRNAs have multiple functions including transcriptional activation, silencing of protein coding genes and interacting with mRNA or miRNA to regulate their function [Citation27]. Increasing data has shown that lncRNAs participate in cashmere periodic growth and pigmentation [Citation28], however, how melatonin regulates cashmere growth and the lncRNA and mRNA regulatory networks, during melatonin mediated hair follicle growth, remains unclear.
In this study, high throughput sequencing was performed to get insights into the lncRNA and mRNA networks involved during melatonin-mediated cashmere secondary hair follicle growth. We firstly isolated goat secondary hair follicle stem cells (gsHFSCs) from Shaanbei Cashmere goat at anagen and a cell proliferation assay demonstrated that 500 ng/L of melatonin significantly promoted cell proliferation. In vitro culture of cashmere secondary hair follicles exposed to different concentrations of melatonin demonstrated that 500 ng/L of melatonin also promoted secondary hair follicle elongation. In order to explore the expression pattern of lncRNAs and mRNAs in melatonin mediated secondary hair follicle elongation, we profiled the lncRNAs and mRNAs in the control and melatonin exposed goat secondary hair follicles. Our study illustrates a comprehensive understanding of lncRNAs and mRNAs interaction networks in melatonin mediated goat secondary hair follicle models and has the broader goal of promoting our understanding of the mechanisms involved in photoperiod-dependent goat seasonal molting.
Results
In vitro isolation and characterization of gsHFSCs
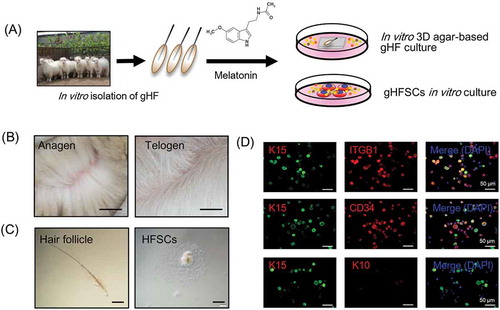
Skin samples were obtained from Shaanbei Cashmere goat dorsal skin at anagen via surgical operation. gsHFSCs isolation and in vitro culture procedure are illustrated in . Cashmere of Shaanbei Cashmere goat in anagen and telogen showed significant morphological differences (), briefly, Cashmere goats in anagen harbor abundant secondary hair follicles while it is not the case for Cashmere goats in telogen. To obtain desired cell populations, single goat hair follicles were separated via a pair of precise forceps mechanically (, left) and further trypsinized with 0.25% trypsin-EDTA solution, after 3–4 days cells formed adherent cultures in gsHFSCs culture media and HFSCs migrated out (, right). To further verify hair follicle stem cell characteristics of the obtained cells, three commonly used hair follicle stem cells markers were used for characterization of the putative gsHFSCs [Citation29,Citation30]. The results showed that gsHFSCs expressed the hair follicle stem cell markers ITGB1, Keratin 15 (K15) and CD34, but not Keratin 10 (K10), andin vivo Cashmere goat skin immunohistochemistry staining further indicates that these gsHFSCs are mainly located in the hair follicle structures ( and Fig. S1). These data demonstrated that the current established in vitro culture system enables growth and expansion of cells with gsHFSCs characteristics.
Figure 1. gsHFSCs in vitro isolation pipeline and characterization. (A) Schematic diagram of the Cashmere gsHFSCs in vitro culture and single hair follicle in vitro agar based 3-D culture system. (B) Representative images obtained from anagen and telogen Shaanbei White Cashmere goat back skin. Scale bar, 1.5 cm. (C) Representative image of anagen Cashmere goat secondary hair follicles and in vitro cultured gsHFSCs. Scale bar, 400 μm. (D) Co-immunofluorescent staining of the hair follicle stem cell markers ITGB1, K15, CD34 and non-hair follicle stem cell marker K10 in gsHFSCs. Scale bar, 50 μm
Effects of melatonin on gsHFSCs proliferation and goat secondary hair follicle elongation
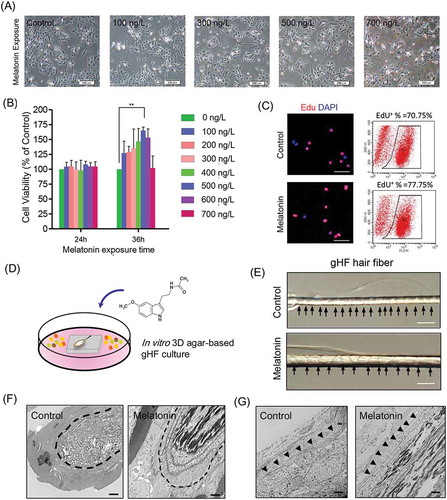
Since previous data indicated that melatonin implants subcutaneously are able to promote goat wool and cashmere production [Citation13,Citation31], we sought to investigate the effect of melatonin exposure on the proliferation of gsHFSCs and hair fiber elongation in vitro. Morphology observation of gsHFSCs revealed no significant macroscopic changes after melatonin exposure (). Then, a series of melatonin concentrations and different exposure times were applied to test cell viability of gsHFSCs using the MTT proliferation assay. The exposure time of 36 h using 100 – 600 ng/L melatonin concentrations promoted gsHFSCs proliferation, with the most significant proliferation promoting effect at 500 ng/L of melatonin (). In contrast, 24 h melatonin exposure did not significantly affect gsHFSCs proliferation. To further investigate whether 500 ng/L of melatonin significantly promotes gsHFSCs proliferation at 36 h, we performed an EdU incorporation assay, and the data demonstrated that the percentage of EdU positive cells in the melatonin group was 77.75%, while it was 70.75% in the control group (). Cell cycle analysis revealed that melatonin exposure did not affect the percentage of gsHFSCs at G2 and S phase at 24 h, while exposure at 36 h showed an increased percentage of G2 and S phase in the 100 and 300 ng/L melatonin exposed group (Fig. S2). We established an in vitro 3-D agar-based single hair follicle culture system (), and cultured goat secondary hair follicles with exposure to 500 ng/L of melatonin for a week according to our data above and previous observations by Ibraheem et al [Citation11], and we found that the hair shaft in the melatonin exposed group showed enhanced elongation (). In addition, TEM was utilized to gain further insight into the ultrastructure changes caused by melatonin exposure. Compared with the control group, the 500 ng/L melatonin exposed goat secondary hair follicle bulb showed more dense medullary and melanin granules (). TEM analysis of the goat secondary hair follicle outer root sheath demonstrated that hair follicles exposed to melatonin resulted in a thicker layer of outer root sheath when compared with the unexposed control group. These data together showed that melatonin exposure in vitro, in our established 3-D agar-based single hair follicle culture system, promoted hair shaft elongation and melanin granule accumulation in the hair bulb.
Figure 2. Effects of melatonin exposure on gsHFSCs proliferation and single hair follicle morphological changes. (A) Representative images depicting gsHFSCs morphology after exposure to different concentrations of melatonin at 24h. Scale bar, 200 μm. (B) Cell viability analysis of different concentrations of melatonin on gsHFSCs proliferation following 24 and 36 h exposure. (C) Flow cytometry and immunofluorescence analysis of EdU positive gsHFSCs after 0 and 500 ng/L melatonin exposure at 36 h. (D) Scheme diagram for in vitro 3D agar-based goat single hair follicle culture system. (E) Microscopic comparison of hair shafts between the control and 500 ng/L melatonin exposed Cashmere goat secondary hair follicles. Cashmere goat hair follicles were culture in agar based 3-D culture system for a week. Scale bar, 40 μm. (F) TEM pictures of Cashmere goat secondary hair follicle dermal papilla after melatonin exposure. Scale bar, 2 μm. (G) TEM pictures of Cashmere goat secondary hair follicle outer root sheath. Scale bar, 2 μm
Comparison of lncRNAs and mRNAs profiles affected by melatonin exposure
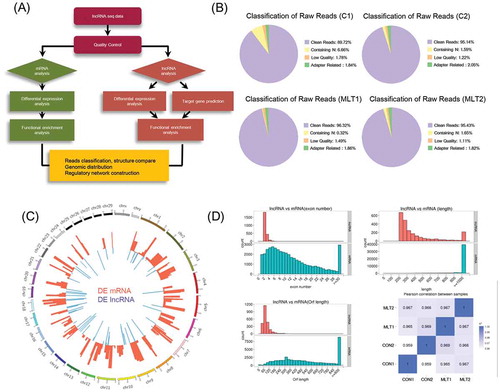
To gain further insights into the mRNA and lncRNA signatures of goat secondary hair follicles during melatonin exposure, we performed lncRNA sequencing on the control and 500 ng/L melatonin exposed goat secondary hair follicles (). A total of 538,926,668 raw reads were generated using the Illumina HiSeq 2000 Platform in which 508,431,996 reads were clean (), the clean reads generation rate was higher than 85% for all samples (). A total of 170 differentially expressed mRNAs and 63 differentially expressed lncRNAs were identified (, 2). The genome-wide distribution of differentially expressed lncRNAs and mRNAs was visualized via a Circos plot (). Noteworthy, differentially expressed mRNAs and lncRNAs were found to be located on autosomes rather than on sex chromosomes. Unsupervised hierarchical clustering (UHC) of non-amplified samples showed that control groups were clustered closely, the same as the melatonin group (Fig. S3A). Furthermore, our data demonstrated that compared with mRNAs, lncRNAs showed fewer exon numbers, shorter open reading frame lengths, and fewer transcripts (). Expression similarities between samples were analyzed via Pearson correlation analysis with an R2 > 0.8. These data demonstrated here were similar to previously described lncRNA sequencing data [Citation32,Citation33].
Table 1. High sequencing data quality control
Figure 3. mRNA and lncRNA sequencing data comparison and distribution. (A) Detailed schematic diagram of the lncRNA sequencing pipeline used in this study. (B) Raw reads classification and distribution of all samples in this study. (C) Genome wide distribution of differentially expressed mRNAs and lncRNAs. Chromosomes were labeled with serial number (scale Mb) and the red and blue histogram indicates p-value of differentially expressed mRNAs and lncRNAs individually. (D) Comparison of exon number, transcript length, open reading frame length between lncRNAs and mRNAs. Pearson correlations between samples were also analyzed
Melatonin exposure altered genes expression involved in hair morphogenesis pathways
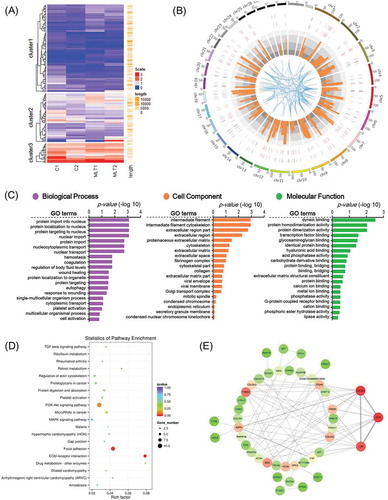
We then performed differential expression analysis of significantly expressed genes. Figure 4(a) shows differentially-expressed genes in goat secondary hair follicles that were found to be regulated by melatonin, and shows the genome-wide distribution of these genes. To better understand gene networks affected by melatonin exposure, Gene Ontology (GO) and Kyoto Encyclopedia of Genes and Genomes (KEGG) analyses were performed. Differentially expressed genes were found to be enriched in a total of 518 GO terms associated with biological processes, 138 GO terms associated with cell components, and 303 GO terms involved in molecular function ( and supplementary Table 3). KEGG pathways were enriched with differentially expressed genes involved in Focal adhesion and ECM receptor interactions ( and supplementary Table 4), two pathways previously reported to play indispensable roles during Cashmere goat hair follicle telogen and catagen transition[Citation18]. Protein-protein interaction analysis using the STRING Database (https://string-db.org) showed that the differentially-expressed genes THBS2, COL3A1, DCN and LUM were key nodes in the regulatory network. Together, these data demonstrate that melatonin exposure can influence the regulation of genes involved in hair follicle morphogenesis.
Figure 4. GO analysis and KEGG enrichment of differentially expressed mRNAs. (A) Heatmap of melatonin mediated differentially expressed mRNAs, red indicated an increased expression, and blue indicated a decreased expression. (B) Genome wide visualization of protein interactive network by Circos. From inside to outside, blue links indicate protein-protein interactive according to STRING database, orange histogram indicates p-value of differentially expressed mRNAs, combined heatmap of differentially expressed mRNAs between samples, the outer track indicates the control group and the inner track indicates melatonin exposed group. (C) GO analysis of differentially expressed mRNAs, the top 20 GO terms were shown. (D) KEGG pathway enrichment analysis of differentially expressed mRNAs, the top 20 pathways were illustrated as bubble plot. The size of the bubble indicates gene number and the color indicates q-value. (E) Protein to protein interactive network of differentially expressed mRNAs visualized Cytoscape. The color indicates node degree
LncRNA TCONS_00255106 and TCONS_00206163 are two potential regulatory factors involved in key signals regulating hair follicle morphogenesis
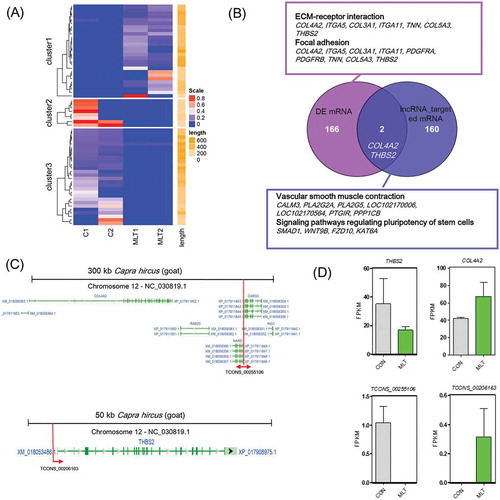
The quantification of lncRNAs revealed that 64 lncRNAs were differentially expressed after melatonin exposure (Figure 5(a)). Given that lncRNAs regulate neighboring mRNAs in cis, and these target genes can be predicted [Citation32], we performed prediction analysis of the upstream and downstream 100 kb of differentially expressed lncRNAs. A total of 160 potential target genes were predicated as targets of the 64 differentially expressed lncRNAs (Supplementary Table 5). The predicted targeted genes have roles in vascular smooth muscle contraction and signaling pathways regulating the pluripotency of stem cells (). Comparison between the differentially expressed mRNAs and lncRNAs potential target mRNAs revealed that COL4A2 and THBS2 were potential regulatory factors involved in melatonin regulating goat hair follicle development, and were targeted by lncRNA TCONS_00255106 and TCONS_00206163, respectively. The genomic organization of lncRNA TCONS_00255106 and TCONS_00206163 and their target mRNAs are shown in . In addition, we found that CARS2, RAB20, ING and NAXD were neighboring mRNAs to lncRNA TCONS_00255106 in cis. Interestingly, after melatonin exposure, lncRNA TCONS_00255106 was down-regulated while lncRNA TCONS_00206163 was up-regulated, and similar expression patterns were observed for their targeted mRNAs (). RT-qPCR validation of selected differentially expressed mRNAs and lncRNAs also showed similar expression pattern to the RNA sequencing data (Fig. S3B).
Figure 5. lncRNA analysis perturbed by melatonin exposure. (A) Heatmap of differentially expressed lncRNAs, red indicated an increased expression, and blue indicated a decreased expression. (B) Veen diagram comparison of differentially expressed mRNAs and differentially expressed lncRNA cis targeted mRNAs. The box indicates KEGG enrichment of its corresponding population. (C) Genomic location of lncRNA TCONS_00255106 and TCONS_00206163 and their potential cis targeted mRNAs. (D) Relative expression (FPKM) comparison of lncRNA TCONS_00255106, TCONS_00206163 and mRNA THBS2, COL4A2.
Melatonin regulated lncRNA and mRNA interactive network
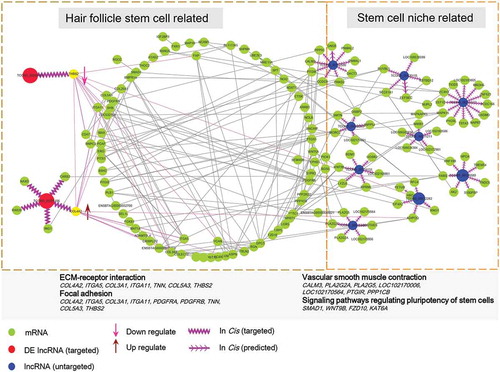
To gain further insights into melatonin’s role in hair follicle development related to the lncRNA/mRNA interactive network, we combined these differentially expressed mRNAs and target genes of differentially expressed lncRNAs and then performed protein-protein interactive network analysis (). The results demonstrated that lncRNA TCONS_00255106 and TCONS_00206163 (red node) participated into ECM-receptor interaction and focal adhesion pathways via COL4A2 and THBS2. The TGF-beta, MAPK, and PI3K-Akt signaling pathways were also involved in the melatonin mediated regulatory network. An additional 9 melatonin-regulated lncRNAs (blue node) and their targeted genes were also visualized, although these target genes were mainly involved in vascular smooth muscle contraction and signaling pathways regulating the pluripotency of stem cells, they also showed strong interaction with the differentially expressed mRNA network.
Figure 6. lncRNA and mRNA interactive network. The predicted lncRNA and mRNA network was visualized by Cytoscape, the green nodes indicate mRNAs and the red and blue nodes indicate lncRNAs. The lncRNA TCONS_00255106, TCONS_00206163 (red node) showed direct correlate to differentially expressed mRNA while the remaining lncRNAs (blue node) targeted predicated potential mRNAs
Discussion
Cashmere goats are one of typical seasonal molting mammals which provide a valuable model for investigating photoperiod-dependent hair follicle morphological changes. Pioneering work has demonstrated that melatonin plays a central role in transmitting optical signals to regulate phenotype and the role of melatonin promoting goat wool elongation and pigmentation has been demonstrated for several decades. However, there remained a lack of information concerning the melatonin intermediated mRNA/lncRNA regulatory networks. With the development of next generation sequencing technologies, we are now able to gain a deeper understanding of the regulatory mechanisms underlying biological processes. In this study, we established an in vitro 3D gsHFSCs culture system and generated, for the first time, the mRNA/lncRNA regulatory network underlying melatonin-mediated hair follicle elongation. Due to the difficulty in extracting a quality RNA library from a single Cashmere goat hair follicle, we used 2 repeats in each group. Although such a design may cause obvious within-group differences, the general within group gene expression pattern was consistent. In general, we identified a source of lncRNA information involved in melatonin-dependent hair follicle growth, these information may promote our understanding on lncRNAs regulating hair follicle development and facilitate further functional analysis of hair follicle development related lncRNAs.
Using the in vitro gsHFSCs culture system, we found that melatonin exposure promoted the proliferation of gsHFSCs at 36 h, with 500 ng/L exposure showing the most significant promoting effects. Noteworthy, our cell cycle analysis showed that the percentage of gsHFSCs at G2 and S phase in the 500 ng/L exposed group did not show significant changes after melatonin exposure, we may presume that 500 ng/L melatonin may change the length of cell cycle but not the percentage of gsHFSCs at G2 and S phase. According to a previously published in vitro tissue culture system [Citation34], we established a 3-D agar based goat hair follicle culture model. Our data demonstrated that melatonin exposure enhanced hair shaft elongation and influenced the thickness of the cuticle and melanin granule accumulation, which was consistent with previous studies [Citation11]. However, Foldes and his colleagues reported that endogenous extirpation of the pineal gland caused no effect on wool growth [Citation35], which was inconsistent with previous studies demonstrating that melatonin implants subcutaneously could promote goat wool and cashmere production [Citation31]. Although breed, age of goat, and experiment conditions may be potential causes for such inconsistency, it is possible that melatonin concentrations within the organism may play a role as that exogenous melatonin may be maintained at a certain level in a compensatory mechanism by melatonin synthesis within the hair follicle, even though serum melatonin levels were decreased [Citation2,Citation36,Citation37]. Besides, since it is unclear which effects are mediated by melatonin and its metabolites in the current system and melatonin metabolism in vitro may be different to in vivo conditions, further study may focus on such analysis [Citation38,Citation39].
Cashmere goat hair follicles undergo periodical cycles every year, which involves three main stages: anagen, catagen and telogen [Citation17]. The exact molecular machinery regulating hair cycle has been illustrated in the murine model, while it remains unclear in Cashmere goats. In the murine model, the hair follicle cyclical morphogenesis is mainly triggered by signals from dermal papilla cells, including Wnt/β-catenin/Lef1 pathways, bone morphogenetic protein (BMP) pathways and FGF7 signaling [Citation16,Citation40,Citation41]. Using a bioinformatics based analytical procedure, we found that, following melatonin exposure, differentially expressed genes were enriched in focal adhesion (COL4A2, ITGA5, PDGFRA, PDGFRB, THBS2, etc.) and ECM-receptor interaction (COL3A1, ITGA11, TNN, COL5A3, THBS2, etc.) pathways, these observations were highly reminiscent of RNA transcriptome analysis of Cashmere goat hair follicle anagen to telogen transition and transcriptome differences between Cashmere goat primary and secondary hair follicle dermal papilla cells [Citation18,Citation42]. Noteworthy, we also observed that WNT5A and BMPR1B, two key regulatory factors involved in Wnt and BMP signaling, were significantly regulated after melatonin exposure, further illustrating that melatonin exposure might similarly regulate key molecules involved in hair follicle cyclical transition. Different from the pathways involved in hair follicle stage transition, our data here demonstrated that melatonin exposure might perturb pathways involved in focal adhesion and ECM receptors. Interestingly, a recent observation in mice demonstrated that ECM receptor pathways showed indispensable roles in retaining the self-renewing capacity and multipotency of hair follicle stem cells in vitro. Thus, we presume that melatonin exposure may directly affect hair follicle stem cells and further perturb pathways involved in hair follicle morphological changes. Perturbation of hair follicle stem cell identity related genes LGR5 and PDGFRA may also support this hypothesis.
Extracellular matrix plays vital roles in skin homeostasis and also functions as structure basis for cell communication of multiple kinds of skin cells [Citation43]. Besides, highly specialized extracellular provides unique scaffold for skin appendage such as hair follicles. The development of extracellular matrix involves a component of different protein families, including collagen, laminins et al [Citation44]. By comparison of lncRNAs and mRNAs profiles affected by melatonin exposure, we found that THBS2 and COL4A2 were two key molecules involved, both of which are key genes involved in collagen fibrillogenesis [Citation45,Citation46], and researches on murine models demonstrated that THBS -/- mice showed abnormal formation of collagen fibers and COL4A2 -/- mice also showed abnormal matrix deposition, these together further demonstrated that melatonin might regulate Cashmere goat secondary hair follicle growth via ECM receptors. Furthermore, protein-protein interaction assay demonstrated that THBS2, COL3A1, DCN and LUM were key nodes in the regulatory network, all these four genes are also vital for collagen fibrillogenesis in the skin, which are essential for skin homeostasis, as gene knock out mice model of these genes showed abnormal collagen fibrils morphology in the skin [Citation46–Citation49].
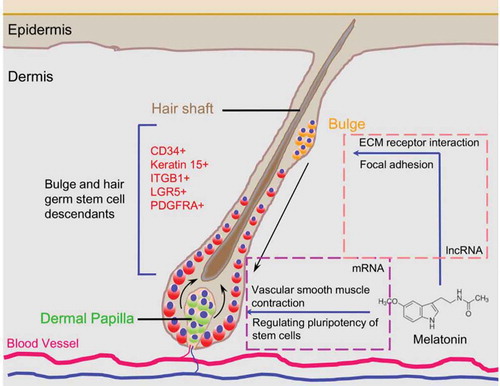
Recent research demonstrated that cis-acting lncRNAs could regulate the expression of genes in the vicinity of their transcription sites [Citation50,Citation51]. In this study, we performed cis-acting target gene prediction of those differentially expressed lncRNAs, and we found two lncRNAs specifically targeting genes involved in focal adhesion and ECM receptor pathways, further illustrating the role of lncRNAs in regulating hair follicle development. In addition, we also performed KEGG pathway enrichment analysis for the lncRNA targeted genes and found that these genes were involved in vascular smooth muscle contraction and signaling pathways regulating pluripotency of stem cells. Noteworthy, previous data demonstrated that enhanced hair follicle vascularization could promote hair follicle growth and hair follicle elongation [Citation42,Citation52,Citation53]. Thus, melatonin-mediated hair growth may be explained by melatonin exposure that directly affects the hair follicle stem cell behavior which in turn affects key signals involved in hair follicle development. At the same time, the lncRNAs participated into the regulatory circuitry and affected key signals (vascular smooth muscle contraction and signaling pathways regulating pluripotency of stem cells) in the hair follicle bulge to orchestrate the stem cell niche (). The specialized microvascular and extracellular niche constitute the microenvironment suitable for regulating hair follicle transition and orchestrating signaling response to regulatory molecules.
Figure 7. Proposed diagram for melatonin mediated Cashmere secondary hair follicle growth
In conclusion, our data demonstrated that 500 ng/L melatonin exposure in an in vitro culture system promoted hair fiber growth and growth of Shaanbei Cashmere gsHFSCs based on a 3D secondary hair follicle in vitro culture system. Using lncRNA sequencing technology, we found that melatonin exposure perturbed genes involved in focal adhesion and ECM receptor pathways, while the differentially expressed lncRNAs mainly targeted genes involved in vascular smooth muscle contraction and signaling pathways regulating the pluripotency of stem cells. Remarkably, we found that lncRNA TCONS_00255106 and TCONS_00206163 might alter COL4A2 and THBS2 expression in a cis acting manner. We presume that melatonin exposure perturbed genes involved in hair follicle morphogenesis, while lncRNAs could potentially be involved in regulating key signaling pathways orchestrating the hair follicle stem cell niche and affecting stem cell self-renewing. Taken together, results of this study could have implications on the roles of lncRNAs in regulating hair follicle development, and warrants further functional analysis of the identified lncRNAs in regulating hair morphogenesis.
Materials and methods
Animals
The Shaanbei White Cashmere goats used in this study were obtained from the Shaanbei Cashmere Goat Engineering Technology Research Center of Shaanxi Province, fed with Cashmere goat standard of Shaanxi Province (DB61/T583-2013, http://www.sxny.gov.cn/). The cashmere goats were 1 year old with coefficient of relationship < 0.125. All experimental and surgery procedures involved in this study were approved by the Experimental Animal Manage Committee of Northwest A&F University.
Isolation and culture of gsHFSCs
Skin samples were collected from the dorsal skin and immediately rinsed in ice-cold saline supplemented with 100 U/ml penicillin and 100 mg/ml streptomycin (Gibco, Grand Island, NY, USA), then the samples were clipped with scissors, and ophthalmic forceps (Sigma, St. Louis, MO, USA) were used to isolate goat secondary hair follicles (Sigma, St. Louis, MO, USA). For hair follicle in vitro culture, 1.5% agarose gel stands were prepared as previously described [Citation34]. The gels were cut into hexahedrons of about 10 mm × 10 mm × 5 mm in size and were soaked with culture media in 12-well plate 2 h before use. About 3–5 single goat secondary hair follicles were placed on agarose gel stands half soaked with medium and medium was changed every 2 days. For the gsHFSCs in vitro isolation, single secondary hair follicles were trypsinized with 0.25% trypsin-EDTA solutions at 37°C for 15 min, then the hair bulb was mechanically cut down with a 1 ml syringe and the obtained cells were cultured with gsHFSCs media in adherent culture dishes. The gsHFSCs media consisted of DMEM/F12 media (Gibco, Beijing, China) supplemented with 2% B27 supplement (Gibco, Grand Island, NY, USA), 20 ng/ml epidermal growth factor (EGF, Sigma, St. Louis, MO, USA), 40 ng/ml recombinant human FGF-basic (bFGF, PeproTech, Rocky Hill, NJ, USA), penicillin (100 U/ml) and streptomycin (100 mg/ml) as we previously described [Citation54].
Immunofluorescence analyses
Immunocytochemistry and immunohistochemistry were performed as we previously described with some modifications [Citation54]. Briefly, for immunocytochemistry analysis, adherent gsHFSCs were trypsinized with 0.25% trypsin-EDTA for 5 min at 37°C to prepare a single cell suspension. Single cell pellets were then fixed with 4% paraformaldehyde at 4°C overnight, about 40 μl single cell suspensions were cytospined in 3-Aminopropyl-Triethoxysilane (APES) (ZSGB-BIO, Beijing, China) treated slides, following permeabilised in 0.5% Triton X-100 PBS (Solarbio, Beijing, China) solution for 10 min, the slides were then blocked with PBS containing 10% goat serum (BOSTER, Wuhan, China) and 0.5% triton X-100 for 40 min at room temperature. Slides were then incubated with primary antibodies against ITGB1 (Sangon, Shanghai, China), CD34 (Abcam, Shanghai, China) and Keratin 15 (Abcam) at 4°C overnight. Goat anti-rabbit Ig-CY3/FITC-conjugated secondary antibodies (Solarbio) were used to specifically bind to primary antibodies at 37°C for 30 min. Hoechst33342 was used for nuclei staining and the slides were finally mounted with Vectashield mounting media (Vector, Burlingame, CA, USA). All pictures were taken under Olympus BX51 fluorescence microscope imaging system (Olympus, Tokyo, Japan).
For immunohistochemistry, single secondary hair follicles were fixed with 4% paraformaldehyde at 4°C overnight, followed by dehydration in a gradient ethanol series. The samples were then rinsed with xylene and further embedded in paraffin. Embedded samples were serially cut into 5 μm sections using a microtome (Leica RM2255, Nussloch, Germany). Before staining, slides were deparaffinized in xylene and antigen retrieval was performed in 0.01 M sodium citrate buffer at 96°C for 10 min. PBS supplemented with 10% goat serum and 3% bovine serum albumin (Sigma) was used for blocking at room temperature for 40 min. Primary antibodies were then incubated with the samples at 4°C overnight. The remaining procedure was in accordance with immunocytochemistry procedure indicated above, pictures were also obtained under Olympus BX51 fluorescence microscope imaging system.
Cell viability analysis
For cell viability analysis, MTT (3-(4, 5-dimethylthiazol-2-yl)-2, 5-diphenyltetrazolium bromide) (MP Biomedicals Europe, Illkirch, France) was used for cell proliferation assay. Briefly, single gsHFSCs pellets were seeded in a 96 well culture dish at a concentration of 1 × 10⁴ cells/well, the cells were then exposed to different concentrations of melatonin, and the culture medium was aspirated off after treatment. Then, 50 μl of 0.5 mg/ml MTT solution were incubated at 37°C for 4 h in dark. A total of 150 μl DMSO (Amresco, Solon, OH, USA) were used for formazan crystals formation and the optical density value was measured with a multiwell microplate reader (Thermo Scientific, Waltham, MA, USA) at the wavelength of 570 nm.
5-ethynyl-2′-deoxyuridine (EdU) cell incorporation assay
For cell proliferation assay, 5-ethynyl-2′-deoxyuridine (EdU) Cell-Light™ EdU Apollo®567 in Vitro Flow Cytometry Kit (RiboBio, Guangzhou, China) was used. Briefly, 100 µM EdU were incubated with gsHFSCs for 36 h, then, the cells were harvested by trypsinization and fixed with 4% paraformaldehyde for 30 min at room temperature. After permeabilization with 0.5% Trion X-100 for 10 min at room temperature, cells were stained with 100 µM Apollo 550 fluorescent azide reaction buffer for 10 min at room temperature. Following washed three times with PBS, cells were incubated with DAPI (Sigma) for 5 min to stain nuclei. EdU positive cell was either analyzed with a FACSCaliburTM flow cytometer or Olympus BX51 fluorescence microscope imaging system.
Cell cycle analysis
Single cell pellets were fixed with 70% ethanol overnight prior to staining, then the cells were stained with 50 μg/ml PI (Sangon) and 100 μg/ml RNase Type A (Beyotime, Beijing, China) in PBS at 37°C for 30 min. After incubation, the cells were immediately turned to a FACSCaliburTM flow cytometer (Becton Dicksion, San Jose, CA, USA) and ~20,000 cells were collected for analysis. Data were analyzed with MODIFIT software (Becton-Dickinson, San Jose, CA, USA).
Transmission electron microscope analysis
For ultrastructural analysis, single hair follicles were fixed with 2% glutaraldehyde in PBS for 2 h and 1% OsO4 for 1 h at 4°C. Then, the samples were dehydrated with ethanol series and infiltrated with embedding medium in propylene oxide. Polymerization was performed at 37°C for 12 h, 45°C for 12 h and 60°C for 48 h. Samples were sectioned with an ultramicrotome (Leica EM UC7, Nussloch, Germany) and then were mounted on form var-coated, carbon-stabilized Mo grids. HT7700 transmission electron microscope (JEOL Ltd., Tokyo, Japan) was used to obtain ultrastructure of goat secondary hair follicles. Pictures were taken at an accelerating voltage of 80 kV.
RNA extraction and quality control
All hair follicles subjected to RNA sequencing were isolated from the same goat, the obtained single Cashmere goat hair follicle were then divided into two groups (control vs melatonin). For each group, 2 repeats were used and each repeat contained 3–4 single Cashmere goat hair follicles. Total RNA was extracted from the secondary hair follicles using RNA purification kit (Invitrogen, Carlsbad, CA, USA) according to manufacturer’s instructions. RNA concentration was measured using Qubit® RNA Assay Kit in Qubit® 2.0 Flurometer (Life Technologies, CA, USA) and RNA integrity was analyzed with the RNA Nano 6000 Assay Kit of the Bioanalyzer 2100 system (Agilent Technologies, CA, USA).
Library preparation for lncRNA sequencing
Library construction and lncRNA sequencing were performed as previously described [Citation28]. For library construction, about 3 μg RNA per sample was used and ribosomal RNA was removed by Epicentre Ribo-zero™ rRNA Removal Kit (Epicentre Technologies, Madison, WI, USA). Paired-end reads were then prepared by NEBNext® Ultra™ Directional RNA Library Prep Kit (NEB, Beverly, MA, USA) for Illumina® following manufacturer’s instructions. Then the cDNA libraries were subjected to standard Illumina sequencing procedure using the HiSeq2000 sequencing systems.
Bioinformatics analysis
Raw data (raw reads) of fastq format containing adapter, poly-N and low quality reads were firstly removed with in-house perl (www.perl.org) scripts, Q20, Q30 and GC content were used to filter high quality clean data. Reference goat genome and annotation files were downloaded from genome website (http://goat.kiz.ac.cn) directly. Bowtie v2.0.6 was used to build index of reference genome and TopHat v2.0.9 was used for aligning reads to the goat genome [Citation55–Citation57]. Transcript assembly was performed with Cufflinks [Citation58]. LncRNAs and coding genes expression quantification (FPKM, fragments per kilobase of exon per million fragments mapped) were analyzed with Cuffdiff (v2.1.1) [Citation58], and transcripts or genes with an adjusted p-value < 0.05 were considered differentially expressed.
Genome distribution of differentially expressed mRNAs and lncRNAs was illustrated with Circos (http://circos.ca/) and GO enrichment analysis was performed with DAVID database (https://david.ncifcrf.gov/) [Citation59,Citation60]. For KEGG analysis, differentially expressed genes were analyzed with KEGG online website (http://www.genome.jp/kegg/). Protein-protein interaction network of differentially expressed genes were analyzed with STRING database (https://string-db.org/), further visualized with Cytoscape (http://www.cytoscape.org/). For target prediction of lncRNAs to differentially expressed genes, Cis role of target gene prediction was analyzed. LncRNA were considered to interact with differentially expressed genes if they were located within 100 kb upstream or downstream of lncRNAs.
Real-time quantitative PCR (RT-qPCR) analysis
Primers used for RT-qPCR analysis were listed in supplementary table 6. All PCR procedures were performed as we previously described [Citation61]. Briefly, PrimeScript™ RT reagent Kit (TaKaRa, Dalian, China) was used to obtain the first strand cDNA. RT-qPCR was performed with Bio-Rad CFX96 Touch™ Real Time PCR Detection System (Bio-Rad Laboratories, Hercules, CA, USA) using the SYBR Premix Ex TaqTM kit (TaKaRa, Dalian, China). Reaction conditions were set as follows: 95°C for 10 min, followed by 40 cycles of 95°C for 12 s and 58°C for 30 s.
Statistical analysis
Statistical comparisons involved in this study were analyzed and visualized with GraphPad Prism 5.0 software (GraphPad Software, San Diego, CA, USA). Student’s two-tailed t-test was used to determine statistical significance and a significant difference was considered at P < 0.05 for all tests.
Supplemental Material
Download Zip (127.2 KB)Acknowledgments
This work was supported by National Natural Science Foundation of China (31472068 and 31772573) and Science & Technology Fund Planning Projects of Yantai City (2016JH027). We thank Prof. Shen and Prof. Hasan for their kind discussions and manuscript revising. Thanks to Dr. Paul Dyce for his careful editing of the manuscript.
Disclosure statement
No potential conflict of interest was reported by the authors.
Supplementary Material
Supplemental data for this article can be accessed here.
Additional information
Funding
Related Research Data
References
- Claustrat B, Leston J. Melatonin: physiological effects in humans. Neuro-Chirurgie. 2015;61:77–84. PMID:25908646.
- Slominski AT, Kleszczynski K, Semak I, et al. Local melatoninergic system as the protector of skin integrity. Int J Mol Sci. 2014;15:17705–17732. PMID:25272227.
- Slominski RM, Reiter RJ, Schlabritz-Loutsevitch N, et al. Melatonin membrane receptors in peripheral tissues: distribution and functions. Mol Cell Endocrinol. 2012;351:152–166. PMID:22245784.
- Manchester LC, Coto-Montes A, Boga JA, et al. Melatonin: an ancient molecule that makes oxygen metabolically tolerable. J Pineal Res. 2015;59:403–419. PMID:26272235.
- Mendivil-Perez M, Soto-Mercado V, Guerra-Librero A, et al. Melatonin enhances neural stem cell differentiation and engraftment by increasing mitochondrial function. J Pineal Res. 2017;63:e12415. PMID:28423196.
- Majidinia M, Sadeghpour A, Mehrzadi S, et al. Melatonin: A pleiotropic molecule that modulates DNA damage response and repair pathways. J Pineal Res. 2017;63:e12416. PMID:28439991.
- Luchetti F, Canonico B, Betti M, et al. Melatonin signaling and cell protection function. FASEB J. 2010;24:3603–3624. PMID:20534884.
- Slominski A, Tobin DJ, Shibahara S, et al. Melanin pigmentation in mammalian skin and its hormonal regulation. Physiol Rev. 2004;84:1155–1228. PMID:15383650.
- Acuna-Castroviejo D, Escames G, Venegas C, et al. Extrapineal melatonin: sources, regulation, and potential functions. Cell Mol Life Sci. 2014;71:2997–3025. PMID:24554058.
- Stehle JH, Saade A, Rawashdeh O, et al. A survey of molecular details in the human pineal gland in the light of phylogeny, structure, function and chronobiological diseases. J Pineal Res. 2011;51:17–43. PMID:21517957.
- Ibraheem M, Galbraith H, Scaife J, et al. Growth of secondary hair follicles of the Cashmere goat in vitro and their response to prolactin and melatonin. J Anat. 1994;185(Pt 1): 135–142. PMID:7559108.
- Esrefoglu M, Seyhan M, Gul M, et al. Potent therapeutic effect of melatonin on aging skin in pinealectomized rats. J Pineal Res. 2005;39:231–237. PMID:16150102.
- Fischer TW, Slominski A, Tobin DJ, et al. Melatonin and the hair follicle. J Pineal Res. 2008;44:1–15. PMID:18078443.
- Liu H, Liu C, Yang G, et al. DNA polymorphism of insulin-like growth factor-binding protein-3 gene and its association with cashmere traits in cashmere goats. Asian-Australas J Anim Sci. 2012;25:1515–1520. PMID:25049511.
- Ji XY, Wang JX, Liu B, et al. Comparative transcriptome analysis reveals that a ubiquitin-mediated proteolysis pathway is important for primary and secondary hair follicle development in cashmere goats. PloS One. 2016;11:e0156124. PMID:27695037.
- Greco V, Chen T, Rendl M, et al. A two-step mechanism for stem cell activation during hair regeneration. Cell Stem Cell. 2009;4:155–169. PMID:19200804.
- Ge W, Cheng SF, Dyce PW, et al. Skin-derived stem cells as a source of primordial germ cell- and oocyte-like cells. Cell Death Dis. 2016;7:e2471. PMID:27831564.
- Geng R, Yuan C, Chen Y. Exploring differentially expressed genes by RNA-Seq in cashmere goat (Capra hircus) skin during hair follicle development and cycling. PloS One. 2013;8:e62704. PMID:23638136.
- Fu S, Zhao H, Zheng Z, et al. Melatonin regulating the expression of miRNAs involved in hair follicle cycle of cashmere goats skin. Yi Chuan = Hereditas. 2014;36:1235–1242. PMID:25487268.
- Mattick JS. RNA regulation: a new genetics? Nat Reviews Genet. 2004;5:316–323. PMID:15131654.
- Wang KC, Chang HY. Molecular mechanisms of long noncoding RNAs. Mol Cell. 2011;43:904–914. PMID:21925379.
- Xia T, Chen S, Jiang Z, et al. Long noncoding RNA FER1L4 suppresses cancer cell growth by acting as a competing endogenous RNA and regulating PTEN expression. Sci Rep. 2015;5:13445. PMID:26306906.
- Alvarez-Dominguez JR, Bai Z, Xu D, et al. De novo reconstruction of adipose tissue transcriptomes reveals long non-coding RNA regulators of brown adipocyte development. Cell Metab. 2015;21:764–776. PMID:25921091.
- Huang X, Yuan T, Tschannen M, et al. Characterization of human plasma-derived exosomal RNAs by deep sequencing. BMC Genomics. 2013;14:319. PMID:23663360.
- Arita T, Ichikawa D, Konishi H, et al. Circulating long non-coding RNAs in plasma of patients with gastric cancer. Anticancer Res. 2013;33:3185–3193, PMID:23898077
- Liang L, Ai L, Qian J, et al. Long noncoding RNA expression profiles in gut tissues constitute molecular signatures that reflect the types of microbes. Sci Rep. 2015;5:11763. PMID:26123364.
- Spurlock CF 3rd, Tossberg JT, Guo Y, et al. Expression and functions of long noncoding RNAs during human T helper cell differentiation. Nat Commun. 2015;6:6932. PMID:25903499.
- Ren H, Wang G, Chen L, et al. Genome-wide analysis of long non-coding RNAs at early stage of skin pigmentation in goats (Capra hircus). BMC Genomics. 2016;17:67. PMID:26785828.
- Chacon-Martinez CA, Klose M, Niemann C, et al. Hair follicle stem cell cultures reveal self-organizing plasticity of stem cells and their progeny. EMBO J. 2017;36:151–164. PMID:27940653.
- Zhang S, Hu H, Zhang H, et al. Hair follicle stem cells derived from single rat vibrissa via organ culture reconstitute hair follicles in vivo. Cell Transplant. 2012;21:1075–1085. PMID:22546759.
- Lincoln GA, Ebling FJ. Effect of constant-release implants of melatonin on seasonal cycles in reproduction, prolactin secretion and moulting in rams. J Reprod Fertil. 1985;73: 241–253. PMID:3918164.
- Zhang S, Qin C, Cao G, et al. Systematic analysis of long noncoding RNAs in the senescence-accelerated mouse prone 8 brain using RNA sequencing. Mol Ther Nucleic Acid. 2016;5:e343. PMID:27483026.
- Liu P, Wang Y, Du X, et al. Transcriptome analysis of thermal parthenogenesis of the domesticated silkworm. PloS One. 2015;10:e0135215. PMID:26274803.
- Sato T, Katagiri K, Kubota Y, et al. In vitro sperm production from mouse spermatogonial stem cell lines using an organ culture method. Nat Protoc. 2013;8:2098–2104. PMID:24091557.
- Foldes A, Maxwell CA. Effect of pinealectomy and plane of nutrition on wool growth in Merino sheep. J Pineal Res. 1993;15: 27–34. PMID:8229643.
- Slominski A, Pisarchik A, Semak I, et al. Serotoninergic and melatoninergic systems are fully expressed in human skin. FASEB Journal: Official Publication of the Federation of American Societies for Experimental Biology. 2002;16:896–898. PMID:12039872.
- Slominski A, Baker J, Rosano TG, et al. Metabolism of serotonin to N-acetylserotonin, melatonin, and 5-methoxytryptamine in hamster skin culture. J Biol Chem. 1996;271: 12281–12286. PMID:8647827.
- Slominski AT, Semak I, Fischer TW, et al. Metabolism of melatonin in the skin: why is it important? Exp Dermatol. 2017;26:563–568. PMID:27619234.
- Kim TK, Kleszczynski K, Janjetovic Z, et al. Metabolism of melatonin and biological activity of intermediates of melatoninergic pathway in human skin cells. FASEB J. 2013;27:2742–2755. PMID:23620527.
- Biernaskie J, Paris M, Morozova O, et al. SKPs derive from hair follicle precursors and exhibit properties of adult dermal stem cells. Cell Stem Cell. 2009;5:610–623. PMID:19951689.
- Muller-Rover S, Handjiski B, van der Veen C, et al. A comprehensive guide for the accurate classification of murine hair follicles in distinct hair cycle stages. J Invest Dermatol. 2001;117:3–15. PMID:11442744.
- Zhu B, Xu T, Yuan J, et al. Transcriptome sequencing reveals differences between primary and secondary hair follicle-derived dermal papilla cells of the Cashmere goat (Capra hircus). PloS One. 2013;8:e76282. PMID:24069460.
- Schwarzbauer J. Basement membranes: putting up the barriers. Current Biology: CB. 1999;9: R242–R244. PMID:10209113.
- Timpl R. Macromolecular organization of basement membranes. Curr Opin Cell Biol. 1996;8: 618–624. PMID:8939648.
- Poschl E, Schlotzer-Schrehardt U, Brachvogel B, et al. Collagen IV is essential for basement membrane stability but dispensable for initiation of its assembly during early development. Development. 2004;131:1619–1628. PMID:14998921.
- Kyriakides TR, Leach KJ, Hoffman AS, et al. Mice that lack the angiogenesis inhibitor, thrombospondin 2, mount an altered foreign body reaction characterized by increased vascularity. Proc Natl Acad Sci U S A. 1999;96: 4449–4454. PMID:10200282.
- Eder J, Laccone F, Rohrbach M, et al. A new COL3A1 mutation in Ehlers-Danlos syndrome type IV. Exp Dermatol. 2013;22:231–234. PMID:23489429.
- Reed CC, Iozzo RV. The role of decorin in collagen fibrillogenesis and skin homeostasis. Glycoconj J. 2002;19:249–255. PMID:12975602.
- Yeh JT, Yeh LK, Jung SM, et al. Impaired skin wound healing in lumican-null mice. Br J Dermatol. 2010;163:1174–1180. PMID:20738297.
- Zhang YC, Liao JY, Li ZY, et al. Genome-wide screening and functional analysis identify a large number of long noncoding RNAs involved in the sexual reproduction of rice. Genome Biol. 2014;15:512. PMID:25517485.
- Marquardt S, Raitskin O, Wu Z, et al. Functional consequences of splicing of the antisense transcript COOLAIR on FLC transcription. Mol Cell. 2014;54:156–165. PMID:24725596.
- Yano K, Brown LF, Detmar M. Control of hair growth and follicle size by VEGF-mediated angiogenesis. J Clin Invest. 2001;107:409–417. PMID:11181640.
- Mecklenburg L, Tobin DJ, Muller-Rover S, et al. Active hair growth (anagen) is associated with angiogenesis. J Invest Dermatol. 2000;114:909–916. PMID:10771470.
- Ge W, Zhao Y, Lai FN, et al. Cutaneous applied nano-ZnO reduce the ability of hair follicle stem cells to differentiate. Nanotoxicology. 2017;11:465–474. PMID:28326861.
- Langmead B, Salzberg SL. Fast gapped-read alignment with Bowtie 2. Nat Methods. 2012;9:357–359. PMID:22388286.
- Langmead B, Trapnell C, Pop M, et al. Ultrafast and memory-efficient alignment of short DNA sequences to the human genome. Genome Biol. 2009;10:R25. PMID:19261174.
- Trapnell C, Roberts A, Goff L, et al. Differential gene and transcript expression analysis of RNA-seq experiments with TopHat and Cufflinks. Nat Protoc. 2012;7:562–578. PMID:22383036.
- Trapnell C, Williams BA, Pertea G, et al. Transcript assembly and quantification by RNA-Seq reveals unannotated transcripts and isoform switching during cell differentiation. Nat Biotechnol. 2010;28:511–515. PMID:20436464.
- Huang da W, Sherman BT, Lempicki RA. Systematic and integrative analysis of large gene lists using DAVID bioinformatics resources. Nat Protoc. 2009;4:44–57. PMID:19131956.
- Huang da W, Sherman BT, Lempicki RA. Bioinformatics enrichment tools: paths toward the comprehensive functional analysis of large gene lists. Nucleic Acids Res. 2009;37:1–13. PMID:19033363.
- Wang S, Ge W, Luo Z, et al. Integrated analysis of coding genes and non-coding RNAs during hair follicle cycle of cashmere goat (Capra hircus). BMC Genomics. 2017;18:767. PMID:29020916.