
ABSTRACT
We previously identified a tight bidirectional phase coupling between the circadian clock and the cell cycle. To understand the role of the CLOCK/BMAL1 complex, representing the main positive regulator of the circadian oscillator, we knocked down Bmal1 or Clock in NIH3T33C mouse fibroblasts (carrying fluorescent reporters for clock and cell cycle phase) and analyzed timing of cell division in individual cells and cell populations. Inactivation of Bmal1 resulted in a loss of circadian rhythmicity and a lengthening of the cell cycle, originating from delayed G2/M transition. Subsequent molecular analysis revealed reduced levels of Cyclin B1, an important G2/M regulator, upon suppression of Bmal1 gene expression. In complete agreement with these experimental observations, simulation of Bmal1 knockdown in a computational model for coupled mammalian circadian clock and cell cycle oscillators (now incorporating Cyclin B1 induction by BMAL1) revealed a lengthening of the cell cycle. Similar data were obtained upon knockdown of Clock gene expression. In conclusion, the CLOCK/BMAL1 complex controls cell cycle progression at the level of G2/M transition through regulation of Cyclin B1 expression.
Introduction
The circadian clock and the cell cycle are two fundamental, highly dynamic, and evolutionary well conserved biological oscillators that employ cyclic gene expression and protein degradation to impose diurnal rhythmicity on behavior, physiology and metabolism, and to drive cell division, respectively.
The mammalian circadian clock consists of a light-entrainable central clock located in the hypothalamic suprachiasmatic nucleus (SCN) of the brain, and peripheral clocks situated in the individual cells of almost all other tissues [Citation1]. At the molecular level, the circadian clock is based on intertwined positive and negative transcriptional-translational feedback loops [Citation2]. In short, the positive elements of the circadian clock, encoded by the Brain and Muscle Arnt-like protein-1 (Bmal1) and the Clock genes, form a heterodimer that activates transcription of E-box promoter element containing genes, including the core clock genes Period (Per1 and Per2), Cryptochrome (Cry1 and Cry2), and nuclear hormone receptor Rev-Erbα. Once formed, PER and CRY proteins heterodimerize and translocate to the nucleus where they inhibit CLOCK/BMAL1-mediated transcription of E-box genes, including their own [Citation2]. Post-translational modification events, including phosphorylation and ubiquitination, target the PER and CRY proteins for degradation by the 26S proteasome complex, which in turn allows reactivation of CLOCK/BMAL1-mediated transcription and initiation of a new circadian cycle [Citation3,Citation4]. In addition, CLOCK/BMAL1-driven cyclic expression of the Rev-Erbα gene (encoding an inhibitor of ROR-driven Bmal1 expression) causes Bmal1 expression to oscillate, which confers robustness to the circadian core oscillator. BMAL1 and CLOCK are also responsible for the cyclic transcription of E-box-containing clock-controlled genes (CCG) that couple the circadian oscillator to a wide variety of physiological pathways.
Similar to the circadian clock, the cell cycle behaves as an oscillator in which cyclic expression of key cell cycle molecules (i.e. cyclins) regulates cell cycle progression in a sequential and unidirectional manner [Citation5,Citation6]. Cyclins are produced at specific stages of the cell cycle and associate with their respective constitutively expressed Cyclin-Dependent Kinase (CDK) partner. The kinase activity of the cyclin-CDK complexes triggers various events at specific times during the cell cycle. In short, mitogenic signals prompt the expression of Cyclin D, which binds to CDK4 and CDK6 and irreversibly drives the cell through G1 phase and prepares it for replication. The underlying signalling cascade includes activation of the Ccne1 and Ccna2 cyclin genes [Citation7]. Cyclin E protein levels peak at late G1, resulting in the formation of Cyclin E/CDK2 complexes that initiate G1/S transition and subsequent DNA replication [Citation8,Citation9]. Cyclin A2 starts to appear during S phase and, along with its catalytic subunit CDK2, is essential for DNA replication and S phase progression [Citation10–Citation12]. Ablation of Cyclin A2 in cultured cells blocks DNA synthesis and delays S phase progression [Citation13,Citation14]. Mitotic entry is triggered by Cyclin B1/CDK1 [Citation15]. Transcription of the Cyclin B1 gene CcnB1 starts in S phase with Cyclin B1 protein levels and Cyclin B1/CDK1 complex formation peaking at late G2 [Citation16,Citation17]. However, Cyclin B1/CDK1 complexes are initially kept in an inactive state by WEE1 and MYT1 kinase-mediated phosphorylation of specific CDK1 residues to avoid premature mitosis [Citation17–Citation19]. Once protein levels are sufficiently high, Cyclin B1 triggers the de-phosphorylation of CDK1, thereby activating its own (i.e. Cyclin B1/CDK1) complex and promotes entry into mitosis [Citation16]. In conclusion, oscillations in the amount and activity of the various Cyclin/CDK complexes are crucial for cell cycle progression.
Multiple studies have provided evidence for a strong connection between the circadian clock and cell cycle in proliferating cells. Bjarnason and coworkers have shown circadian variation in the abundance of cell cycle proteins in human oral mucosa [Citation20]. Moreover, expression of clock genes in human oral mucosa and skin was associated with specific cell cycle phases. Notably, peak expression of the Cyclin B1 gene Cnnb1 coincides with that of the Bmal1 clock gene, while Per1 transcription coincides with the peak of p53 mRNA levels in late G1 [Citation21]. Studies addressing the molecular link between the circadian and cell cycle oscillator have shown that the circadian clock can affect the cell cycle at different levels. For instance, expression of the G2/M inhibitor WEE1 is under circadian control via CLOCK/BMAL1 responsive E-box elements in the Wee1 gene promoter [Citation22]. Likewise, G1 to S transition has been reported to be under circadian control through CLOCK/BMAL1-mediated cyclic transcription of the cell cycle inhibitor gene p21WAF1/CIP1 [Citation23]. Furthermore, the multifunctional nuclear protein NONO was found to bind to the promoter of the p16-Ink4A cell cycle checkpoint gene and drive circadian expression in a PER-dependent manner [Citation24]. Oppositely, the cell cycle regulator protein CDK1 has been suggested to control the circadian clock through phosphorylation of REV-ERBα, which targets the latter protein for FBXW7α-mediated degradation [Citation25].
Besides those molecular links, initial studies with NIH3T3 cells containing a fluorescent clock reporter that allows time lapse imaging of the circadian clock in individual proliferating cells revealed that mitosis occurred at specific time windows, suggesting that cell division is gated by the circadian clock [Citation26]. Recently, we and others used aforementioned NIH3T3 cells to address the dynamic coupling between the clock and cell cycle in more detail by simultaneous single-cell time lapse imaging of circadian clock performance and cell cycle progression, the latter visualized through mitotic events [Citation27] or fluorescent cell cycle reporters [Citation28]. Interestingly, in the absence of external resetting cues, the cell cycle and circadian clock were shown to be phase locked in a 1:1 ratio, with the clock reporter reproducibly peaking 5 h after mitosis [Citation27,Citation28]. Notably, the length of the circadian cycle in proliferating cells adjusted to that of the cell cycle. On the other hand, synchronization of the circadian clock by physiological cues (such as dexamethasone) causes clustering of cell divisions, indicating that the cell cycle is synchronized via the circadian clock and that, accordingly, the coupling between these two oscillators is bidirectional [Citation28]. The molecular nature of the coupling of the circadian clock to the cell cycle nevertheless remains to be determined. Mathematical models for the circadian clock [Citation29,Citation30] and the cell cycle [Citation6,Citation31] have been integrated into a comprehensive computational model [Citation32] that enables the in silico analysis of the connection between the circadian clock and the cell cycle based on the molecular information provided in literature. This approach has provided new insight into the interaction of these oscillating systems and the conditions under which the cell cycle can be entrained by the circadian clock as a function of both the strength of coupling to the circadian clock and the duration of the cell cycle prior to such coupling [Citation32].
Although our knowledge on the coupling of the circadian clock and cell cycle is steadily increasing, relatively little is known on how genetic clock defects affect the interaction between these two oscillatory machineries. In the current study, we used our NIH3T33C mouse fibroblast line with fluorescent reporter genes for the circadian clock and cell cycle phase [Citation28] to investigate the role of the BMAL1 and CLOCK proteins in cell cycle progression. We show that cell cycle duration is prolonged after siRNA mediated silencing of either Bmal1 or Clock expression, and provide insight into the mechanism underlying this effect. Moreover, we used the biological data to probe and reinforce the computational model for the coupled mammalian circadian clock and cell cycle oscillators.
Results
Suppression of Bmal1 expression lengthens the cell cycle
To study the role of BMAL1 in cell cycle progression, we used NIH3T33C cells, expressing fluorescent markers for the circadian clock (Rev-Erbα-VNP fusion protein; yellow), as well as G1 phase (hCdt1-mKOrange fusion protein; red) and combined S, G2, and M (hereafter referred to as S/G2/M) phase (hGeminin-CFP fusion protein; blue) of the cell cycle [Citation28]. NIH3T33C cells were transiently transfected with a siRNA targeting Bmal1 mRNA or with a non-targeting siRNA (used as a negative control) and are hereafter referred to as siBmal1 and siCtrl cells, respectively. Analysis of Bmal1 mRNA and BMAL1 protein levels in proliferating siBmal1 cells 72 hours after transfection, revealed 74% down regulation of Bmal1 gene expression in siBmal1 cell cultures (Fig EV1A), resulting in a 71% reduction in BMAL1 protein (Fig EV1B) levels.
We first analysed clock performance and cell cycle progression in siBmal1 and siCtrl cells (n = 50 individual cells per condition) over a period of 72 hours using live cell imaging confocal microscopy (see ) for a representative example of time lapse images of a siCtrl cell, spanning a complete G1/S/G2/M cycle). In line with our previous data [Citation28], proliferating siCtrl cells show robust rhythmic expression of the clock marker and a tight phase coupling of the circadian clock and cell cycle ()). The period of the cell cycle, as calculated from the interval between two peaks of hCdt1-mKOrange expression, is 17.1 ± 0.3 h (mean ± SE; )). In marked contrast, we observed a complete suppression of circadian oscillations and robust down regulation of Rev-Erbα-VNP protein levels in proliferating siBmal1 cells, indicative for efficient knockdown of Bmal1 expression ()). Moreover, knockdown of Bmal1 expression significantly (p < 0.001) increased cell cycle length from 17.1 ± 0.3 h to 21.4 ± 0.5 h (mean ± SE; )).
Figure 1. Cell cycle dynamics in siCtrl and siBmal1 cells. (a) Representative example of time series images of the nucleus of a proliferating siCtrl (NIH3T33C) cell, stably expressing circadian clock (Rev-Erbα-VNP; yellow), as well as G1 (hCdt1-mKOrange; red) and S/G2/M (hGeminin-CFP; blue) cell cycle markers. Shown are pictures at 1.5 hour time intervals over a 18 h period, spanning one cell cycle. (b) Circadian clock performance and cell cycle progression in a siCtrl (left panel) and a siBmal1 cell (right panel). Plotted are fluorescence intensities of each of the markers over a 48 hour period. The G1 phase is defined as the interval between the peaks of hGeminin-CFP and hCDT1-mKOrange expression. Oppositely, the S/G2/M phase is defined as the interval between the peaks of hCDT1-mKOrange and hGeminin-CFP expression. (c) Box plot showing the cell cycle period and G1 and S/G2/M cell cycle phase length in siCtrl and siBmal1 cells (n = 50 cells per condition). Lowest and highest boundaries of the box indicate the 25th and 75th percentiles, respectively. The whiskers above and below the box designate the 95th and 5th percentiles, respectively. The solid line and cross within the box represent the median and mean value, respectively. *** p < 0.001 (Mann Whitney U test).
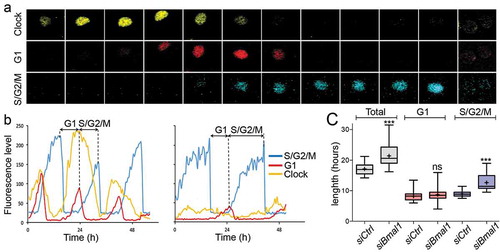
Next, we quantified the length of G1 and S/G2/M phase in siCtrl and siBmal1 cells. For simplicity, as the FUCCI markers are indicators for either G1 or S/G2/M phase rather than exact predictors of the start and end of these cell cycle phases, we defined the G1 phase as the interval between the peaks of hGeminin-CFP and hCDT1-mKOrange expression, and the S/G2/M phase as the interval between the peaks of hCDT1-mKOrange and hGeminin-CFP expression. As shown in ), the mean length of the G1 phase in siCtrl cells (8.2 ± 0.2 h) does not significantly differ (p = 0.2) from that in siBmal1 cells (8.7 ± 0.3 h). Interestingly, the average length of the S/G2/M phase significantly (p < 0.001) increased from 9.0 ± 0.8 h in siCtrl cells to 13.0 ± 0.3 h in siBmal1 cells ()).
Taken together, these results show that the BMAL1 protein acts as a cell cycle period modulator.
Suppression of Bmal1 expression specifically affects the G2 phase
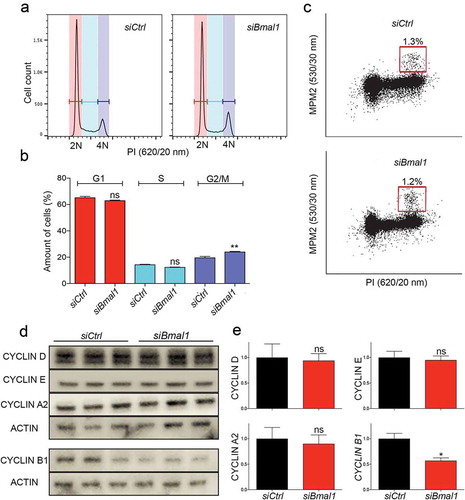
The single-cell experiments show that silencing Bmal1 expression lengthens the S/G2/M phase of the cell cycle, but do not allow to discriminate between the three phases. To investigate which specific cell cycle phase is prolonged, we compared the cell cycle distribution of proliferating siCtrl and siBmal1 cells by flow cytometry of propidium iodide stained cells ()) and quantified the cell cycle phase distribution ()). In line with the single-cell experiments, we did not observe significant changes in the percentage of G1 and S phase cells after knockdown of Bmal1 expression (G1 phase: 53.5 ± 1.2% and 52.7 ± 0.5%; S phase: 31.4 ± 1.0% and 28.5 ± 0.3 for siCtrl and siBmal1 cells respectively; mean ± SEM). On the other hand, the percentage of G2/M cells significantly (p = 0.01) increased from 13.4 ± 0.5% in siCtrl cells to 17.1 ± 0.3% in siBmal1 cells ()). In order to discriminate between G2 and M phase, we also stained the cells with an antibody against the mitosis-specific MPM-2 phosphoepitope on DNA topoisomerase IIα. As shown in ), the percentage of MPM2-positive cells is comparable for proliferating siCtrl and siBmal1 cell cultures. From these data we conclude that the observed lengthening of the S/G2/M phase after knockdown of Bmal1 is solely due to an increased duration of the G2 phase.
Figure 2. Cell cycle phase distribution of siCtrl and siBmal1 cells. (a) Flow cytometric analysis of cell cycle phases in siCtrl and siBmal1 cells. Shown are representative examples of propidium iodide (PI) stained siCtrl and siBmal1 cells, analysed for DNA content (n = 3 experiments). The vertical axis indicates the relative number of cells and the horizontal axis indicates the relative PI fluorescence. The 2N and 4N peaks and intermediate region correspond to G1, G2/M and S phase, respectively. (b) Quantification of cell cycle phase distribution of proliferating siCtrl and siBmal1 cells. Shown are the average cell numbers of the 3 independent experiments (each performed in triplicate; 20,000 cell counts per triplicate). The data were compared using the two-tailed unpaired Student’s t-test. Error bars indicate SE. ** p < 0.01. (c) Flow cytometry analysis of the number of mitotic cells. The bivariate dot plots show DNA content (PI) and mitotic phosphoproteins content (MPM2 stain) on the X and Y axis, respectively. The box marks cells stained positive for MPM2. (d) Western blot analysis of whole cell extracts from proliferating siCtrl and siBmal1 cells for Cyclin D1, Cyclin E, Cyclin A, and Cyclin B1 proteins. Shown are representative examples of n = 3 independent experiments. Actin was used as a loading control. (e) Average cyclin protein levels in proliferating siCtrl and siBmal1 cells (n = 3 independent experiments). Cyclin expression levels were normalized against actin. Cyclin expression levels in control cells were set as 1. Error bars indicate SD (n = 3 experiments).
Suppression of Bmal1 expression specifically affects Cyclin B1 expression
The observed lengthening of the combined S/G2/M phase in siBmal1 cells (single-cell analysis) and increased number of siBmal1 cells in the G2 phase (flow-cytometry analysis) clearly point to a regulatory role of BMAL1 in the kinetics of the cell cycle. We therefore next examined the expression levels of the various cyclins in proliferating siCtrl and siBmal1 cells by western blot analysis ()). Following quantification ()), the expression levels of Cyclin D1, Cyclin E, and Cyclin A (important regulators of G1 phase, G1/S transition and S phase, respectively) in siBmal1 cells did not significantly differ from those in siCtrl cells. However, the Cyclin B1 (a driver of G2/M transition) protein level is significantly (p = 0.03) reduced in siBmal1 cells. This suggests that the accumulation of siBmal1 cells in G2 phase, and the delay in G2/M transition, are caused by low levels of Cyclin B1.
Suppression of Bmal1 expression causes an overall reduction of Cyclin B1 expression
Obviously, aforementioned experiments with asynchronously proliferating cells do not discriminate between the various cell cycle phases. We therefore set out to further investigate the expression and kinetics of accumulation of the various cyclins in cell cycle synchronized siCtrl and siBmal1 cells. To this end, we used a single 24 hour thymidine block, which causes cells to accumulate at G1/S boundary. As shown by flow cytometry, after release from the thymidine block siCtrl and siBmal1 cells proceed through S phase and enter G2 phase with comparable kinetics (Fig EV2). Moreover, pulse-labeling of siCtrl and siBmal1 cells with 5-ethynyl-2′-deoxyuridine (EdU) for one hour at 1 h intervals after release from the thymidine block () revealed that DNA synthesis (as detected by immunofluorescent labeling) in siCtrl and siBmal1 cells follows similar kinetics, peaking 3 hours after thymidine block release (). Assuming that the peak in DNA synthesis represents mid-S phase, S phase in siCtrl and siBmal1 cells is estimated to span 5 to 6 hours, which is in good agreement with the flow cytometry data (30% S-phase cells at a cell cycle length of 18 hours = 5.4 h). Next, we determined Cyclin E (G1/S marker) and Cyclin A2 (S phase marker) protein levels by western blot analysis in siCtrl and siBmal1 cells harvested 0, 2, 4, 6, 8, and 10 hours after release from thymidine (). Quantification of the cyclin levels () revealed that kinetics of Cyclin E and Cyclin A2 were comparable to siCtrl cells, which is in complete agreement with our observation that siBmal1 cells show normal G1 and S phase progression.
Figure 3. Cell cycle protein expression in siCtrl and siBmal1 cells. (a) Cytochemical analysis of DNA synthesis in cell cycle synchronized siCtrl and siBmal1 cells after release from a 24 h thymidine block. Cells were harvested at 1 h intervals. Prior to harvesting, cells were exposed to a 1 h pulse labelling with EdU. (b) S phase kinetics. Quantification of Edu incorporation by siCtrl and Bmal1 cells during the 1 h pulse labelling interval, preceding cell harvesting. The Y axis indicates the mean fluorescence intensity, corrected for the number of cells. The X axis indicates time of harvesting after thymidine release. Error bars indicate SD (n = 3 experiments). The grey bar indicates the estimated time of S/G2 transition. (c, f and h) Western blot analysis of Cyclin E and Cyclin A2 (c), Cyclin B1 (f) and WEE1 (h) protein levels in siCtrl and siBmal1 cells after release from a thymidine block. Shown are representative examples of n = 3 independent experiments. Actin was used as a loading control. (d,e,g and i) Kinetics of Cyclin E (d), Cyclin A2 (e), Cyclin B1 (g) and WEE1 (i) expression after release from a thymidine block. Expression levels were normalized against actin. Expression levels in siCtrl cells at t = 0 were set as 1. Error bars indicate SD. The grey bar indicates the estimated time of S/G2 transition.
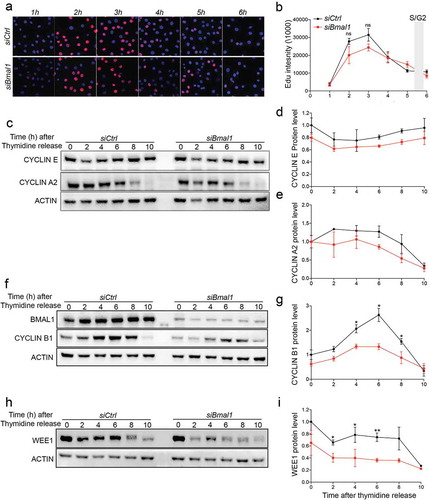
Next, we determined Cyclin B1 protein levels in siCtrl and siBmal1 cells after release from the thymidine block. As shown in , Cyclin B1 protein levels gradually increased in siCtrl cells, reaching a maximum 6 h after thymidine release at the moment when cells are in G2 phase. In line with our earlier observation in asynchronously dividing cells (), siBmal1 cells express the Cyclin B1 protein at lower levels. Moreover, siBmal1 cells display impaired induction of Cyclin B1 during G2 phase, which may explain the delay in G2/M transition.
Last but not least, as WEE1 is an inhibitor of Cyclin B/CDK1 activity and Wee1 expression is under circadian control [Citation22], we also analyzed aforementioned protein samples for WEE1 expression (). As expected, in the absence of the CLOCK/BMAL1 transcription activator, siBmal1 cells express WEE1 protein at markedly reduced level (). However, as reduced expression of this negative regulator is expected to accelerate, rather than delay G2 to M transition, the lower WEE1 protein levels in siBmal1 cells do not explain the delayed G2/M transition. Instead, our data demonstrate that the circadian clock protein BMAL1 is a modulator of cell cycle period that promotes G2 to M transition through induction of Cyclin B1 expression.
Suppression of Clock expression lengthens the cell cycle and dampens Cyclin B1 expression
The question arises to what extent the observed modulation of G2/M transition is a specific function of the individual BMAL1 protein, or whether this requires CLOCK/BMAL1 heterodimerization. We therefore transiently transfected NIH3T33c cells with a siRNA targeting the Clock gene or with a non-targeting control siRNA to obtain siClock cells. Analysis of Clock mRNA and CLOCK protein levels in proliferating siClock and siCtrl cells 72 hours after transfection, revealed 63% down regulation of Clock gene expression in siClock cell cultures (Fig EV1C), resulting in a 88% reduction in CLOCK protein levels (Fig EV1D. We next analysed clock performance and cell cycle progression in siClock and siCtrl cells (n = 40 individual cells per condition) over a period of 72 hours using time-lapse confocal microscopy (for a representative example, see )). Like siBmal1 cells, siClock cells are arrhythmic, as evident from the loss of cyclic expression of the REV-ERBα clock reporter, and proliferate significantly slower (p = 0.03) than siCtrl cells (19.7 ± 0.3 h vs 18.7 ± 0.3 h per cycle; mean ± SEM). As shown in ), the G1 phase was not significantly affected in Clock knock down cells, as compared to siCtrl cells (9.2 ± 0.2 h vs 8.5 ± 0.3 h; mean ± SEM p = 0.07). Instead, the increased cell cycle period in siClock cells originates from a lengthened S/G2/M phase (9.4 ± 0.1 h in siCtrl and 11.0 ± 0.2 h in siClock cells; p < 0.001). Subsequent analysis of the cell cycle distribution of proliferating siCtrl and siClock cells by flow cytometry revealed a significant increase in the percentage of G2/M cells (14.3 ± 0.1 in siCtrl and 20.1 ± 1.2 in siClock cells; mean ± SEM; p = 0.03), and relatively less S phase cells in proliferating siClock cell cultures (27.1 ± 0.6 in siCtrl and 21.3 ± 1.0 in siClock cells; p = 0.01) ()). These findings indicate that proliferating siClock cells markedly resemble siBmal1 cells in that the cell cycle period is increased due to slower G2/M cell cycle progression.
Figure 4. Cell cycle dynamics and Cyclin B1 protein expression in siCtrl and siClock cells. (a) Circadian clock performance and cell cycle progression in a siCtrl (left panel) and a siClock cell (right panel). Plotted are fluorescence intensities of each of the markers over a 60 hour period. (b) Box plot showing the cell cycle period and G1 and S/G2/M cell cycle phase length in siCtrl and siClock cells (n = 40 cells per condition). Lowest and highest boundaries of the box indicate the 25th and 75th percentiles, respectively. The whiskers above and below the box designate the 95th and 5th percentiles, respectively. The solid line and cross within the box represent the median and mean value, respectively. * p < 0.05; *** p < 0.001 (Mann Whitney U test). (c) Flow cytometric analysis of cell cycle phases in siCtrl and siClock cells. Shown are representative examples of propidium iodide (PI) stained siCtrl and siBmal1 cells, analysed for DNA content (n = 3 experiments). The vertical axis indicates the relative number of cells and the horizontal axis indicates the relative PI fluorescence. The 2N and 4N peaks and intermediate region correspond to G1, G2/M and S phase, respectively. (d) Quantification of cell cycle phase distribution of proliferating siCtrl and siClock cells. Shown are the average cell numbers of the 3 independent experiments (each performed in triplicate; 20,000 cell counts per triplicate). The data were compared using the two-tailed unpaired Student’s t-test. Error bars indicate SE. * p < 0.05; ** p < 0.01. (e) Western blot analysis of Cyclin B1 protein levels in siCtrl and siClock cells after release from a thymidine block. Shown are representative examples of n = 3 independent experiments. Actin was used as a loading control. (f) Kinetics of Cyclin B1 expression after release from a thymidine block. Cyclin B1 expression levels were normalized against actin. The Cyclin B expression level in siCtrl cells at t = 0 was set as 1. Error bars indicate SD (n = 3 experiments).
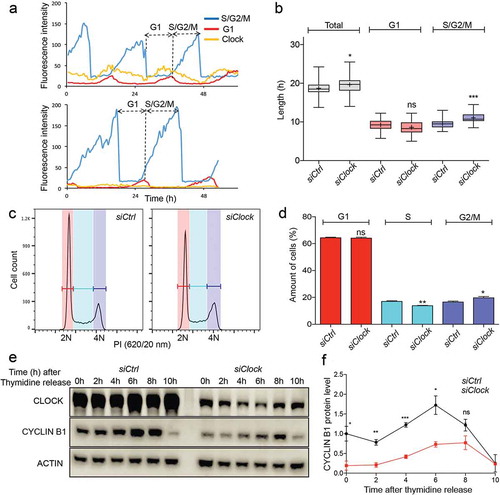
We therefore next analyzed the kinetics of Cyclin B1 accumulation in siClock and siCtrl cells after release from a 24 hour thymidine block ()). As expected, Cyclin B1 protein levels gradually increased in siCtrl cells peaking 6 hours after thymidine release (), see also )). In contrast, siClock cells show markedly reduced Cyclin B1 protein levels peaking between 6 and 8 hours after thymidine release ()). Taken together, these data indicate that modulation of G2/M transition through induction of Cyclin B1 is a characteristic of the CLOCK/BMAL1 heterodimer, rather than the BMAL1 protein alone.
Mathematical modeling of CLOCK/BMAL1-controlled cell cycle progression
The biological data on the modulating effect of CLOCK/BMAL1 on cell cycle progression serve as an ideal tool to probe and reinforce the computational model for coupled mammalian circadian clock and cell cycle oscillators, as defined by Goldbeter and coworkers [Citation6,Citation29,Citation30,Citation32]. We therefore set out to test whether the computational model would also respond with a delay in G2/M transition after simulating a reduction in Bmal1 or Clock expression levels. The coupling between the circadian clock and the cell cycle is mediated by several cell cycle proteins such as WEE1 [Citation22], p21 [Citation23], NONO [Citation24], and, as shown here, Cyclin B1. Oppositely, there are indications that the cell cycle may have an effect on the circadian clock, but the mechanism of such a coupling remains unclear [Citation33,Citation34], although a recent study points to the enhancement of REV-ERBα degradation through phosphorylation by CDK1 [Citation25]. Therefore, despite recent evidence for bidirectional coupling between the cell cycle and the circadian clock [Citation27,Citation28], we decided to focus on the situation where the cell cycle is unidirectionally coupled to the circadian clock via CLOCK/BMAL1-mediated induction of Wee1 and Cnnb1 expression. Below, we first model the impact of Bmal1 inactivation on cell cycle progression, and subsequently address the effect of in silico knockdown of Clock gene expression.
We consider that in proliferating cells the circadian clock has an overall length of 18 hours (close to the value of 17.1 h observed experimentally in proliferating siCtrl cells; . We select an autonomous period of the cell cycle of 21.1 h, which is close to the cell cycle length observed in siBmal1 cells in the absence of the circadian clock (). In line with the experimental data (), the time evolution of Bmal1 and Rev-Erbα mRNA levels in our computational model shows that under control conditions the circadian clock oscillates with a cycle length of 18h (), while all four Cyclin/CDK protein complexes (), as well as the WEE1 protein () display sustained oscillations with the same period. These results represent entrainment of the cell cycle by the circadian clock via BMAL1-mediated induction of Wee1 and CcnB1 (Cyclin B1) gene expression. This circadian control comes on top of a basal expression of the two genes, as suggested by the observation of low levels of Cyclin B1 and WEE1 protein in siBmal1 cells ().
Figure 5. Computational modeling of the impact of Bmal1 knockdown on Cyclin/CDK levels. Analysis of the effect of silencing of Bmal1 expression in the computational model for coupled mammalian circadian clock and cell cycle oscillators. The time series in the upper panels show the evolutions of Bmal1 mRNA (dark cyan, solid line), total BMAL1 protein (dark cyan, dashed line) and Rev-Erbα mRNA (orange) under normal conditions (a) or when the synthesis rate of Bmal1 mRNA is reduced by 70% (b). The period of the circadian clock is 18h in control conditions. However, the oscillations in (b) disappear upon decreasing Bmal1 mRNA synthesis. The time series in the middle panels show the time evolutions of Cyclin A/CDK2 (light green), Cyclin E/CDK2 (mustard green), Cyclin B/CDK1 (blue) and CyclinD/CDK4-6 (red) in control conditions, when the cell cycle is synchronized to the circadian clock (c), or when Bmal1 is knocked down (d). The period of the cell cycle increases from 18h in (c) to 21.1 h in (d). Also, the width of the activity peak of Cyclin B/CDK1 (blue) is significantly increased. The time series in the bottom panels show the evolutions of Cyclin B/CDK1 (blue) and WEE1 (black) when cells are in control conditions (c) or when Bmal1 gene expression is knocked down (d). The concentration of WEE1 decreases in (d) due to the lack of induction Wee1 transcription by BMAL1. Parameter values used for numerical simulations are listed in the SI appendix.
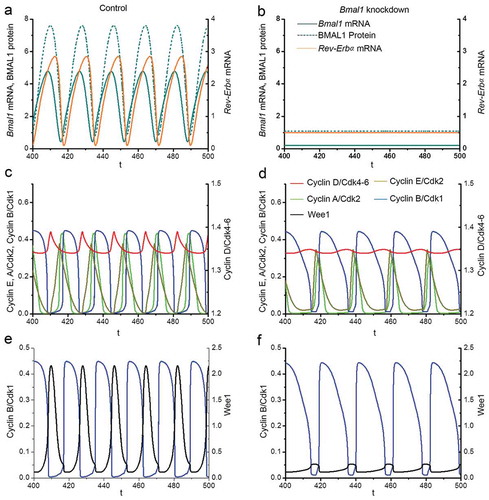
When Bmal1 gene expression is suppressed in silico by reducing the Bmal1 mRNA synthesis rate (vsB) by 70%, computational time series analysis reveals that Bmal1 mRNA levels are no longer oscillating and that BMAL1 protein levels are constitutively low (). As a consequence, Rev-Erbα mRNA levels are also constitutively low (). These data are in full agreement with the experimental data obtained with siBmal1 cells (; Figs EV1A and EV1B) and show that the circadian clock is arrested when Bmal1 expression is knocked down. Interestingly, and also in full agreement with the experimental data, the cell cycle length is prolonged from 18h to 21.1 h after in silico reduction of Bmal1 expression levels (compare ). Notably, the width of the activity peak of Cyclin B/CDK1 is significantly increased upon suppression of Bmal1 expression, while that of other Cyclins appears unaffected (). In addition, the WEE1 protein concentration decreases in the model after in silico Bmal1 knockdown due to the lack of CLOCK/BMAL1-mediated induction of Wee1 gene expression ().
Next, we examined in more detail how suppression of Bmal1 expression in our mathematical model affects the duration of the G1 and S/G2/M cell cycle phases. To this end, we defined the G1 phase as the time from mid-decrease of Cyclin B/CDK1 to 30%-decrease of Cyclin D/CDK4-6 levels and the S/G2/M phase as the time from 30%-decrease of Cyclin D/CDK4-6 to mid-decrease of Cyclin B/CDK1 levels (see ). Analysis of the computed time series reveals that under normal conditions, the G1 and S/G2/M phases span 5.84 h and 12.19h, respectively (), while in silico reduction of Bmal1 mRNA synthesis by 70% results in G1 and S/G2/M cell cycle phase lengths of 6.41 h and 14.74 h, respectively (). Thus, in line with the experimental data (), elongation of the cell cycle period upon suppression of Bmal1 expression is predominantly caused by lengthening of the S/G2/M phase.
Figure 6. Computational modeling of the impact of Bmal1 knockdown on cell cycle phase length. The time series in the upper panels show the evolutions of Cylin D/CDK4-6 (red) and Cyclin B/CDK1 (blue) when the circadian clock is in control conditions (a) or when Bmal1 expression is reduced by 70% (b). As in the corresponding , the period of the cell cycle increases from 18 h in (a) up to 21.1 h when Bmal1 expression is supressed (b). The black bars indicate the G1 phase (from mid-decrease of Cyclin B/CDK1 to 30%-decrease in Cyclin D/CDK4-6) and S/G2/M phase (from 30%-decrease in Cyclin D/CDK4-6 to mid-decrease of cyclin B/CDK1). The durations of G1 and S/G2/M in (a) are 5.84 h and 12.19 h, respectively. The durations of G1 and S/G2/M in (b) are 6.41 h and 14.74 h, respectively. Thus, the S/G2/M phase contributes most to the prolongation of cell cycle duration upon knocking down BMAL1. The time series in the lower panels show the evolutions of total Cyclin B (dashed blue line) in control conditions (c) or upon suppression of Bmal1 RNA synthesis (d). The total amount of Cyclin B (free + complexed with the kinase CDK1 and its inhibitor p21) decreases when Bmal1 expression is reduced.
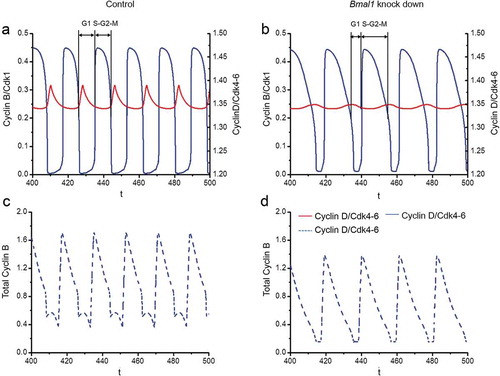
The mathematical simulations, as shown above, reveal a normal amplitude oscillation of Cyclin B/CDK1 levels after 70% reduction of the Bmal1 mRNA synthesis, which appears to contrast somewhat with the experimental data, showing a 20–25% reduction in Cyclin B1 protein levels. We therefore also determined the time evolution of the total Cyclin B1 protein level (free and complexed with CDK1) under control conditions ()) and upon reduced Bmal1 gene expression ()). The results indicate that, as in the experimental observations (see )), total Cyclin B1 levels decrease upon knocking down Bmal1, which holds with the view that BMAL1 induces CcnB1 gene expression, as reported above.
Similar results were obtained upon knocking down Clock instead of Bmal1 in the computational model for coupled mammalian circadian clock and cell cycle oscillators (data not shown), which may not come as a surprise as CLOCK and BMAL1 act as a heterodimeric complex.
In conclusion, the performance of the computational model for coupled mammalian circadian clock and cell cycle oscillators after simulation of Bmal1 or Clock silencing is in full agreement with the experimental observations in proliferating siCtrl, siBmal1 and siClock cells.
Discussion
Previously, we have reported the existence of a bi-directional link between the circadian clock and the cell cycle [Citation28]. Indeed, synchronization and resetting of the circadian clock by external cues (such as dexamethasone) can synchronize cell cycle progression. Oppositely, a clear shortening of the circadian cycle occurred in dividing cells as compared to non-dividing cells, suggesting that the cell cycle can reset the circadian clock. In the present study, we have taken a combined cell and molecular biological approach to investigate the impact of the circadian clock on cell cycle progression by genetic disruption of the molecular circadian oscillator. We show that disruption of the positive limb of the circadian transcription-translation feedback loop-based molecular oscillator through knock-down of the circadian clock genes Bmal1 or Clock prolonged the cell cycle of cultured fibroblasts. Our results show that this slowdown in cell cycle progression results from a delay in the G2/M transition. Since inactivation of Bmal1 or Clock triggers a highly comparable cell cycle phenotype, G2/M checkpoint control appears a function of the CLOCK/BMAL1 heterodimer, rather than the individual proteins.
To investigate the molecular mechanism underlying the observed delay in cell cycle progression in the absence of BMAL1 or CLOCK, we zoomed in on cell cycle protein expression during G2 phase and G2/M transition using cell cycle synchronized siBmal1 and siClock cells. Interestingly, whereas the kinetics of S phase progression remained unaffected, knockdown of Bmal1 or Clock expression resulted in overall lower Cyclin B1 protein levels, as well as a reduction of the Cyclin B1 peak at G2 phase. Since a high Cyclin B1 protein level is essential for G2 progression and mitotic entry, the impaired induction of Cyclin B1 protein levels well explains the delayed cell cycle progression in G2 phase. This view is consistent with the study by Matsuo and coworkers [Citation22] focussing on cell cycle re-entry of remaining mouse hepatocytes after partial hepatectomy at ZT0 or ZT8 (ZT, Zeitgeber time in a 12 hour light–12 hour dark cycle; ZT0 represents lights on and ZT12, lights off). Whereas S phase kinetics was independent of the time of surgery, CcnB1 mRNA and Cyclin B1 protein levels, as well as Cyclin B1/CDK1 peak activity, were delayed by about 8 to 12 hours when partial hepatectomy was performed at ZT0 as compared to ZT8 [Citation22], demonstrating that clock-controlled timing of Cyclin B1 expression and activity is determining G2/M transition.
It has been well established that expression of the Wee1 gene, encoding an important kinase regulating the G2/M checkpoint, is under direct control of the CLOCK/BMAL1 complex [Citation22]. As WEE1 acts as an inhibitor of CDK1 to prevent premature mitotic entry, one would expect inhibition of Bmal1 expression to accelerate cell cycle progression due to a reduction of WEE1 protein level and kinase activity. On the contrary, however, we observed a delay in G2/M transition of proliferating siBmal1 and siClock cells, accompanied by a reduction in Cyclin B1 protein levels. It appears, therefore, that the CLOCK/BMAL1 complex regulates at the same time the expression of an inhibitor (WEE1) and an activator (Cyclin B1) of G2/M transition. Regardless of this dual role of the CLOCK/BMAL1 complex in controlling the G2/M checkpoint, the increased cell cycle length of siBmal1 and siClock cells suggests that the dominant effect of CLOCK/BMAL1 is to induce expression of the Cyclin B1 encoding gene Cnnb1. The induction of Wee1 by CLOCK/BMAL1 could nevertheless contribute to further extending the duration of the G2/M phase by enlarging the width of the peak in CyclinB1/CDK1 in the absence of its inhibitor WEE1 in siBmal1 cells. Such a counter-intuitive effect is suggested by numerical simulations of the mathemathical model for coupled clock – cell cycle oscillators, which showed that induction of Wee1 by CLOCK/BMAL1 can shorten the duration of the cell cycle by reducing the half-width of the peaks in Cyclin B1/CDK1 [Citation32].
Understanding how transcription of the Cyclin B1 gene CcnB1 is regulated during the cell cycle would help us to understand how BMAL1 can modulate cell cycle progression. Promoter analysis of the human CcnB1 gene uncovered four E-box elements (CANNTG), one of which showing consensus for the Upstream Stimulatory Factor (USF) and acting as a G2-specific regulator of Cyclin B1 expression [Citation35]. Since the USF E-box sequence CACGTG matches that of the E-box elements recognized by CLOCK/BMAL1, this results suggest a direct role for BMAL1 in the G2-specific induction of CyclinB1. However, the USF element in the mouse promoter has a different sequence and no longer matches the E-box sequence [Citation36]. We therefore conclude that the effect of BMAL1 on Cyclin B1 levels must be indirect through (cyclic) expression of other clock genes or clock-controlled genes. A good candidate is P300, which was shown to regulate transcription of Cyclin B1 [Citation36]. Furthermore, inhibition of P300 was shown to induce cell cycle arrest [Citation37,Citation38]. We analysed expression of p300 in siCtrl and siBmal1, and found that p300 is downregulated upon Bmal1 knockdown (Fig. EV3). This suggests that the decreased Cyclin B1 levels in siBmal1 are a result of lower levels of p300 induced transcription of Cyclin B1.
BMAL1 has been shown to control expression of the tumor suppressor gene p53 [Citation39,Citation40]. The p53 protein, in turn, has been suggested to prevent G2/M transition by attenuating CcnB1 promoter activity and reducing Cyclin B1 protein levels [Citation41]. Adding to the level of complexity of circadian control of G2/M transition, the circadian clock protein PER2 (expression of which is under control of CLOCK/BMAL1) can stabilize the p53 protein and influence its subcellular localization, i.e. cytoplasmic vs nuclear [Citation42].
The availability of a model for the coupling of the cell cycle to the circadian clock in mammalian cells allows us to probe, by means of computer simulations, the effect of knocking down Bmal1 or Clock on the dynamics of the cell cycle. Previous theoretical investigations of this coupling [Citation32] were based on the circadian control of several components of the cell cycle machinery, such as the kinase WEE1, the CDK inhibitor p21, and Cyclin E. Here, the experimental study confirmed that WEE1, a kinase that inhibits CDK1, is under control of the circadian clock via the induction of Wee1 expression by CLOCK/BMAL1. The experiments uncovered an additional mode of coupling due to the induction of CcnB1 expression by CLOCK/BMAL1. We therefore incorporated these two modes of coupling into the combined model for the cell cycle and circadian clock in mammalian cells.
The model indicates that the induction of Ccnb1 and Wee1 expression by CLOCK/BMAL1 allows the cell cycle to synchronize with to the circadian clock at a period in the order of 18h. Upon suppression of BMAL1 expression by reducing the Bmal1 mRNA synthesis rate by 70%, the circadian clock stops ticking and the cell cycle recovers its autonomous period of oscillation, close to 21h. The lengthening of the period in our mathematical model is largely due to an increase of a few hours in the duration of the S/G2/M phase, which is in good agreement with the experimental data. The simulations suggest that this increase can be related to an increase in the half-width of the peak in CDK1. The larger duration of the peak in CDK1 is due to the decreased inhibition of the enzymatic activity by WEE1, given that the level of this inhibitory kinase drops when knocking down its inducer BMAL1. In this respect it is interesting to note that inactivation of BMAL1 in hippocampal neurons both experimentally and in silico causes a cell cycle effect, i.e. delayed cell cycle exit [Citation43].
Disruption of the circadian clock (genetically or environmentally) results in altered cell proliferation, and in some cases cancer predisposition. However, only few studies have been performed to detect the intracellular pathways or the key molecules responsible for the altered proliferation capacity. Our study addressed the role of BMAL1 and CLOCK in the expression of Cyclin B1, one of the key molecules for G2 phase and G2/M transition. The question arises whether the reduced Cyclin B1 protein levels in the absence of CLOCK/BMAL1 are the result of (i) the inactivation of the positive limb of the circadian transcription translation feedback loop, or (ii) a complete/overall loss of the clock. Future experiments with circadian clock deficient Cry1/Cry2 knockdown NIH3T33C cells should provide an answer to this question.
Finally, stable gene silencing of Cyclin B1 has been reported to inhibit proliferation, and sensitizes breast cancer cells to taxol treatment [Citation44]. Downregulation of Cyclin B1 via knock-down of Bmal1 could be an attractive strategy for anti-proliferative therapy. This might ultimately delay tumor progression. However, the state of circadian clock and cell cycle coupling in cancer cells still remains to be studied.
Materials & methods
Cell culture and gene knockdown
NIH3T3 and NIH3T33c cells, the latter containing Rev-Erbα-VNP clock reporter and FUCCI hCdt1-mKOrange and hGeminin-CFP FUCCI cell cycle reporter genes [Citation28] were cultured in Dulbecco’s Modified Eagle’s Medium (DMEM)/F10 (Lonza) containing 10% Fetal Bovine Serum (FBS) (Gibco), 100 U/ml Penicillin and 100 µg/ml Streptomycin in a standard humidified incubator at 37°C and 5% CO2 (pH7.7).
To knockdown Bmal1 or Clock expression, we used Silencer® Select Pre-designed siRNA for Arntl (ThermoFisher Scientific; catalog number 4390771) and Clock (ThermoFisher Scientific; catalog number 4390771). As a negative control, we used Silencer® Select Negative Control No. 1 siRNA (ThermoFisher Scientific; catalog number 4390843). Reverse transfection was performed in 6 well plates (population studies) or in 4 well poly-L-lysine coated glass bottom dishes (D141410, Matsunami Glass Ind.), using the Lipofectamine® RNAiMAX method (Invitrogen) as described by the manufacturer, except that Opti-MEM was replaced by (serum-free) DMEM/F10. After 24 hours, transfection medium was replaced by regular culture medium. Cells were harvested at the indicated time points and processed for further analysis.
In a subset of experiments, the cell cycle of proliferating cells was synchronized by treatment of cell cultures with 2.5 mM thymidine (Sigma), starting 48 hours after RNAi transfection. After 24 hours, cells were released from thymidine block by washing 3 times with PBS and harvested at the indicated time points.
Time-lapse fluorescence microscopy
For time-lapse recording of circadian clock and cell cycle progression, cells (transfected and grown on glass bottom dishes) were placed in the temperature (37°C), CO2 (5%) and humidity controlled chamber of a live cell imaging Zeiss LSM510/Axiovert 200M confocal microscope, equipped with a 10x Ph objective. Images were recorded every 30 min for 72 hours or more using a Coolsnap HQ/Andor Neo sCMOS camera. Live cell imaging was conducted using the following parameters (as set up in Zeiss 200 software): Venus (green): 1000 ms (filter cube: Ex = 475/40 nm, DM = 500 nm, Em = 530/50 nm); mKO2 (red): 300 ms (filter cube: Ex = 534/20 nm, DM = 552 nm, Em: 572/38 nm); CFP (blue): 300 ms (filter cube: Ex = 458/17 nm, DM = 450 nm, Em: 479/40 nm). Acquired images were concatenated and merged into a single file to generate a movie which was used for further analysis as described in detail by Feillet and coworkers (Feillet et al., 2014). In short, single-cell numerical time series for each of the fluorescent markers were generated using the LineageTracker plugin for ImageJ (https://github.com/pkrusche/lineagetracker.jsonexport). Time series were analyzed for circadian cycle length, cell cycle length and G1 and S/G2/M cell cycle phase length. The G1 phase is defined as the interval between the peaks of hGeminin-CFP and hCDT1-mKOrange expression. Oppositely, the S/G2/M phase is defined as the interval between the peaks of hCDT1-mKOrange and hGeminin-CFP expression.
mRNA and protein analysis
Gene expression levels were determined by quantitative RT-PCR. Total RNA was isolated from cultured cells in triplicate using TRIzol (Invitrogen) following manufacturer’s instructions. First-strand cDNA was synthesized from 1 μg of total RNA using oligo (dT) primers and SuperScript reverse transcriptase (Invitrogen) according to the manufacturer’s protocol. Quantitative PCR amplification was performed using the iCycler iQ™ Real-Time PCR Detection System (BioRad), with SYBR-green and primer sets generating intron-spanning products of 150–300 bp. The following forward and reverse primers were used: Bmal1: Fwd 5ʹ-AAG CTT CTG CAC AAT CCA CAG CAC-3ʹ and Rev 5ʹ-TGT CTG GCT CAT TGT CTT CGT CCA-3ʹ; Clock: Fwd 5ʹ-CTT CCT GGT AAC GCG AGA AAG −3ʹ and Rev 5ʹ-GTC GAA TCT CAC TAG CAT CTG AC −3ʹ; B2M: Fwd 5ʹ-CCG GCC TGT ATC CAG AAA-3ʹ and Rev 5ʹ-AAT TCA ATG TGA GGC GGG TGG AAC-3ʹ.
Protein expression levels were determined by Western blot analysis. Cells were lysed in RIPA lysis buffer, composed of 2 mM Tris-HCl PH8.0, 1% TX-100, 0.5% NaDOC, 0.1% SDS, 5.15 mM NaCl, 5 mM NaF, 1.25 mM NaVO3, 10 mM EDTA supplemented with a PhosSTOP phosphatase inhibitor tablet (Roche) and a Pierce Protease Inhibitor tablet (ThermoFisher). Lysates were cleared by centrifugation at 13,000 g for 10 minutes at 4°C. Protein concentration was determined using the BCA Protein Assay Reagent (Pierce®, Thermo Scientific). Absorbance was measured at 560 nm using a GloMax-Multi+ Microplate Multimode Reader (Promega). Proteins were loaded on Bis-Tris Plus 4–12% polyacrylamide gel (Novex®, Life technologies), size separated and transferred to a Polyvinylidene fluoride (PVDF) membrane. After blocking with 4% skim milk, membranes were incubated with a primary antibodies (listed below) overnight at 4°C. After washing, membranes were incubated with the secondary antibodies (1:2000 dilution) for 1 hour at 4°C. Protein bands were visualized using Western Lightning™ Chemiluminescence Reagent Plus (PerkinElmer) and autoradiography. Bands were quantified by Fiji® software and normalized against to β-actin protein levels.
Antibodies used: Primary antibodies: Actin C-2 (sc8432), BMAL1 (sc48790), CLOCK (sc25361), Cyclin B1 (sc245), Cyclin A (sc751), and WEE1 (sc325) (all Santa Cruz), and Cyclin E (ab7959) and Cyclin D (ab134175), and (all Abcam). Secondary antibodies: goat anti-rabbit IgG (H + L)-HRP conjugate or goat anti-mouse IgG (H + L)-HRP conjugate.
Flow cytometry
To analyze cell cycle status by quantification of DNA content, cells were harvested 48 hours after siRNA transfection, washed with PBS, and fixed overnight at 4°C with cold 70% ethanol. Next, fixed cells were washed with PBS, treated for 15 min at 37°C with PBS containing 100 μg/ml bovine pancreas RNase (Calbiochem), and left overnight at 4°C in PBS with 40 μg/ml propidium iodide (PI; Life Technologies). Alternatively, to specifically detect mitotic cells, fixed cells were stained for the presence of the MPM-2 phospho-epitope on DNA topoisomerase IIα, using mouse anti-MPM2 primary antibodies (Merck-Millipore; dilution 1:200; 1 h on ice) and goat-anti mouse FITC secondary antibodies (Jackson ImmunoResearch; dilution 1:50; 30 min on ice). Cells were analyzed by a Becton Dickinson LSRFortessaTM Cell Analyzer (BD Biosiences). PI and FITC fluorescence intensities were measured at 610 nm and 530 nm, respectively. For each condition, at least 20,000 cells were counted. Frequency histograms were made using BD FACSDivaTM software (BD Biosciences).
DNA synthesis assay
DNA synthesis was determined using the Click-iT® EdU Alexa Fluor® 594 Imaging Kit (Invitrogen). Cells were pulse labelled with 5-ethynyl-2ʹ-deoxyuridine (EdU) for 1 hour, fixed with 3.7% formaldehyde, and incubated with Alexa Fluor® 594 according to the manufacturer’s instructions. Images were generated using a Zeiss Axiovert 200M microscope and processed using ImageJ software. For each image, total intensity was normalized to the number of cells.
Mathematical modeling
To study the interaction between the circadian clock and the cell cycle we used two computational models previously proposed for the mammalian circadian clock and for the mammalian cell cycle, respectively. The model for the mammalian circadian clock incorporates the positive and negative regulations involving the PER, CRY, CLOCK, BMAL1 and REV-ERBα proteins [Citation29,Citation30]. This model (in which, for simplicity, PER1 and PER2, as well as CRY1 and CRY2 are treated as single entities) accounts for the occurrence of spontaneous circadian oscillations of the above-mentioned proteins and their mRNAs in a variety of experimental conditions.
The model for the mammalian cell cycle is based on the regulatory properties of the CDK network that drives the transitions between the successive phases of the cell cycle [Citation6,Citation31]. The model contains four CDK modules, each of which controls the transition to a particular cell cycle phase. Thus, Cyclin D/CDK4-6 and Cyclin E/CDK2 promote progression in G1 and elicit the G1/S transition; the activation of Cyclin A/CDK2 ensures progression in S and G2, while the peak of Cyclin B/CDK1 activity brings about progression into mitosis. Exit from the quiescent state is triggered above a critical level of growth factor by the synthesis of Cyclin D, which allows cells to enter the G1 phase. Synthesis of the various cyclins is regulated through the balance between the antagonistic effects exerted by the transcription factor E2F and the tumor suppressor pRB, which respectively promote and inhibit cell cycle progression. Additional regulations in this model for the CDK network bear on the control exerted by the proteins SKP2, CDH1, or CDC20 on the degradation of cyclins E, A, and B at the G1/S or G2/M transitions, respectively. Moreover, the activity of each cyclin/CDK complex can itself be regulated through CDK phosphorylation-dephosphorylation. At suprathreshold levels of growth factor sustained oscillations spontaneously occur in the CDK network, which may be associated with cellular proliferation since they correspond to the repetitive, sequential activation of the various cyclin-CDK complexes responsible for the ordered progression along the successive phases of the cell cycle [Citation6,Citation31].
The cell cycle is coupled to the circadian clock through several molecular processes (see above), such as the induction of Wee1 expression by CLOCK/BMAL1. Such coupling may lead to entrainment of the cell cycle by the circadian clock [Citation32]. The equations governing the models for the coupled circadian clock and cell cycle models are given in the Supporting Information section. Here we focus on the case where the cell cycle is coupled to the circadian control via the induction of Wee1 gene expression by CLOCK/BMAL1. We also introduce coupling via the induction of Cnnb1 (Cyclin B1) gene expression by CLOCK/BMAL1, as suggested by the experiments reported in the present study. To model the impact of knockdown of Bmal1 gene expression, we reduce the rate of Bmal1 mRNA synthesis (measured by parameter vsB) in the model for the circadian clock.
Statistical analysis
All statistical analyses were carried out with GraphPad software. For single-cell studies, after performing the normality test, the two-tailed Mann-Whitney U-test was used to analyze the period of the circadian and cell cycle clocks (including G1, S/G2/M phase length). For Western blot, flow cytometry, and immunofluorescence experiments, the two-tailed Student’s t-test was applied.
Supplemental Material
Download PDF (1.1 MB)Acknowledgments
This work was supported by grants from the Netherlands Organization for Scientific Research (ZonMW/EraSysBio+ grant nr. 90.201.127, “Circadian and cell cycle clock systems in cancer: C5Sys”), the Netherlands Genomics Initiative (grant nr. 050-060-510, “Netherlands Toxicogenomics Center”) and an Erasmus University Medical Center Mrace PhD grant (“The relation between the circadian clock, cell cycle, and cancer”) to GTJvdH. Work by AG was supported by FRS-FNRS (CDR grant nr. 26027580, “Auto-organisation in cell signalling”). The research stay of JY at ULB (Brussels) was supported by the Chinese Scholar Council. Her subsequent work in Suzhou receives financial support from the National Natural Science Foundation of China (grant nr. 11671417). We are grateful to the members of the C5Sys project for many useful discussions.
Disclosure statement
No potential conflict of interest was reported by the authors.
Additional information
Funding
Related Research Data
References
- Takahashi JS, Hong HK, Ko CH, et al. The genetics of mammalian circadian order and disorder: implications for physiology and disease. Nat Rev Genet. 2008;9:764–775.
- Mohawk JA, Green CB, Takahashi JS. Central and peripheral circadian clocks in mammals. Annu Rev Neurosci. 2012;35:445–462.
- Gallego M, Virshup DM. Post-translational modifications regulate the ticking of the circadian clock. Nat Rev Mol Cell Biol. 2007;8:139–148.
- Stojkovic K, Wing SS, Cermakian N. A central role for ubiquitination within a circadian clock protein modification code. Front Mol Neurosci. 2014;10:3389.
- Tyson J, Novak B. Temporal organization of the cell cycle. Curr Biol. 2008;18:R759–R768.
- Gérard C, Goldbeter A. Temporal self-organization of the cyclin/Cdk network driving the mammalian cell cycle. Proc Natl Acad Sci USA. 2009;106:21643–21648.
- Henley SA, Dick FA. The retinoblastoma family of proteins and their regulatory functions in the mammalian cell division cycle. Cell Div. 2012;7:10.
- Koff A, Giordano A, Desai D, et al. Formation and activation of a cyclin E-CDK2 complex during the G1 phase of the human cell cycle. Science. 1992;257:1689–1694.
- Jackson PK, Chevalier S, Philippe M, et al. Early events in DNA replication require cyclin E and are blocked by p21CIP1. J Cell Biol. 1995;130:755–769.
- Erlandsson F, Linnman C, Ekholm S, et al. A detailed analysis of Cyclin A accumulation at the G1/S border in normal and transformed cells. Exp Cell Res. 2000;295:86–95.
- Coverley D, Laman H, Laskey RA. Distinct roles for cyclins E and A during DNA replication complex assembly and activation. Nat Cell Biol. 2002;4:523–528.
- Kalaszczynska I, Geng Y, Iino T, et al. Cyclin A is redundant in fibroblasts but essential in hematopoietic and embryonic stem cells. Cell. 2009;138:352–365.
- Girard F, Strausfeld U, Fernandez A, et al. Cyclin A is required for the onset of DNA replication in mammalian fibroblasts. Cell. 1991;67:1169–1179.
- Pagano M, Pepperkok R, Verde F, et al. Cyclin A is required at two points in the human cell cycle. EMBO J. 1992;11:961–971.
- Gavet O, Pines J. Progressive activation of CyclinB1-Cdk1 coordinates entry to mitosis. Dev Cell. 2010;18:533–543.
- Lindqvist A, Rodriguez-Bravo R, Medema RH. The decision to enter mitosis: feedback and redundancy in the mitotic entry network. Cell Biol. 2009;185:193–202.
- Fung TK, Poon RYC. A roller coaster ride with the mitotic cyclins. Sem Cell Dev Biol. 2005;16:335–342.
- Mueller PR, Coleman TR, Kumagai A, et al. Myt1: a membrane-associated inhibitory kinase that phosphorylates Cdc2 on both threonine-14 and tyrosine-15. Science. 1995;270:86–90.
- Parker LL, Piwnica-Worms H. Inactivation of the p34cdc2-cyclin B complex by the human WEE1 tyrosine kinase. Science. 1992;257:1955–1957.
- Bjarnason GA, Jordan RCK, Sothern RB. Circadian variation in the expression of cell-cycle proteins in human oral epithelium. Am J Pathol. 1999;154:613–622.
- Bjarnason GA, Jordan RCK, Wood PA, et al. Circadian expression of clock genes in human oral mucosa and skin. Am J Pathol. 2001;158:1793–1801.
- Matsuo T, Yamaguchi S, Mitsui S, et al. Control mechanism of the circadian clock for timing of cell division in vivo. Science. 2003;302:255–259.
- Gréchez-Cassiau A, Rayet B, Guillaumond F, et al. The circadian clock component BMAL1 is a critical regulator of p21WAF1/CIP1 expression and hepatocyte proliferation. J Biol Chem. 2008;283:4535–4542.
- Kowalska E, Ripperger JA, Hoegger DC, et al. NONO couples the circadian clock to the cell cycle. Proc Natl Acad Sci USA. 2013;110:1592–1599.
- Zhao X, Hirota T, Han X, et al. Circadian amplitude regulation via FBXW7-targeted REV-ERBα degradation. Cell. 2016;165:1644–1657.
- Nagoshi E, Saini C, Bauer C, et al. Circadian gene expression in individual fibroblasts: cell-autonomous and self-sustained oscillators pass time to daughter cells. Cell. 2004;119:693–705.
- Bieler J, Cannavo R, Gustafson K, et al. Robust synchronization of coupled circadian and cell cycle oscillators in single mammalian cells. Mol Syst Biol. 2014;10:739.
- Feillet C, Krusche P, Tamanini F, et al. Phase locking and multiple oscillating attractors for the coupled mammalian clock and cell cycle. Proc Natl Acad Sci USA. 2014;111:9828–9833.
- Leloup JC, Goldbeter A. Toward a detailed computational model for the mammalian circadian clock. Proc Natl Acad Sci USA. 2003;110:7051–7056.
- Leloup JC, Goldbeter A. Modeling the mammalian circadian clock: sensitivity analysis and multiplicity of oscillatory mechanisms. J Theor Biol. 2004;230:541–562.
- Gérard C, Goldbeter A. The balance between cell cycle arrest and cell proliferation: control by the extracellular matrix and by contact inhibition. Interface Focus. 2014;4:20130075.
- Gérard C, Goldbeter A. Entrainment of the mammalian cell cycle by the circadian clock: modeling two coupled cellular rhythms. PLoS Comput Biol. 2012;8:e1002516.
- Traynard P, Feillet C, Soliman S, et al. Model-based investigation of the circadian clock and cell cycle coupling in mouse embryonic fibroblasts: prediction of RevErb-α up-regulation during mitosis. Biosystems. 2016;149:59–69.
- Paijmans J, Bosman M, Ten Wolde PR, et al. Discrete gene replication events drive coupling between the cell cycle and circadian clocks. Proc Natl Acad Sci USA. 2016;113:4063–4068.
- Cogswell JP, Godlevski MM, Bonham M, et al. Upstream stimulatory factor regulates expression of the cell cycle-dependent cyclin B1 gene promoter. Mol Cell Biol. 1995;15:2782–2790.
- Wasner M, Tschöp K, Spiesbach K, et al. Cyclin B1 transcription is enhanced by the p300 coactivator and regulated during the cell cycle by a CHR-dependent repression mechanism. FEBS Lett. 2003;536:66–70.
- Gao XN, Lin J, Ning QY, et al. A histone acetyltransferase p300 inhibitor C646 induces cell cycle arrest and apoptosis selectively in AML1-ETO-positive AML cells. PLoS One. 2013;8:e55481.
- Yan G, Eller MS, Elm C, et al. Selective inhibition of p300 HAT blocks cell cycle progression, induces cellular senescence, and inhibits the DNA damage response in melanoma cells. J Invest Dermatol. 2013;133:2444–2452.
- Mullenders J, Fabius AW, Madiredjo M, et al. A large scale shRNA barcode screen identifies the circadian clock component ARNTL as putative regulator of the p53 tumor suppressor pathway. PLoS One. 2009;4:e4798.
- Jiang W, Zhao S, Jiang X, et al. The circadian clock gene Bmal1 acts as a potential anti-oncogene in pancreatic cancer by activating the p53 tumor suppressor pathway. Cancer Lett. 2016;371:314–325.
- Innocente SA, Abrahamson JLA, Cogswell JP, et al. p53 regulates a G2 checkpoint through Cyclin B1. Proc Natl Acad Sci USA. 1999;96:2147–2152.
- Gotoh T, Kim JK, Liu J, et al. Model-driven experimental approach reveals the complex regulatory distribution of p53 by the circadian factor Period 2. Proc Natl Acad Sci USA. 2016;113:13516–13521.
- Bouchard-Cannon P, Mendoza-Viveros L, Yuen A, et al. The circadian molecular clock regulates adult hippocampal neurogenesis by controlling the timing of cell-cycle entry and exit. Cell Rep. 2013;5:961–973.
- Androic I, Krämer A, Yan R, et al. Targeting cyclin B1 inhibits proliferation and sensitizes breast cancer cells to taxol. BMC Cancer. 2008;8:391.