
ABSTRACT
Considerable advancements have recently been achieved in porcine somatic cell nuclear transfer (SCNT), but the efficiency remains low. Donor cell size might play an important role in SCNT, but its effects in pigs remain unclear. This study aimed to evaluate the efficiency of porcine SCNT by selecting donor cells of suitable size. Porcine fetal fibroblasts (PFFs) were divided into three groups, group S (small, d ≤ 13 μm), group M (medium, 13 μm<d ≤ 18 μm), and group L (large, d > 18 μm), and their biological characteristics were analyzed. Next, SCNT was performed using PFFs of different sizes to evaluate the developmental potential of reconstructed embryos. The data showed that PFFs in groups S, M and L accounted for 17.5%, 47.7% and 34.8% of cells, respectively. Morphologically, cells in group S exhibited clear and regular cell membranes and nuclei, whereas cells in groups M and L displayed varying degrees of cell membrane protuberance, karyo-pyknosis, autophagy and mitochondrial abnormalities. In addition, the growth status and proliferation capabilities of cells in group S were significantly better than those of group M and group L. The percentage of cells at G0/G1 in group S and M were significantly greater than group L. The senescence rate of group S was lower than group M and group L. The apoptosis rate of group S was significantly lower than that of group L but comparable to that of group M . The cleavage rate of group S was also significantly greater than that of group M but comparable to that of group L . The blastocyst rate of group S was significantly greater than that of group M and group L. The blastocyst cell numbers of group S were also significantly greater than those of group M and group L. These findings suggested that small PFFs with a diameter of less than 13 μm are more suitable donor cells for SCNT in pigs.
Abbreviations: DMEM: Dulbecco’s modified Eagle’s medium; FBS: Fetal bovine serum; PBS: Phosphate buffer saline; PFFs: Porcine fetal fibroblast cells; SCNT: Somatic cell nuclear transfer.
Introduction
Somatic cell nuclear transfer (SCNT) has been successfully achieved in a variety of mammals, including sheep, cows, macaque monkeys and pigs [Citation1]. Genetically engineered pigs from SCNT have been widely used in livestock production and biomedical research [Citation2]. However, the efficiency of SCNT is extremely low in most species at only 1.0%~5.0% in pigs [Citation3,Citation4], and cloned offspring are also prone to various abnormalities, such as low immunity, reproductive disorders, organ deformities and other phenotypic defects [Citation5,Citation6]. With advancements in omics technology, it was uncovered that some events play an important role in SCNT [Citation7], including histone methylation [Citation8,Citation9] and imprinted gene disorders [Citation10]. However, the addition of some substances, such as trichostatin A (TSA) [Citation11] and KDM6A [Citation12], has also successfully improved the invitro development of SCNT reconstructed embryos. Although these strategies have made a prodigious encroachment in SCNT, it remains unclear how the direct selection of dominant donor cells will impact the development of SCNT-derived embryos.
The quality of donor cells is one of the key factors affecting the reprogramming efficiency and developmental potential of SCNT-derived embryos [Citation5]. It has previously been reported that donor cell type [Citation13,Citation14], passage number [Citation15], cell synchronization [Citation16], epigenetic levels [Citation15,Citation17], and donor cell culture methods [Citation18] affect SCNT efficiency. In porcine SCNT, skin fibroblasts are commonly used as donor cells [Citation19], however, skin fibroblast proliferation is limited during long-term in vitro culture and passaging [Citation20]. Long-term in vitro culture also increases cell apoptosis and senescence, thus reducing cell viability, leading to chromosomal rearrangement or damaged mutations, and even disrupting the normal diploid state of cells [Citation21]. The senescence rate of donor cells significantly increased with cell passaging in goat SCNT. High-passage cells (30th) had a significantly lower development potential than low-passage cells (10th or 20th) [Citation22]. Thus, the selection of low-passage donor cells for SCNT might be better. In addition, cell size also plays an important role in the efficiency of SCNT [Citation23], as the developmental competence of reconstructed embryos from small donor cells (d< 30 μm) was greater than that of large donor cells (d > 30 μm) in bovine SCNT. Medium-size donor cells (15 μm<d < 25 μm) were better than large- (25 μm<d < 33 μm) and small-size donor cells (8 μm<d < 15 μm) in sheep SCNT [Citation24]. Therefore, we inferred that selection of certain sized cells in a low-passage donor cell population will be better for porcine SCNT. However, differences in the morphology, proliferation, apoptosis, and senescence of these different sized donor cells and their effect on the development of pig cloned embryos remain unclear.
In this study, we explored the development of porcine SCNT reconstructed embryos by selecting donor cell size, investigated the biological characteristics of porcine fetal fibroblasts (PFFs) of different sizes and evaluated their effects on the developmental competence of reconstructed embryos.
Methods
Chemicals and animals
All chemicals were purchased from Sigma-Aldrich (St. Louis, MO, USA) unless otherwise stated. The Diannan miniature pigs used in this study were regularly maintained at the Animal Center of Yunnan Agricultural University. All experiments involving pigs were approved by the Institutional Animal Care and Use Committee of Yunnan Agricultural University (permission code: YAUACUC01; publication date: 10 July 2013).
Culture and classification of PFFs
The Diannan miniature porcine fetus was removed surgically at 33 days gestation and placed in Dulbecco’s modified Eagle’s medium (DMEM) containing 5% penicillin-streptomycin solution. Fetal fibroblasts were isolated from fetal skin tissues as reported previously [Citation25] and cultured in DMEM supplemented with 10% fetal bovine serum (FBS). Briefly, some of the isolated cells were cultured in 24-well plates at 38°C in an incubator with 5% CO2. The cell growth status was observed once daily. The fibroblasts were passaged for 4 ~ 6 generations. Once the cells reached 40%~60% confluence, they were digested with 0.25% trypsin for 30 ~ 60 seconds at room temperature. Then, 1 mL DMEM supplemented with 2.0% FBS was added to stop digestion. The cell suspension was centrifuged at 1200 rpm for 3 min at room temperature. Then, the cells were placed in DMEM supplemented with 2.0% FBS for classification.
The digested PFFs were initially divided into three groups, small (S), medium (M) and large (L), by the naked eye using a microinjection needle. Briefly, we can visually distinguish the larger cells from the cell population; thus, we first selected the large cells. Next, we selected small cells from the remaining cell population. Finally, the remaining cells were classified as medium cells. The cell diameter was measured by NIS-Elements D 4.60.00 software (Nikon Bioimaging Lab, Japan). To assess the feasibility of such classification method, multiple repeated operations were performed as described above. Histograms of cell diameter distribution were also plotted.
Cell morphological observation
The cells from groups S, M and L were placed on glass slides in 24-well plates at 38°C in an incubator with 5% CO2. After 3 days of culture, the cell morphology of groups S, M and L was observed under an optical microscope. Thereafter, the cells were fixed in 4.0% formaldehyde and stained with 10% Giemsa stain (Solarbio, G1015, Beijing, China). After multiple washes, the plates were air dried and imaged. The numbers of vacuoles scattered were counted, and statistical analysis was performed.
The cells from groups S, M and L were placed on a glass slide, covered gently with a glass cover slip and observed under an optical microscope at different magnifications (10×, 40×, and 100×). The cell membrane differences in each group were compared.
Transmission electron microscope observation
Electron microscopy was performed as reported previously [Citation26]. Cells were placed in a 1.5-mL centrifuge tube, fixed with glutaraldehyde (2.5 ~ 3.0% in PBS) for one hour and then sent to the Central Laboratory of Kunming Institute of Zoology, Chinese Academy of Sciences, Kunming, Yunnan for detection. In detail, samples were fixed with 1% OsO4 for 2 h at 4°C, dehydrated continuously by ethanol and embedded in Epon 812 resin. Serial sections of uniform thicknesses (approximately 60 nm) were made using a Leica UC7 ultramicrotome. After staining with 2% uranyl acetate and lead citrate, ultrathin sections were examined using a transmission electron microscope (JEM 1400 plus, JEOL, Japan), and differences in the microstructure of cells with different sizes were compared and analyzed at 120 kV.
Cell proliferation assay
The cells from groups S, M and L were cultured as a single cell to evaluate cell proliferation and viability. Culture medium was changed every 3 days. Cell growth was observed and counted under a microscope for 12 days, and the growth curve of cell proliferation was plotted. To perform the colony formation assay, the number of colonies was counted under a microscope, and the cell colony formation rate was calculated as (number of cell clones/100) *100%.
SA-β-gal staining
Cell senescence detection was performed as reported previously [Citation27]. Cells from groups S, M and L were cultured overnight, washed with PBS and stained with SA-β-gal according to the manufacturer’s instructions (Solarbio Life Sciences). Briefly, cells were fixed with 1 mL fixative for 15 min at room temperature in the dark. After 3 washes with PBS for 3 min cells were stained in 500 μL SA-β-gal staining solution overnight at 37°C and then counted under an optical microscope.
Cell apoptosis analysis
Cell apoptosis in groups S, M and L was analyzed according to a previously reported protocol [Citation28] using an Annexin V-fluorescein isothiocyanate (FITC) Apoptosis Detection Kit I (BD Pharmingen). Briefly, cells were collected in 1.5-mL tubes, washed with PBS and digested with trypsin (without EDTA). After the digestion was stopped by adding the cell culture supernatant, cells were transferred to 1.5-mL tubes and centrifuged at 1000 g for 5 min. The supernatant was discarded, and the pellet was resuspended in PBS. A total of 5 × 10⁴ cells were counted and centrifuged at 1000 g for 5 minutes, and the supernatant was discarded. Cells were again centrifuged and resuspended in 500 μL of binding buffer containing 5 μL Annexin V/FITC and 5 μL propidium iodide and incubated for 15 min at room temperature in the dark. In total, 10,000 cells from different groups were collected and analyzed for apoptosis by flow cytometry (BD FACSCalibur). Cells undergoing apoptosis were defined as early apoptotic cells (Annexin V-FITC-positive/PI-negative) and late apoptotic cells (Annexin V-FITC-positive/PI-positive).
Cell cycle analysis
The cell cycle was analyzed according to the instructions of the Cell Cycle and Apoptosis Analysis Kit (Beyotime Biotechnology, China). Briefly, cells were plated into 6-dish plates and cultured for 2 days in DMEM supplemented with 10% FBS. Then, the cells were collected, fixed in 70% ethanol and stored at −20°C. The cells were then resuspended in cold PBS and incubated at 38°C for 30 min according to the manufacturer’s instructions. DNA content analysis was performed by flow cytometry at 488 nm (BD, San Diego, CA, USA). The percentages of groups S, M and L in different cell cycle phases were determined using NIS-Elements D 4.60.00 software.
Somatic cell nuclear transfer (SCNT)
SCNT was performed according to our previously published paper [Citation25]. Briefly, after 4 ~ 6 passages, cells were divided into groups S, M, and L and used as nuclear donors. A single donor cell was inserted into the perivitelline space of an enucleated oocyte and then fused and activated. The reconstructed embryos from different donor cells were cultured in porcine zygote medium-3 (PZM-3).
In vitro development of SCNT-derived embryos
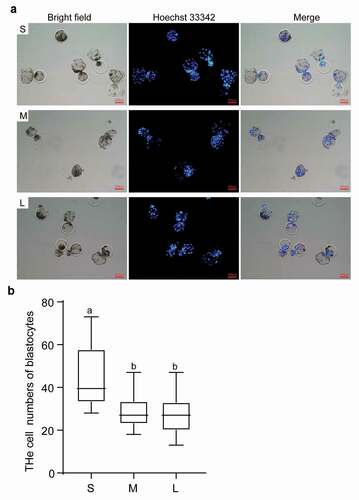
The cleavage rate and blastocyst rate of reconstructed embryos were evaluated on days 2 and 7 of in vitro culture, respectively. To count the blastocyst cell number, the blastocysts were first fixed in 4% paraformaldehyde (in PBS) for 30 min and then exposed to 5 µg/mL Hoechst 33,342 for 10 min. Cell counting was performed under a fluorescence microscope (IX71, OLYMPUS, Japan), and images were captured and processed using cellSens Standard 1.6 software.
Statistical analysis
All experiments were repeated at least thrice. Statistical analysis was performed by one-way ANOVA using IBM SPSS Statistics version 22.0 (IBM Crop, Armonk, NY), and the comparison between growth curves of cell proliferation was performed using the web method (http://bioinf.wehi.edu.au/software/compareCurves/). Data are presented as means ± SD. The level of significance was set at P< 0.05.
Results
Classification and proportion of PFFs of different sizes
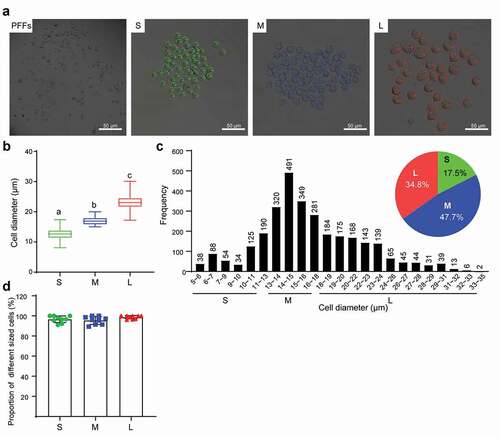
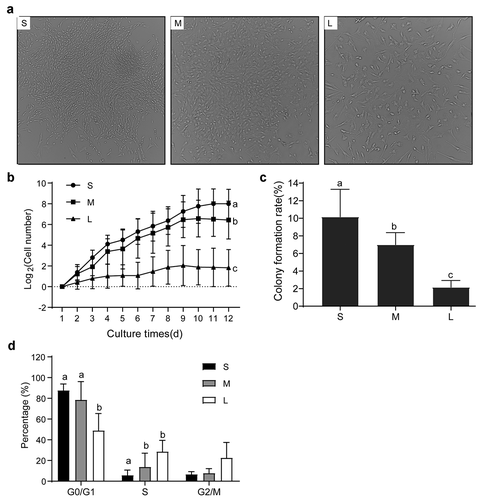
We collected a total of 3024 PFFs and divided them into three groups by the naked eye under a microscope ()). Significant differences in cell diameter were noted among the three groups, and the average cell diameters in the three groups were 12.6 μm, 16.7 μm and 23.3 μm (P< 0.05, )). Combined with the histogram, we defined small cells (S) with diameter (d ≤ 13 μm), medium cells (M) with diameter (13 μm<d ≤ 18 μm) and large cells (L) with diameter (d > 18 μm). The proportions of cells in groups S, M and L were 17.5% (529/3024), 47.7% (1441/3024), and 34.8% (1054/3024), respectively ()). Thereafter, to evaluate the reliability of this classification method, we performed a ninefold replicate operation to divide the PFFs into three groups. Cells with a diameter less than 13 μm accounted for 96.66%±3.13%, cells with a diameter of 13 μm<d ≤ 18 μm accounted for 95.51%±3.70%, and cells with a diameter >18 μm accounted for 98.69%±1.58% ()). Therefore, the classification results of PFFs by the naked eye was consistent with the range of cell diameters we defined as above.
Figure 1. Diameter measurement and classification of PFFs. A. PFFs were divided into three groups based on microscopic assessment. PFFs, porcine fetal fibroblasts; S, small; M, medium; L, large. B. Measurement of cell’s diameter. C. Diameter distribution diagrams and pie graph of PFFs. Green, blue and red represent small cells, medium cells and large cells, respectively. D. Verification of reliability of classification method by ninefold replicate operation. The results are presented as the mean±SD. Data are representative of three independent experiments (a, b, cP<0.05)
Morphological changes in PFFs with different sizes
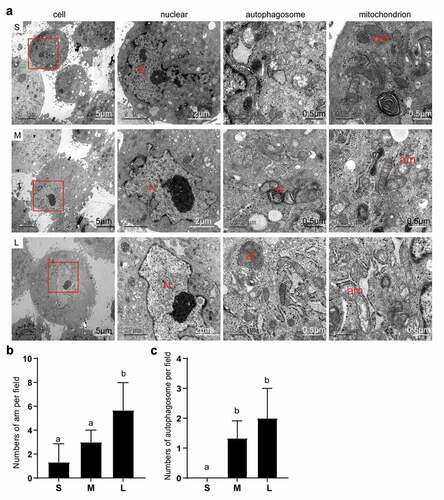
First, we observed obvious morphological differences in PFFs of different sizes. After 3 days of culture, the cells in group S appeared to have a clear spindle shape, but some of the cells in group M and a large number of cells in group L appeared flat ()). Notably, group L had an incomplete and unclear cell contour with large numbers of vacuoles scattered in the cytoplasm ()). In addition, microscopic analysis revealed varying degrees of roughness in the cell membrane of different sized cells ()). In group S, the PFFs had regular morphology with clear cell membrane contours. In group M, the PFFs manifested slightly irregular protrusions on the surface of the cell membrane. In group L, the PFFs showed obvious irregular protrusions and rough cell membrane structures ()). The observation of subcellular structure showed that the cells in group S manifested nucleolar margination. However, cells in group M exhibited nuclear invagination, and nuclear pyknosis was observed in group L ()). Furthermore, M- and L-sized cells also showed different degrees of autophagy and mitochondrial abnormalities. Significantly more abnormal mitochondria were noted in group L compared with groups M and S (P< 0.05, )), and more autophagosomes are noted in groups M and L than group S (P< 0.05, )).
Figure 2. Microscopic assessment of morphological structure of PFFs of different sizes. A. Morphological structure of small (s), medium (m) and large (l) cells as assessed by microscopy (10×). B. Phenotype of vacuoles in small (S), medium (M) and large (L) cells as assessed by microscopy (40×); the red arrow refers to the clear vacuoles. C. Quantitative analysis of vacuoles scattered in different sized PFFs. The results are presented as the mean±SD. Data are representative of three independent experiments (a, b, cP<0.05)
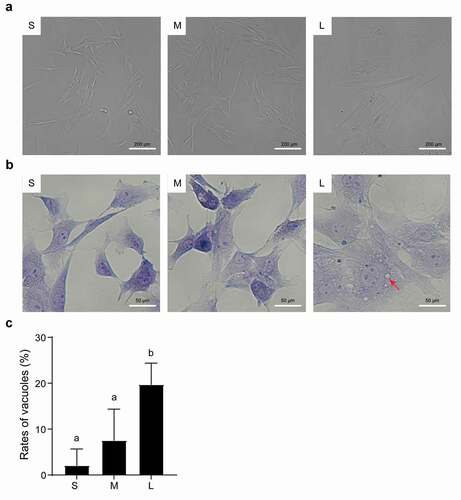
Figure 3. Microscopic assessment of cell membrane morphology of PFFs of different sizes. A. The different degrees of cell membrane roughness of small (s), medium (m) and large (l) cells as assessed by microscopy. B. The cell membrane of small (S), medium (M) and large (L) cells under 10×, 40× and 100× microscopy. The red arrows represent irregular parts of cells
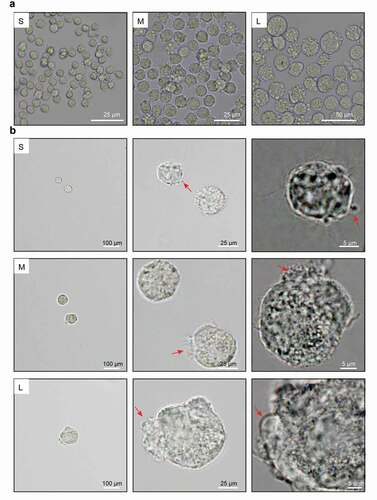
Figure 4. Subcellular structure of different sized PFFs under TEM. A. The subcellular structure of small (s), medium (m) and large (l) cells was observed at 3000×, 10000× and 30000×, which mainly represented the differences in the cell nucleus. N, nucleus; a, autophagosome; al, autolysosome; nm, normal mitochondrion; am, abnormal mitochondrion. B. Quantitative data of abnormal mitochondria in PFFs of different sizes. C. Quantitative data of autophagosomes in PFFs of different sizes. The results are presented as the mean±SD. Data are representative of three independent experiments (a, b, cP<0.05)
Proliferation ability of PFFs with different sizes
The proliferation ability [Citation29] and cell cycle stage [Citation30] of donor cells are critical to the production of cloned pigs by SCNT. To determine any differences in proliferation ability and cell cycle stage among PFFs of different sizes, we analyzed the cellular growth status by growth curve and single-cell colony formation assays and the cell cycle by cell cycle analysis. The results showed that the growth status of cells in group S was better than that in groups M and L after 12 days of culture. The growth of cells in group M was also better than that in group L ()). The proliferation ability of group S was significantly greater than that of groups M and L (P< 0.05). The proliferation ability of group M was also significantly higher than that of group L (P< 0.05, )). The single colony formation rate of group S was significantly greater than that of group L (10.17 ± 3.13% vs 2.17 ± 0.75%, P< 0.05) and group M (10.17 ± 3.13% vs 7.00 ± 1.37%, P< 0.05) ()). In addition, the ratio of G0/G1-phase cells in group S (87.66 ± 6.24%) and group M (78.56 ± 17.62%) was significantly greater (P< 0.05) than that in group L (48.97 ± 16.40%). In contrast, the ratio of S-phase cells in group S was markedly less than that in groups M and L (P< 0.05). However, G2/M-phase cells were comparable among all three groups ()). These findings indicated that the proliferation ability of group S was stronger than those of groups M and L, and the ratio of G0/G1-phase cells in groups S and M was greater than that in group L. These findings suggested that the cells in group S were more capable of SCNT.
Figure 5. Proliferation capability of different sized PFFs. A. Growth status of single cell colonies from different sized cells after 12 days of culture. Magnification, 4×. B. Growth curve of different sized cells. C. Cellular colony formation rates of PFFs of different sizes. D. Cell cycle of different sized cells. The results are presented as the mean±SD. Data are representative of three independent experiments (a, b, cP<0.05)
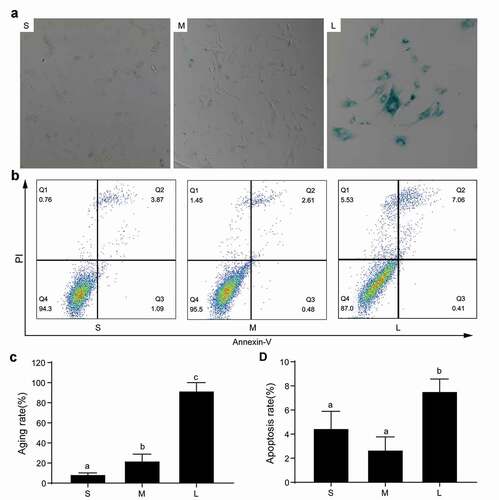
Senescence and apoptosis of PFFs of different sizes
In the production of transgenic cloned pigs, the senescence and apoptosis of donor cells have an important effect on SCNT efficiency [Citation31]. It was reported that large cells easily become senescent because larger cellular sizes cause cytoplasmic dilution, decrease RNA and protein concentrations, and interfere with cell function and proliferation [Citation32]. To analyze the degrees of senescence and apoptosis of PFFs of different sizes, we performed SA-β-gal staining and apoptosis analyses. The results indicated that group S had the lowest cell senescence rate followed by group M, and group L had the highest cell senescence rate (8.87 ± 1.30% vs 22.33 ± 6.50% vs 92.00 ± 8.1%, P< 0.05, )). Furthermore, the apoptosis rates of group S and group M were comparable (4.49 ± 1.40% vs 2.70 ± 1.07%, P> 0.05), but the rates in both groups were significantly lower than group L (7.56 ± 1.01%, P< 0.05, )). The results also suggested that the PFFs in group S were more suitable for porcine SCNT.
Figure 6. Senescence and apoptosis of PFFs of different sizes. A. SA-β-gal-stained PFFs of different sizes. B. The apoptotic rates of different sized PFFs as assessed by flow cytometry. Magnification, 10×. PI and Annexin V staining was used to determine the percentage of live (PI−/Annexin V-FITC−), early apoptotic (PI−/Annexin V-FITC+) and apoptotic or necrotic (PI+/Annexin V-FITC+) cells. C. Quantitative data of senescence in different sized PFFs. D. Quantitative data of apoptosis in PFFs of different sizes. Data are presented as the mean±SD of three independent experiments (a, b, cP<0.05)
Developmental competence of reconstructed embryos of PFFs of different sizes
Given that the PFFs in group S have optimal proliferation ability and lower senescence and apoptosis rates, we asked whether the PFFs in group S exhibit better in vitro developmental competence as donor cells for SCNT. We evaluated the cleavage rate, blastocyst rate, and blastocyst cell numbers of reconstructed embryos from donor cells of different sizes. The results indicated that the cleavage rate from group S was significantly greater than that from group M (73.84 ± 10.08% vs 67.85 ± 10.95%, P< 0.05) but comparable to that from group L (73.84 ± 10.08% vs 70.03 ± 8.33%, P> 0.05). The cleavage rate of group L was also significantly greater than that of group M (70.03 ± 8.33% vs 67.85 ± 10.95%, P< 0.05). The blastocyst rate of the reconstructed embryos from group S was significantly greater than that of group M (19.62 ± 8.61% vs 14.77 ± 5.84%, P< 0.05) and group L (19.62 ± 8.61% vs 13.72 ± 4.50%, P< 0.05). The blastocyst rates of reconstructed embryos from group M and group L were comparable (14.77 ± 5.87% vs 13.72 ± 4.50%, P> 0.05) (). Furthermore, blastocysts with more cells were derived from group S than group M (45.16 ± 13.88 vs 29.59 ± 58.44) and group L (45.16 ± 13.88 vs 26.8 ± 9.04) (P< 0.05, )). In summary, we recommend that the use of small PFFs with diameters less than 13 μm as donor cells for porcine SCNT might yield better results.
Table 1. Effects of different diameter donor cells on the development of SCNT embryos
Figure 7. Effects of different sized PFFs on the blastocyst formation. A. The blastocysts derived from different sized PFFs for SCNT. Scale bar = 200 μm. B. The cell numbers of blastocysts. Data are presented as mean±SD of three independent experiments (a, b, cP<0.05)
Discussion
The PFFs were also sorted into small, medium and large sizes by flow cytometry, but the cell diameter was not defined in a previous report [Citation33]. Flow cytometric selection caused some physical damage, and the size of donor cells suitable for SCNT also remained unexplored. Here, the classification of cell size was performed by the naked eye under a microscope. This method is quite simple and practical and can be used to directly select certain-sized cells for transfer into enucleated oocytes. By analyzing the cellular morphology, proliferation ability, senescence, apoptosis and invitro developmental competence of embryos in different sized cells, we finally determined that donor cells with a diameter less than 13 μm might be optimal for SCNT.
Large donor cells are widely considered unsuitable for SCNT. These cells are generally accompanied by rough cellular membranes and irregular protrusions, stagnate at G2/M phase before division [Citation34], and undergo increased senescence, heterogeneity and protein dysfunction [Citation35]. Here, the large PFFs also exhibited rough cell membranes, nuclear pyknosis, increased mitochondrial abnormalities, low proliferation capability, and elevated senescence and apoptosis rates. In sheep and cattle, medium cells with a diameter of 15 μm<d < 25 μm were considered optimal for SCNT given the higher blastocyst rate [Citation24,Citation36]. A reasonable interpretation from the authors was that small cells were less likely to come into contact with the oocyte cell, whereas large cells were more likely to be distorted. Both of these features make fusion with oocyte cells difficult [Citation36]. However, we detected the cell fusion rate between PFFs of different sizes and observed no difference in cell fusion with oocyte cells (Table S1). In this study, small PFFs (d ≤ 13 μm) had a higher blastocyst rate than medium and large PFFs. Therefore, we considered that small cells might be better for SCNT in pigs. In addition to cell size, other markers, such as H3K27me3 [Citation12], H3K4me3 [Citation37], and H3K9me3 [Citation8], also have an important effect on SCNT success. It has been verified that modulation of the degrees of histone methylation can improve SCNT efficiency [Citation10]. Therefore, selection of donor cells combined with regulation of histone methylation might be more effective for improving SCNT efficiency. In addition, medium cells exhibited better growth states and proliferation ability than large cells, but the cleavage rate, blastocyst rate and blastocyst cell numbers of medium cells were comparable with those of large cells in this study. We hypothesized that the reprogramming ability of oocyte cytoplasm could offset the effect of cell size on blastocyst development.
Cell cycle synchronization also has an important effect on the success rate of SCNT [Citation38], and it has been reported that selecting donor cells at G0/G1 phase can improve the reprogramming ability and developmental potential of SCNT-derived embryos to a certain extent [Citation39,Citation40]. In this study, most small PFFs (d ≤ 13 μm) were also at G0/G1 phase and exhibited better developmental potential of reconstructed embryos. In addition, serum starvation in PFFs can maintain greater than 95% of fibroblasts in G0/G1 phase [Citation41], and it could be hypothesized that appropriate serum starvation conditions during donor cell culture could improve SCNT. Interestingly, we found that serum starvation caused most PFFs to be in a small cell state (Figure S1). Therefore, we hypothesized that serum starvation and selection of small cells have similar effects on improving SCNT efficiency because both processes make most cells arrest at the G0/G1 phase. However, serum starvation induced the apoptosis of donor cells and caused the reduced blastocyte production [Citation42]. In addition, in production of genetically modified animals by SCNT, long-term serum starvation plus the selection process of positive donor cells might further decrease the cell viability. Therefore, selecting small cells for SCNT not only keeps the cellular viability, but also improves the development ability of embryos.
Apoptosis, autophagy and mitochondrial abnormalities in donor cells also have important effects on SCNT. A previous study demonstrated that the treatment of donor cells with the antiapoptotic drug hemoglobin or β-mercaptoethanol improves the preimplantation development of SCNT embryos [Citation43]. Autophagy is a process of maintaining energy homeostasis and coping with cellular stress by degrading intracellular components. The autophagic activation of cloned embryos by treatment with rapamycin could increase the formation of bovine cloned blastocysts [Citation44] possibly because autophagy is beneficial for genome activation by influencing the degradation of maternal mRNA and regulating DNA methylation [Citation45]. However, the increased autophagy of donor cells seems to have an adverse effect on SCNT success in this study, which might be because autophagy led to abnormal cell growth [Citation46]. In SCNT, mitochondria were derived from donor cells and oocytes. Donor somatic cell mitochondria could affect the early development of SCNT embryos [Citation47]. Therefore, the increased mitochondrial damage of donor cells is also harmful for SCNT.
In conclusion, we investigated the cellular and biological characteristics of different sized PFFs and evaluated their effects on the developmental competence of SCNT-derived embryos. The cells in group S exhibited the highest proliferation ability and lower levels of senescence compared with those in groups M and L. The blastocyst rate and number of cells in blastocysts from group S were also significantly greater than those in the other groups. Collectively, these findings provide a certain theoretical reference for the optimization of technology systems and selection of dominant donor cells for producing genetically modified animals through SCNT.
Authors’ contributions
The authors’ contributions were as follows: HJW and HYZ conceived and designed the experiments; DLJ, WMC, XLZ, YFZ, JXG, ZL, DJS, YBQ, and HJW performed the experiments; HJW, HYZ, DLJ, WMC, XLZ, YFZ, and ZX analyzed the data; HJW, DLJ, KXX and MAJ wrote the paper. All authors reviewed the manuscript.
Ethics approval and consent to participate
Experiments involving pigs were approved by the Institutional Animal Care and Use Committee of Yunnan Agricultural University (permission code: YAUACUC01; publication date: 10 July 2013).
Supplemental Material
Download Zip (25.2 KB)Acknowledgments
We thank the “Ministry of Science and Technology of the People’s Republic of China” and “Yunnan Provincial Science and Technology Department” for the support provided for this study.
Disclosure statement
The author(s) declare that they have no competing interests.
Supplementary material
Supplemental data for this article can be accessed here.
Additional information
Funding
Related Research Data
References
- Wang X, Qu J, Li J, et al. Epigenetic reprogramming during somatic cell nuclear transfer: recent progress and future directions. Front Genet. 2020;11:205.
- Hryhorowicz M, Lipiński D, Hryhorowicz S, et al. Application of genetically engineered pigs in biomedical research. Genes (Basel). 2020;11(6):670.
- Matoba S, Zhang Y. Somatic cell nuclear transfer reprogramming: mechanisms and applications. Cell Stem Cell. 2018;23(4):471–485.
- Wilmut I, Bai Y, Taylor J. Somatic cell nuclear transfer: origins, the present position and future opportunities. Philos Trans R Soc Lond B Biol Sci. 2015;370(1680):20140366.
- Whitworth KM, Prather RS. Somatic cell nuclear transfer efficiency: how can it be improved through nuclear remodeling and reprogramming? Mol Reprod Dev. 2010;77(12):1001–1015.
- Cibelli JB, Campbell KH, Seidel GE, et al. The health profile of cloned animals. Nat Biotechnol. 2002;20(1):13–14.
- Liu W, Liu X, Wang C, et al. Identification of key factors conquering developmental arrest of somatic cell cloned embryos by combining embryo biopsy and single-cell sequencing. Cell Discov. 2016;2:16010.
- Matoba S, Liu Y, Lu F, et al. Embryonic development following somatic cell nuclear transfer impeded by persisting histone methylation. Cell. 2014;159(4):884–895.
- Hormanseder E, Simeone A, Allen GE, et al. H3K4 methylation-dependent memory of somatic cell identity inhibits reprogramming and development of nuclear transfer embryos. Cell Stem Cell. 2017;21(1):135–143.e136.
- Matoba S, Wang H, Jiang L, et al. Loss of H3K27me3 imprinting in somatic cell nuclear transfer embryos disrupts post-implantation development. Cell Stem Cell. 2018;23(3):343–354.e345.
- Iager AE, Ragina NP, Ross PJ, et al. Trichostatin A improves histone acetylation in bovine somatic cell nuclear transfer early embryos. Cloning Stem Cells. 2008;10(3):371–379.
- Zhou C, Wang Y, Zhang J, et al. H3K27me3 is an epigenetic barrier while KDM6A overexpression improves nuclear reprogramming efficiency. Faseb J. 2019;33(3):4638–4652.
- Li Z, Shi J, Liu D, et al. Effects of donor fibroblast cell type and transferred cloned embryo number on the efficiency of pig cloning. Cell Reprogram. 2013;15(1):35–42.
- Lee J, Lee Y, Lee GS, et al. Comparative study of the developmental competence of cloned pig embryos derived from spermatogonial stem cells and fetal fibroblasts. Reprod Domest Anim. 2019;54(9):1258–1264.
- Li J, Gao Y, Petkov S, et al. Passage number of porcine embryonic germ cells affects epigenetic status and blastocyst rate following somatic cell nuclear transfer. Anim Reprod Sci. 2014;147(1–2):39–46.
- Wells DN, Laible G, Tucker FC, et al. Coordination between donor cell type and cell cycle stage improves nuclear cloning efficiency in cattle. Theriogenology. 2003;59(1):45–59.
- Zhai Y, Li W, Zhang Z, et al. Epigenetic states of donor cells significantly affect the development of somatic cell nuclear transfer (SCNT) embryos in pigs. Mol Reprod Dev. 2018;85(1):26–37.
- Ma L, Liu X, Wang F, et al. Different donor cell culture methods can influence the developmental ability of cloned sheep embryos. PLoS One. 2015;10(8):e0135344.
- Poehland R, Al-Rostum F, Becker F, et al. Donor cell lines considerably affect the outcome of somatic nuclear transfer in the case of bovines. J Reprod Dev. 2007;53(4):737–748.
- Roh S, Shim H, Hwang WS, et al. In vitro development of green fluorescent protein (GFP) transgenic bovine embryos after nuclear transfer using different cell cycles and passages of fetal fibroblasts. Reprod Fertil Dev. 2000;12(1–2):1–6.
- Barnes FL, Collas P, Powell R, et al. Influence of recipient oocyte cell cycle stage on DNA synthesis, nuclear envelope breakdown, chromosome constitution, and development in nuclear transplant bovine embryos. Mol Reprod Dev. 1993;36(1):33–41.
- Liu H, Peng H, Liu F, et al. The expression of β-galactosidase during long-term cultured goat skin fibroblasts and the effect of donor cell passage on in vitro development of nuclear transfer embryos. In Vitro Cell Dev Biol Anim. 2016;52(5):555–561.
- Cho J, Bhuiyan MM, Shin S, et al. Development potential of transgenic somatic cell nuclear transfer embryos according to various factors of donor cell. J Vet Med Sci. 2004;66(12):1567–1573.
- Wang H, Ao H, Pan Q, et al. Effects of different states of sheep fetal fibroblasts as donor cells on the early development in vitro of reconstructed sheep embryos. Sci China C Life Sci. 2007;50(2):178–185.
- Wei H, Qing Y, Pan W, et al. Comparison of the efficiency of Banna miniature inbred pig somatic cell nuclear transfer among different donor cells. PLoS One. 2013;8(2):e57728.
- Hwang ES, Yoon G, Kang HT. A comparative analysis of the cell biology of senescence and aging. Cell Mol Life Sci. 2009;66(15):2503–2524.
- Matjusaitis M, Chin G, Sarnoski EA, et al. Biomarkers to identify and isolate senescent cells. Ageing Res Rev. 2016;29:1–12.
- Martin SJ, Henry CM. Distinguishing between apoptosis, necrosis, necroptosis and other cell death modalities. Methods. 2013;61(2):87–89.
- Kim SJ, Koo OJ, Park HJ, et al. Oct4 overexpression facilitates proliferation of porcine fibroblasts and development of cloned embryos. Zygote. 2015;23(5):704–711.
- Hyun H, Lee SE, Son YJ, et al. Cell synchronization by rapamycin improves the developmental competence of porcine SCNT embryos. Cell Reprogram. 2016;18(3):195–205.
- Kim E, Hyun SH. Comparative analysis of various donor cell types for somatic cell nuclear transfer and its association with apoptosis and senescence. Mol Med Rep. 2014;9(1):63–68.
- Neurohr GE, Terry RL, Lengefeld J, et al. Excessive cell growth causes cytoplasm dilution and contributes to senescence. Cell. 2019;176(5):1083–1097.e1018.
- Schorl C, Sedivy JM. Analysis of cell cycle phases and progression in cultured mammalian cells. Methods. 2007;41(2):143–150.
- Lai L, Tao T, Macháty Z, et al. Feasibility of producing porcine nuclear transfer embryos by using G2/M-stage fetal fibroblasts as donors. Biol Reprod. 2001;65(5):1558–1564.
- Wang E, Gundersen D. Increased organization of cytoskeleton accompanying the aging of human fibroblasts in vitro. Exp Cell Res. 1984;154(1):191–202.
- Guo Y, Li H, Wang Y, et al. Screening somatic cell nuclear transfer parameters for generation of transgenic cloned cattle with intragenomic integration of additional gene copies that encode bovine adipocyte-type fatty acid-binding protein (A-FABP). Mol Biol Rep. 2017;44(1):159–168.
- Zhang Z, Zhai Y, Ma X, et al. Down-regulation of H3K4me3 by MM-102 facilitates epigenetic reprogramming of porcine somatic cell nuclear transfer embryos. Cell Physiol Biochem. 2018;45(4):1529–1540.
- Campbell KH, Loi P, Otaegui PJ, et al. Cell cycle co-ordination in embryo cloning by nuclear transfer. Rev Reprod. 1996;1(1):40–46.
- Polejaeva IA, Chen SH, Vaught TD, et al. Cloned pigs produced by nuclear transfer from adult somatic cells. Nature. 2000;407(6800):86–90.
- Wilmut I, Schnieke AE, McWhir J, et al. Viable offspring derived from fetal and adult mammalian cells. Cloning Stem Cells. 2007;9(1):3–7.
- Boquest AC, Day BN, Prather RS. Flow cytometric cell cycle analysis of cultured porcine fetal fibroblast cells. Biol Reprod. 1999;60(4):1013–1019.
- Miranda Mdos S, Bressan FF, Zecchin KG, et al. Serum-starved apoptotic fibroblasts reduce blastocyst production but enable development to term after SCNT in cattle. Cloning Stem Cells. 2009;11(4):565–573.
- Park ES, Hwang WS, Jang G, et al. Incidence of apoptosis in clone embryos and improved development by the treatment of donor somatic cells with putative apoptosis inhibitors. Mol Reprod Dev. 2004;68(1):65–71.
- Zhang L, Zhang Y, Han Z, et al. Transcriptome analyses reveal effects of Vitamin C-treated donor cells on cloned bovine embryo development. Int J Mol Sci. 2019;20(11):2628.
- Chi D, Zeng Y, Xu M, et al. LC3-dependent autophagy in pig 2-cell cloned embryos could influence the degradation of maternal mRNA and the regulation of epigenetic modification. Cell Reprogram. 2017;19(6):354–362.
- Roca-Agujetas V, de Dios C, Lestón L, et al. Recent insights into the mitochondrial role in autophagy and its regulation by oxidative stress. Oxid Med Cell Longev. 2019;2019:3809308.
- Takeda K. Mitochondrial DNA transmission and confounding mitochondrial influences in cloned cattle and pigs. Reprod Med Biol. 2013;12(2):47–55.