
ABSTRACT
We examined the apoptotic response of two glioblastoma cells, p53 wild type U87 and p53 mutated T98G, to doxorubicin, bortezomib, and vorinostat, which respectively target DNA, 26S proteasome and histone deacetylase, to clarify p53ʹs function in apoptosis. We demonstrated that doxorubicin induced apoptosis in U87 cells but not in T98G cells. The level of p53 was definitively correlated to the extent of DNA damage and apoptosis initiation. Dominant-negative p53 reduced p21 expression, but did not affect doxorubicin-induced apoptosis, so the transcriptional activity of p53 seemed not to participate in doxorubicin-induced apoptosis. However, p53 concentrated into the nucleus during heavy apoptosis. Bortezomib could induce apoptosis in U87 with high sensitivity and T98G cells with low sensitivity. In contrast, vorinostat promoted apoptosis in both U87 and T98G cells and reduced the basal level of p53 in U87 cells, indicating that p53 played no role in the vorinostat-induced apoptosis. To clearly define the role of p53 in bortezomib- and doxorubicin-induced apoptosis, we combined doxorubicin with bortezomib to treat U87 cells to assess this combination’s effect on apoptosis and p53 status. Interestingly, the combination of doxorubicin with bortezomib engendered compound stress, resulting in a synergistic outcome for apoptosis in U87 cells. However, the amounts of p53 in the total count and in the nucleus were much lower with the combination than with doxorubicin alone, suggesting that p53 played no role in either the compound stress, doxorubicin-only or bortezomib-induced apoptosis.
Introduction
P53 is the most crucial cancer-suppressing gene in vivo. P53 also has an essential role in cancer-therapeutic apoptosis. When cancer cells are treated by agents that disrupt cellular activities, p53 is activated by the shut-down of its negative regulator, MDM2, to turn on numerous target genes [Citation1,Citation2]. Several of these genes are involved in cell cycle arrest, DNA repair, and apoptosis in response to treatment [Citation3,Citation4].
The target genes of p53 participating in cell cycle arrest and DNA repair include p21, GADD45A, DDB2, FANCC, and XPC, which function to rescue cells from damage [Citation5,Citation6]. Another group of p53-upregulated genes, including PUMA, NOXA, BAX, and APAF, do the opposite and propel cell death through apoptosis [Citation5,Citation6]. We may ask how cell fate, either survival or death, can be determined by the same p53 molecule after treatment with a genotoxic agent such as doxorubicin (DOX). The theory of promoter selectivity proposes that p53 interacts differentially with its response elements through post-translational modifications and interactions with cofactors to activate either cell survival or apoptosis genes [Citation7]. However, several microarray studies analyzing genotoxic expression profiles after p53 overexpression revealed that both cell cycle arrest and apoptosis genes are transcribed [Citation8–11].
Two studies have demonstrated that p53 is not a transcriptional activator of Puma in prostate cancer [Citation12,Citation13]. Instead of Puma, another BH3-only protein, Bim, counteracts Bcl-xl to initiate apoptosis in a p53-independent manner in DOX-treated prostate cancer [Citation13]. The determining factor for apoptosis in prostate cancer is DOX-induced severe DNA damage (SDD), not the transcriptional activity of p53 [Citation14].
In addition to genotoxic agents, agents that generate non-genotoxic stress, such as stress from protein turnover dysfunction (PTD) or chromatin remodeling dysfunction (CRD), have been developed for ancillary use in chemotherapy. The most representative agents for protein turnover or chromatin remodeling are bortezomib (BTZ) or vorinostat (SAHA), respectively. BTZ is the first approved inhibitor of the ubiquitin proteasome pathway (UPP) in multiple myeloma and mantle cell lymphoma [Citation15,Citation16]. It interacts with the 20S catalytic core of 26S proteasome to block UPP, impeding protein degradation to affect protein turnover [Citation17]. The inactivation of NF-κB, the stabilization of p53, proapoptotic proteins or BH3 only proteins, the depletion of ubiquitin, the increase of ER stress or the action of the JNK pathway due to the disruption of protein degradation are possible reasons for BTZ-induced apoptosis [Citation18,Citation19]. SAHA inhibits the activity of histone deacetylases (HDACs), mainly class I and II HDACs, by binding to their catalytic sites [Citation20]. SAHA was been approved to treat refractory cutaneous lymphoma in 2006 [Citation21,Citation22]. Although the mechanism by which SAHA causes cell death is not resolved completely, it might affect chromatin remodeling to change the gene expressions and protein functions that trigger apoptosis [Citation23].
In the current study, we used two glioblastoma cell lines, U87 and T98G, to verify p53 function in SDD-, PTD- and CRD-induced apoptosis. U87 carries wild type p53 [Citation24] and T98G has a mutation at codon 273 (ATG to ATA) of p53 that blocks transcriptional activity in a reporter gene assay [Citation25]. Our results first indicated that the apoptosis resulting from CRD stress was p53-independent. We assessed the effect of cellular stress generated by combining DOX with BTZ, and showed that this combination produced a compound stress (CS) to trigger a synergistic effect on apoptosis in U87 cells but not in T98G cells. However, the total amount of p53 and the p53 localized in nucleus were much lower in this CS than in DOX treatment alone, suggesting that p53 played no role in CS-, DOX- or BTZ-induced apoptosis. In addition, combining BTZ with SAHA also generated CS and produced apoptosis synergistically. In contrast, the combination of DOX with SAHA reduced apoptotic response in comparison with DOX alone in U87 cells.
Materials and methods
Cell cultures and treatments
The U87 and T98G glioblastoma cell lines were obtained from the Bioresource Collection and Research Center (BCRC) in Taiwan. Culture conditions for the two cells were 37°C under 5% CO2 in medium with 10% fetal bovine serum. The media for U87 and T98G were -MEM (HyClone) and DMEM (HyClone), respectively. 1 × 10⁵ U87 or T98G cells were plated on 10 cm petri dishes. When cell growth reached 70–80% confluence, fresh medium was substituted and the cells were incubated with various concentrations of DOX (Merck Millipore), BTZ (Selleck), or SAHA (Selleck) singly or in combinations for 24 h. After treatment, the cells were harvested, washed with PBS, and spun down.
Cell transfection to generate stable U87-p53DN and U87-EGFP
The two plasmids used to generate two U87 stable cells, U87-p53 dominant negative (DN) and U-87-EGFP, were pCMV-p53mt135 (Clontech) and pIRES2-EGFP (Clontech). The FuGENE 6 (Promega) transfection kit was used. U87 cells were seeded at 1 × 10⁵ cells per petri dish (10 cm) in 10 ml -MEM with 10% fetal bovine serum and then grown at 37°C under 5% CO2. When cell growth reached 40% confluence, the old medium was replaced with fresh medium, incubated for 12 hr, mixed with 26 μl of FuGENE 6 with 340 μl of serum-free -MEM medium, and incubated for 5 min. Then 5 μg of pCMV-p53mt135 or pIRES2-EGFP was added to the FuGENE 6/medium mixture and incubated for 15 min. The solution was then added dropwise into the cell culture (10 cm dish, about 50% confluence). The transfected cells were grown in medium containing 500 μg/ml G-418 sulfate for 3 weeks, and then the resistant colonies were regarded as candidate stable lines, and the respective U87-EGFP or U87-p53DN were picked for immunofluorescence analysis with microscope or p53DN expression with Western blotting. U87-EGFP and U87-p53DN were cultured in medium with 500 μg/ml G-418 sulfate.
Cytosol and nuclear fractionation
Three plates of U87 cells treated by compounds or compound combinations were harvested and then washed in hypotonic buffer (10 mM Hepes pH7.9, 1.5 mM MgCl2, 10 mM KCl, 0.5 mM DTT) with protease and phosphatase inhibitors. The washed cell pellets were resuspended in hypotonic buffer for 10 min to swell cells. The swollen cells were homogenized by 5 up-and-down pushes through the syringe with a 26 1/2 needle. The nuclei were spun down by centrifuging for 15 min at 4000 rpm. After spinning down, the cytosol supernatant and the collected nuclei were lysed in RIPA buffer (25 mM Tris-HCl pH7.6, 150 mM NaCl, 1% NP40 1 mM DTT, 0.1% NP-40, 1% sodium deoxycholate, 0.1% SDS) containing protease and phosphatase inhibitors. Both the cytosol and nuclear lysates were analyzed by immunoblotting.
Immunoblotting
The harvested cells were lysed in RIPA buffer containing protease and phosphatase inhibitors. The protein concentrations from the cell lysate, separate cytosol and nuclear lysate were determined by a BCA Protein Assay Kit (Pierce). Sixty μg of protein per well was subjected to SDS-PAGE. After electrophoresis, the proteins were transferred to a nitrocellulose membrane. The transferred membranes were blocked in 5% (w/v) nonfat dry milk or 5% (w/v) BSA in TBS (0.5 M NaCl, 20 mM Tris-HCl, pH 7.4) with 0.1% (v/v) Tween 20 and probed for the first antibody, followed by incubation with a secondary antibody conjugated with horseradish peroxidase (anti-rabbit, Cell Signaling; anti-mouse, Cell Signaling) with visualization by ECL (Merck Millipore) with photographic film development. The first antibodies used in this study were anti-GAPDH (Cell Signaling, #5174), anti-Bim (Cell Signaling, #2933), anti-caspase 3(a) (Cell Signaling, #9661), anti-PARP (Cell Signaling, #9542), anti-γH2AX (Santa Cruz Biotechnology, Sc-517,348), anti-p21 (Abcam, ab109199), anti-Puma (Cell Signaling, #4976), anti-lamin A/C (Cell signaling, #4777), anti-p53 (Santa Cruz Biotechnology, Sc-126), anti-GPX4 (Cell signaling, #52,455), anti-Bcl2 (Cell signaling, #2876), anti-Bcl-xl (Cell signaling, #2762) and anti-Bax (Cell signaling, #14,796). Immunoblot images were quantitated by Image Studio Lite (LI-COR Biosciences).
Annexin V/PI assay
Annexin V/PI kit (BD Biosciences, 556,547) was used for this assay. U87 cells were incubated with 1 uM of DOX, 0.05 uM of BTZ or 4 uM of SAHA in 10-cm plates for 20 h. Cells were harvested and washed twice by PBS. The harvested cells were re-suspended in binding buffer (provided by this kit) at a concentration of 1 × 10⁶ cells/ml. One hundred ul of these cells were transferred into assay tube. Five ul of FITC Annexin V and 5 ul of PI were added into the assay tube, vortex gently and incubated for 15 min at room temperature in the dark. Then, 500 ul of binding buffer were added into the assay tube. The labeled cells were analyzed by BD LSRII Flow Cytometer with FlowJo software (BD Sciences).
Lipid peroxidation colorimetric assay
Lipid peroxidation assay kit (BioVision, K-739-100) was used for this experiment. U87 cells were incubated with 1 uM of DOX, 0.05 uM of BTZ or 4 uM of SAHA in 10-cm plates for 20 h. About 2 × 10⁶ cells were homogenized on ice in 500 ul of malondialdehyde (MDA) lysis buffer containing 1x butylated hydroxytoulene. Cell lysate was then centrifuged for 10 min at 13,000 g to remove cell debris. Two hundred ul of cell lysate was mixed with 600 ul of thiobarbituric acid, incubated for 60 min at 95°C and cool down. Two hundred ul of reaction was transferred into a 96-well and read absorbance at 532 nm. The standard MDA solution provided by the kit was served as the positive control.
Statistical analysis
A paired t-test using JMP13 determined the statistical significance of the results. *P < 0.05 or **P < 0.01 was considered significant.
Results
The effects of DOX could be distinguished into two separate phases, cell cycle arrest and apoptosis
We investigated various responses of U87 cells, including the level of p53, the expression of BH3-only proteins, p21, γH2AX, and the activation form of caspase 3, caspase 3(a), in the presence of DOX from low to high concentration. The results revealed that the level of p53 kept increasing as DOX concentrations increased, up to a maximum at 0.5 μM, and then declined from 0.5 μM to 2 μM (). Interestingly, the expression of p21, the sign of cell cycle arrest, appeared at 0.125 μM and dropped to basal levels at 0.5 μM (). In contrast, caspase 3(a), the sign of apoptosis, showed up at 0.5 μM and reached a maximum at 1 μM (). Cell cycle arrest and apoptosis corresponded to low and high DNA damage, respectively, as evaluated by the level of γH2AX (). The above two events can be easily distinguished by the extent of DOX-induced DNA damage in U87 cells. DOX-induced apoptosis was further confirmed by Annexin V/PI analysis in U87 cells (Figure S1).
Figure 1. Effects of DOX on apoptosis in U87 and T98G cells. Cells were incubated with various concentrations of DOX in 10-cm plates for 24 h and harvested for Western blotting. Immunoblot images of p53, p21, Bim, Puma, γH2AX, caspase 3(a) or PARP are shown. GAPDH served as a loading control. Immunoblot images of p53, γH2AX and caspase 3(a) normalized to GAPDH were quantitated as shown (**P < 0.01). The immune blots were cropped from different parts of the same gels and visualized by ECL under various exposure conditions dependent on the activity of antibodies. Representative blots from triplicate experiments are shown. a) DOX-treated U87 cells. b) DOX-treated T98G cells. c) DOX-treated T98G cells.
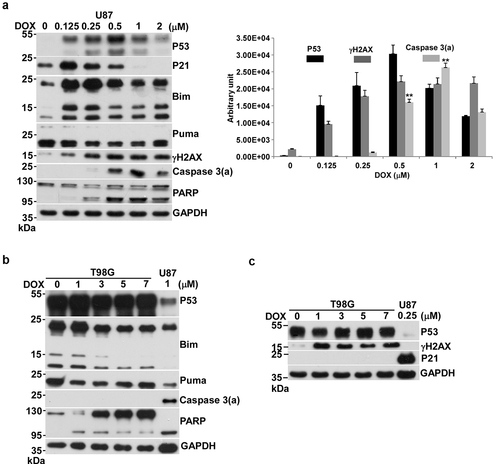
Unlike U87 cells, DOX treatment in T98G cells did not activate caspase-3, even at concentrations up to 7-fold higher than in the positive control U87 cells (). We then asked if DOX has any effect on T98G cells. The results revealed that DOX caused DNA damage though it cannot activate p21 expression via its mutated p53, compared to U87 cells treated by 0.25 μM of DOX, which shows high expression of p21 (). Thus, we concluded that the mutated form of p53 in T98G is not functional.
p53DN inhibited p21 expression and did not affect apoptosis in response to DOX
We compared p21 expression and apoptosis between U87-p53DN and U87-EGFP in response to DOX. The results showed that p21 expression was reduced by the p53DN mutation (). In contrast, the apoptotic response of U87-p53DN and U87-EGFP was not different after treatment with 1 μM of DOX (). Thus, p53-mediated transcriptional actions seemed not to affect DOX-induced apoptosis.
Figure 2. Effects of DOX on p21 expression and apoptosis in U87-p53DN and U87-EGFP cells, and localization of p53 under DOX treatment. U87-p53DN and U87-EGFP cells were incubated with various concentrations of DOX in 10-cm plates for 24 h and harvested for Western blotting. Immunoblot images of p53, p21 or caspase 3(a) are shown. GAPDH served as a loading control. The immunoblot images of p21 or caspase 3(a) normalized to GAPDH were quantitated as shown. For p53 localization, U87 cells were incubated with various concentrations of DOX in 10-cm plates and harvested for nuclei and cytosol fractionation. The nuclei and cytosol fractions were analyzed by Western blotting. Immunoblot images of p53 and p21 are shown. Lamin A/C and GAPDH served as the specific markers of nuclei and cytosol, respectively. The immunoblot images of p53 and p21 in the nucleus or cytosol were normalized to lamin A/C or GAPDH, respectively, quantitated as shown. The immune blots were cropped from different parts of the same gels and visualized by ECL with various exposure conditions dependent on the activity of antibodies. Representative blots from triplicate experiments are shown. a) and b) DOX-treated U87-p53DN and U87-EGFP cells. c) The nuclei and cytosol fraction for U87 cells under DOX treatment.
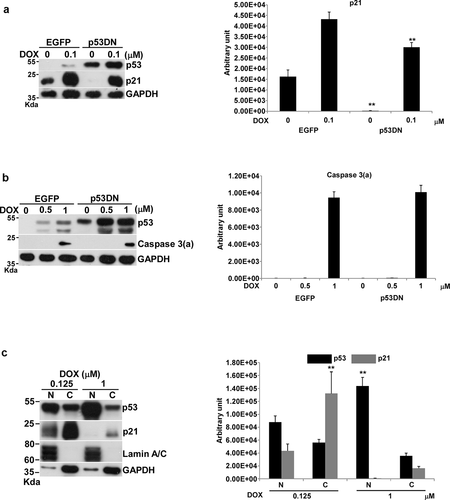
We then used the nucleus/cytosol fraction to examine the distribution of p53 between the nucleus and cytosol with 0.125 μM and 1 μM of DOX, corresponding to cell cycle arrest and apoptosis. p53 translocated from the cytosol into the nucleus at both 0.125 μM and 1 μM DOX (). Interestingly, the level of p53 in the nucleus with 1 μM DOX was about 2-fold higher than with 0.125 μM of DOX (). The p53 in the nucleus activated p21 expression through transcription at 0.125 μM of DOX and showed almost no p21 expression at 1 μM of DOX (); nevertheless, the expression of Puma or Bim at 1 μM DOX did not increase in comparison with that at 0.125 μM of DOX (). Thus p53, which concentrated into the nucleus at 1 μM DOX, did not transcriptionally activate the expression of Puma or Bim. A remaining puzzle was how p53 in the nucleus can activate apoptosis in transcription-independent manner.
Apoptosis induced by BTZ and SAHA
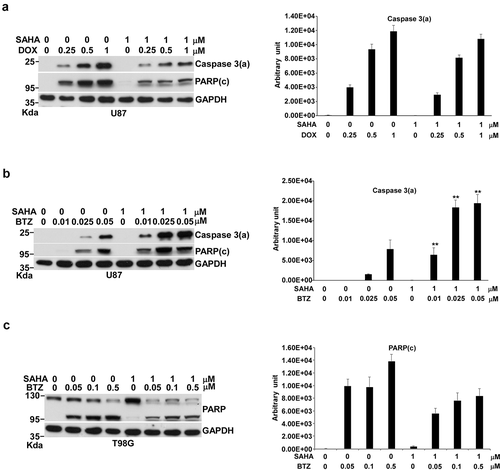
We assessed the potential of BTZ for inducing apoptosis to evaluate the effect of PTD in U87 cells and T98G cells. BTZ stabilized p53 at a constant level from 0.01 μM to 0.15 μM and induced apoptosis in a dose-dependent fashion in U87 cells (). Interestingly, BTZ could also induce apoptosis in T98G cells at 0.05 μM, but its effect on apoptosis reached a peak at 0.1 μM (). U87 cells with wild type p53 seemed more sensitive to BTZ-induced apoptosis than T98G cells with nonfunctional mutated p53 but whether p53 contributes to the sensitivity of U87 cells to BTZ remains unknown. BTZ-induced apoptosis was also demonstrated by Annexin V/PI assay in U87 cells (Figure S1).
Figure 3. Effects of BTZ and SAHA on apoptosis in U87 and T98G cells. Cells were incubated with various concentrations of BTZ or SAHA in 10-cm plates for 24 h and harvested for Western blotting. Immunoblot images of p53, p21, caspase 3(a) or PARP are shown. GAPDH served as a loading control. Immunoblot images of p53, p21, caspase 3(a) or PARP(c) normalized to GAPDH were quantitated as shown (**P < 0.01). The immune blots were cropped from different parts of the same gels and visualized by ECL under various exposure conditions dependent on the activity of antibodies. Representative blots from triplicate experiments are shown. a) BTZ-treated U87 cells. b) BTZ-treated T98G cells. c) SAHA-treated U87 cells. d) SAHA-treated T98G cells.
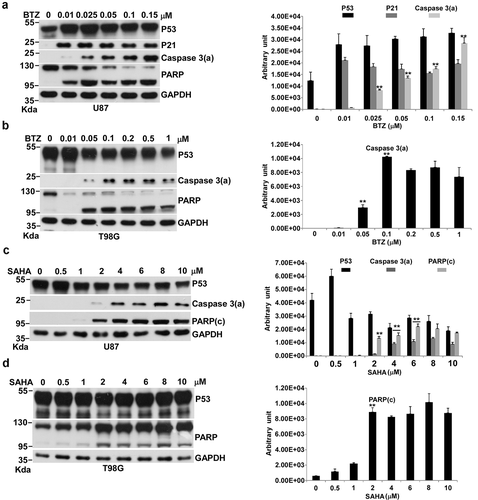
We next examined the effect of CRS on apoptosis by treating U87 and T98G cells with SAHA. We found that SAHA could induce apoptosis without increases in p53, and even reduced the basal level of p53 in U87 cells (). The apoptotic signal, caspase 3(a), appeared at 2 μM and reached its limit at 4 μM (). We used the PARP cleavage form, PARP(c), to evaluate the extent of apoptosis in T98G cells. We found no dose-responsive pattern of PARP(c) for SAHA, suggesting that SAHA could not trigger apoptosis effectively in T98G cells (). We concluded that SAHA activated apoptosis through a p53-independent pathway, since it did not activate p53 expression in U87 cells. SAHA activated apoptosis was also shown by Annexin V/PI assay in U87 cells (Figure S1).
Combining DOX with BTZ had a significant synergistic effect on apoptosis
We did not have conclusive answers for p53 action in SDD- and PTD-induced apoptosis from the above experiments. However, we could clearly conclude that both DOX and BTZ could increase the amount of p53 significantly. Thus, the combination of DOX with BTZ might increase p53 to enhance apoptosis if p53 engaged in Dox- and BTZ-induced apoptosis in U87 cells. Surprisingly, the combination of DOX with BTZ demonstrated a synergistic effect on apoptosis in U87 cells (), and not in T98G cells (). In this combination, the synergistic apoptosis started to show at 0.25 μM of DOX plus 0.05 μM of BTZ and the level of caspase 3(a) kept rising as DOX concentrations rose from 0.5 to 1 μM with 0.05 μM of BTZ, a process of CS that produces synergistic apoptosis.
Figure 4. Effects of the combination of DOX with BTZ on apoptosis in U87 and T98G cells. Cells were incubated with various concentrations of DOX alone or with 0.05 μM of BTZ for 24 h in 10-cm plates harvested for Western blotting. Immunoblot images of p53, caspase 3(a), PARP or PARP (c) are shown. GAPDH served as a loading control. The immunoblot images of p53, caspase 3(a) or PARP(c) normalized to GAPDH were quantitated as shown. For p53 localization, U87 cells were incubated with BTZ, DOX and the combination of DOX with BTZ in 10-cm plates and harvested for nuclei and cytosol fractionation. The nuclei and cytosol fraction were analyzed by Western blotting. Immunoblot image of p53 is shown. Lamin A/C and GAPDH served as specific markers of nuclei and cytosol, respectively. The immunoblot images of p53 in the nucleus or cytosol were normalized to lamin A/C or GAPDH, respectively, and quantitated as shown. The immune blots were cropped from different parts of the same gels and visualized by ECL under various exposure conditions dependent on the activity of antibodies. Representative blots from triplicate experiments are shown. a) U87 cells treated by the combination of DOX with BTZ. b) T98G cells treated by the combination of DOX with BTZ. c) The nuclei and cytosol fraction for U87 cells treated by the combination of DOX with BTZ.
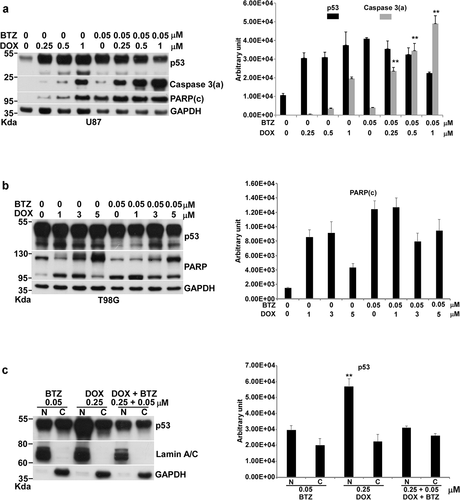
Interestingly, the total amount of p53 was not increased by the combination of DOX with BTZ, and even decreased, compared to DOX alone (). Nuclear p53 was 2-fold higher with DOX alone than with the combination of DOX and BTZ (). The levels of total and nuclear p53 did not match with the extent of apoptosis. Thus, we concluded that p53 might not join in DOX-, BTZ- or DOX/BTZ-induced apoptosis; rather, the extent of cellular stress was the determining factor driving cells toward apoptosis.
The combination of DOX with SAHA reduced apoptosis, while the combination of BTZ with SAHA had a significant synergistic increasing effect on apoptosis
Since the combination of DOX with BTZ generated CS to provoke synergistic apoptosis, which combinations have the capacity to produce CS becomes an interesting issue to be addressed. We tested the effects of two other combinations on apoptosis, DOX plus SAHA and BTZ plus SAHA. The results showed that the apoptotic response induced by the combination of DOX with SAHA was lower than that caused by DOX alone in U87 cells and showed no significant CS (). In contrast, the combination of BTZ with SAHA demonstrated a synergistic dose-responsive effect on apoptosis in U87 cells () with significant CS. Since the DNA damage induced by DOX should also disrupt the integrity of the chromatin structure, we thought the effect of CRD induced by SAHA might not be sensed by cells. However, the respective PTD and CRD corresponding to BTZ and SAHA treatment occurred in the cytoplasm and in the nucleus, resulting in CS in U87 cells. This CS had no capacity to increase apoptosis in T98G cells ().
Figure 5. Effects of the combination of DOX with SAHA or of BTZ with SAHA on apoptosis in U87 and T98G cells. For the combination of DOX with SAHA, U87 cells were incubated with various concentrations of DOX alone or with 1 μM of SAHA in 10-cm plates for 24 h and harvested for Western blotting. Immunoblot images of caspase 3(a) and PARP(c) are shown. GAPDH served as a loading control. The immunoblot images of caspase 3(a) normalized to GAPDH was quantitated as shown. For the combination of BTZ with SAHA, U87 or T98G cells were incubated with various concentrations of BTZ alone or with 1 μM of SAHA in 10-cm plates for 24 h and harvested for Western blotting. Immunoblot images of caspase 3(a) or PARP(c) are shown. GAPDH served as a loading control. The immunoblot images of caspase 3(a) or PARP(c) normalized to GAPDH were quantitated as shown. The immune blots were cropped from different parts of the same gels and visualized by ECL under various exposure conditions dependent on the activity of antibodies. Representative blots from triplicate experiments are shown. a) U87 cells treated by the combination of DOX with SAHA. b) U87 cells treated by the combination of BTZ with SAHA. c) T98G cells treated by the combination of BTZ with SAHA.
DOX, BTZ or SAHA did not change the expressions of anti-apoptotic proteins and pro-apoptotic protein, and the effects of these compounds on apoptosis were not due to lipid peroxidation
We asked if the treatment of DOX, BTZ or SAHA could reduce or enhance the expression of anti-apoptotic protein or the pro-apoptotic protein, respectively. The result revealed that DOX, BTZ and SAHA could not affect the expressions neither of anti-apoptotic proteins, Bcl2 and Bcl-xl, nor of pro-apoptotic protein, Bax (Figure S2).
In addition, we assessed whether the treatment of DOX, BTZ or SAHA could reduce the activity of GPX4, resulting in lipid peroxidation. The result demonstrated that the level of GPX4 slightly increased by the treatment of DOX and BTZ (Figure S3a) and lipid peroxidation did not change significantly in the presence or absence of compounds (Figure S3b). Since the treatment of DOX, BTZ or SAHA did not produce lipid peroxidation, the expression of GPX4 was not reduced in response to these cellular stresses (Figure S3c). Thus, we thought that lipid peroxidation might not contribute into DOX-, BTZ- or SAHA-induced apoptosis.
Discussion
For the past two decades, p53 has been regarded as a primary sensor of various cellular stresses, particularly DNA damage. p53 has been considered to transcriptionally activate BH3-only proteins including Puma, Noxa or Bim to initiate apoptosis in response to SDD induced by radiation or DNA damage agents. However, we have shown that Bim counteracts Bcl-xl to induce apoptosis in a p53-independent manner in prostate cancer cells in response to SDD [Citation13]. Bim and Puma are not p53 target genes in prostate cancer cells such as LNCaP and PC3, as some previous studies have concluded; rather, the determining factor for the apoptotic threshold is SDD, not the amount of p53 [Citation14]. p53DN inhibits the expression of p21 and has no effect on DOX-induced apoptosis [Citation26].
By using a BH3-only mimetic, ABT-263, to inhibit Bcl2 or Bcl-xl, we demonstrated that SDD and PTD caused correspondingly by DOX and BTZ drove apoptosis through a dual control to activate the Bax/Bak pathway independently of p53 in osteosarcoma [Citation27]. A natural product, sanguinarine, which causes DNA single and double strand breaks, induces a p53-independent apoptosis in human colon cancer cell lines [Citation28]. Embryonic stem cells challenged by DNA damaging agents or antimetabolites do not activate p53-dependent stress responses and undergo p53-independent apoptosis [Citation29].
In the current study, we demonstrated that expression of BH3 proteins such as Puma or Bim was not transcriptionally activated by p53. In low DNA damage, p53 works as a transcription factor to activate p21 expression. With increasing concentrations of DOX, p21 expression went down along with the initiation of apoptosis. As in prostate cancer cells, p53DN reduced p21 expression and did not influence DOX-induced apoptosis. Most p53 was concentrated into the nucleus during apoptosis, which suggested that p53 might activate apoptosis through a transcription-independent pathway. Indeed, p53 can alternatively instigate apoptosis through transcription-independent mechanisms by interacting with Bcl2 family members Bak and Bax, triggering their oligomerization to release cytochrome c [Citation30]. One study has pointed out that serine 392 phosphorylation of p53 influences its mitochondrial translocation and is responsible for its transcription-independent apoptotic function [Citation31]. However, all these studies address cytosolic p53-mediated transcription-independent apoptosis, which is not the case in our research here. We concluded that it was almost impossible for p53 located in the nucleus to trigger apoptosis by a transcription-independent pathway.
BTZ stabilized p53 and induced p21 expression in U87 cells, indicating that p53 is functional under BTZ treatment. Moreover, BTZ induced apoptosis in p53 wild type U87 and p53-null T98G cells with correspondingly high and low potency. We therefore treated U87 cells by combining DOX with BTZ to evaluate this combination’s effect on apoptosis and to see the p53 response to this condition. The combination of DOX with BTZ generated CS to produce a synergistic apoptotic response in U87 cells. The amount of total and nuclear p53 was not correlated with the extent of apoptosis caused by CS. Thus, the driving forces of apoptosis in response to SDD, PTD and CD could be distinguished from the status of p53 ().
Figure 6. Schematic representation of p53 status and apoptosis in response to SDD, PTD and CS.
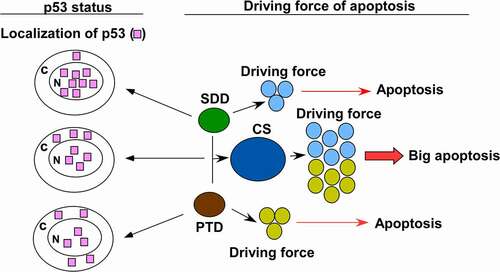
The translocation of p53 into the nucleus might be a response to DNA damage other than apoptosis, since p53 in the nucleus has no transcriptional activity participating in apoptosis. This suggests that p53 might have no function in apoptosis for SDD, PTD and CS in glioblastoma. The main role of p53 is to secure the genome from DNA damage. If p53 is mutated or absent, other genes in these cells, including genes involved in apoptosis, might be mutated or lost. This is probably one reason why cancer cells with missing or mutated p53 always display chemotherapy-resistant phenotypes.
Author contributions
CJH, YRH and CW conceived the study. CJH and CW scrutinized all data. WHZ, YHP, HWC, CJH, YLL and TSH conducted all experiments. CJH and CYT drafted the manuscript. CW and YRH supervised the research. CHC, CYT and JKL assisted in data analysis and interpretation. All authors read the manuscript and approved its submission.
Supplemental Material
Download Zip (501.4 KB)Acknowledgments
This work was supported by Kaohsiung Medical University [KMU-M109010] to C.W, Kaohsiung Medical University Hospital [KMUH108-8M52] to C-J.H, Kaohsiung Medical University Hospital [KMUH110-0M27] to C-Y.T, Kaohsiung Municipal Siaogang Hospital [kmhk-104-007] to J-K. L, and Ministry of Science and Technology grant [MOST110-2320-B-037-029] to Y-R. H. The authors thank Gary Mawyer, M.F.A., for manuscript editing. The authors thank the Center for Research Resources and Development in Kaohsiung Medical University for the assistance in flow cytometry analysis.
Disclosure statement
No potential conflict of interest was reported by the author(s).
Supplementary material
Supplemental data for this article can be accessed here
Additional information
Funding
References
- Vazquez A, Bond EE, Levine AJ, et al. The genetics of the p53 pathway, apoptosis and cancer therapy. Nat Rev Drug Discov. 2008;7(12):979–987.
- Lavin MF, Gueven N. The complexity of p53 stabilization and activation. Cell Death Differ. 2006;13(6):941–950.
- Kastenhuber ER, Lowe SW. Putting p53 in context. Cell. 2017;170(6):1062–1078.
- Brady CA, Attardi LD. p53 at a glance. J Cell Sci. 2010;123(Pt 15):2527–2532.
- Vousden KH, Lu X. Live or let die: the cell’s response to p53. Nat Rev. 2002;2(8):594–604.
- Fischer M. Census and evaluation of p53 target genes. Oncogene. 2017;36(28):3943–3956.
- Murray-Zmijewski F, Slee EA, Lu X. A complex barcode underlies the heterogeneous response of p53 to stress. Nat Rev Mol Cell Biol. 2008;9(9):702–712.
- Kaeser MD, Iggo RD. Chromatin immunoprecipitation analysis fails to support the latency model for regulation of p53 DNA binding activity in vivo. Proc Natl Acad Sci U S A. 2002;99(1):95–100.
- Szak ST, Mays D, Pietenpol JA. Kinetics of p53 binding to promoter sites in vivo. Mol Cell Biol. 2001;21(10):3375–3386.
- Robinson M, Jiang P, Cui J, et al. Global genechip profiling to identify genes responsive to p53-induced growth arrest and apoptosis in human lung carcinoma cells. Cancer Biol Ther. 2003;2(4):406–415.
- Zhao R, Gish K, Murphy M, et al. Analysis of p53-regulated gene expression patterns using oligonucleotide arrays. Genes Dev. 2000;14(8):981–993.
- Dey P, Strom A, Gustafsson JA. Estrogen receptor beta upregulates FOXO3a and causes induction of apoptosis through PUMA in prostate cancer. Oncogene. 2014;33(33):4213–4225.
- Yang MC, Lin RW, Huang SB, et al. Bim directly antagonizes Bcl-xl in doxorubicin-induced prostate cancer cell apoptosis independently of p53. Cell Cycle. (Georgetown, TX) 2016;15(3):394–402.
- Lin RW, Ho CJ, Chen HW, et al. P53 enhances apoptosis induced by doxorubicin only under conditions of severe DNA damage. Cell Cycle. 2018;17(17):2175–2186.
- Paramore A, Frantz S. Bortezomib. Nat Rev Drug Discov. 2003;2(8):611–612.
- Curran MP, McKeage K. Bortezomib: a review of its use in patients with multiple myeloma. Drugs. 2009;69(7):859–888.
- Groll M, Berkers CR, Ploegh HL, et al. Crystal structure of the boronic acid-based proteasome inhibitor bortezomib in complex with the yeast 20S proteasome. Structure. 2006;14(3):451–456.
- Nunes AT, Annunziata CM. Proteasome inhibitors: structure and function. Semin Oncol. 2017;44(6):377–380.
- Rashid F, Niklison-Chirou MV. Proteasome inhibition-a new target for brain tumours. Cell Death Discov. 2019;5(1):147.
- Marks PA, Breslow R. Dimethyl sulfoxide to vorinostat: development of this histone deacetylase inhibitor as an anticancer drug. Nat Biotechnol. 2007;25(1):84–90.
- Grant S, Easley C, Kirkpatrick P. Vorinostat. Nat Rev Drug Discov. 2007;6(1):21–22.
- Mann BS, Johnson JR, Cohen MH, et al. FDA approval summary: vorinostat for treatment of advanced primary cutaneous T-cell lymphoma. Oncologist. 2007;12(10):1247–1252.
- Bolden JE, Peart MJ, Johnstone RW. Anticancer activities of histone deacetylase inhibitors. Nat Rev Drug Discov. 2006;5(9):769–784.
- Hirose Y, Berger MS, Pieper RO. p53 effects both the duration of G2/M arrest and the fate of temozolomide-treated human glioblastoma cells. Cancer Res. 2001;61(5):1957–1963.
- Van Meir EG, Kikuchi T, Tada M, et al. Analysis of the p53 gene and its expression in human glioblastoma cells. Cancer Res. 1994;54(3):649–652.
- Ho CJ, Lin RW, Zhu WH, et al. Transcription-independent and -dependent p53-mediated apoptosis in response to genotoxic and non-genotoxic stress. Cell Death Discov. 2019;5(1):131.
- Ho CJ, Ko HJ, Liao TS, et al. Severe cellular stress activates apoptosis independently of p53 in osteosarcoma. Cell Death Discov. 2021;7(1):275.
- Matkar SS, Wrischnik LA, Hellmann-Blumberg U. Sanguinarine causes DNA damage and p53-independent cell death in human colon cancer cell lines. Chem Biol Interact. 2008;172(1):63–71.
- Aladjem MI, Spike BT, Rodewald LW, et al. ES cells do not activate p53-dependent stress responses and undergo p53-independent apoptosis in response to DNA damage. Curr Biol. 1998;8(3):145–155.
- Speidel D. Transcription-independent p53 apoptosis: an alternative route to death. Trends Cell Biol. 2010;20(1):14–24.
- Castrogiovanni C, Waterschoot B, De Backer O, et al. Serine 392 phosphorylation modulates p53 mitochondrial translocation and transcription-independent apoptosis. Cell Death Differ. 2018;25(1):190–203.