
ABSTRACT
Tightly controlled fluctuations in kinase and phosphatase activity play important roles in regulating M-phase transitions. Protein Phosphatase 1 (PP1) is one of these phosphatases, with oscillations in PP1 activity driving mitotic M-phase. Evidence from a variety of experimental systems also points to roles in meiosis. Here, we report that PP1 is important for M-phase transitions through mouse oocyte meiosis. We employed a unique small-molecule approach to inhibit or activate PP1 at distinct phases of mouse oocyte meiosis. These studies show that temporal control of PP1 activity is essential for the G2/M transition, metaphase I/anaphase I transition, and the formation of a normal metaphase II oocyte. Our data also reveal that inappropriate activation of PP1 is more deleterious at the G2/M transition than at prometaphase I-to-metaphase I, and that an active pool of PP1 during prometaphase is vital for metaphase I/anaphase I transition and metaphase II chromosome alignment. Taken together, these results establish that loss of oscillations in PP1 activity causes a range of severe meiotic defects, pointing to essential roles for PP1 in female fertility, and more broadly, M-phase regulation.
KEYWORDS:
Introduction
Accurate oocyte meiosis is essential for female fertility and the development of healthy offspring. Paradoxically, mammalian oocyte meiosis is inherently error-prone, with aneuploidy observed in 10–30% of human oocytes, making aneuploidy a leading cause of miscarriage and birth defects [Citation1,Citation2]. Key to successful meiosis is precise M-phase regulation driven by widespread changes in protein phosphorylation (). This dynamic phospho-environment is driven by tightly controlled fluctuations in both kinase and phosphatase activity. CDK1 is largely responsible for the increase in protein phosphorylation that propels M-phase entry and progression [Citation3,Citation4]. Phosphatases, including the closely related serine/threonine phosphatases protein phosphatase 1 (PP1) and protein phosphatase 2A (PP2A), act as the major phosphatases that oppose CDK1 and regulate M-phase exit by removing phosphorylations needed to maintain M-phase [Citation5] ().
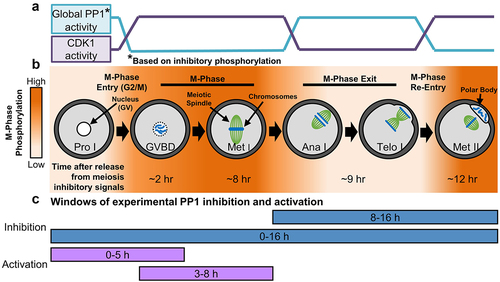
Figure 1. Phospho-dynamics and M-phase regulation in oocyte meiosis. (a) Enzymatic activity of CDK1 and PP1 in mouse oocytes from prophase I to metaphase II, a process known as meiotic maturation. PP1 activity is shown as global activity based on the presence of the PP1 inhibitory phosphorylation (pT320 on PP1cα). (b) Oocytes are arrested at prophase I (Pro I) until just prior to ovulation. Resumption of meiosis and entry into meiosis I M-phase is equivalent to the G2/M transition in mitosis. Oocytes progress through nuclear envelope breakdown (NEBD) and metaphase I (Met I), then exit M-phase. After telophase I (Telo I) completion, oocytes exit meiosis I, but bypass interphase and reenter M-phase, arresting at metaphase II (Met II). In mice, it takes ~12 hours to progress from prophase I to metaphase II (at which point oocytes arrest until fertilization), with the time needed to reach each stage noted in the figure. Mass changes in protein phosphorylation drive this M-phase entry and exit (orange = high phosphorylation, white = low phosphorylation). (c) Windows of experimental PP1 inhibition with tautomycetin (TMC) and activation with PDP-Nal.
PP1 and PP2A are critically important for mitotic and meiotic M-phase progression and exit. In mitosis, PP1 and PP2A have unique temporal and spatial regulation, and work in concert to oppose CDK1 activity, preventing M-phase entry, and promoting metaphase-to-anaphase transition [Citation6–9]. In mammalian oocytes, inhibition of PP1/PP2A with reagents, such as Okadaic Acid and Calyculin A causes major meiotic abnormalities, and oocyte-specific conditional loss of PP2A causes substantial defects in chromosome segregation and M-phase progression [Citation10–19]. However, data also suggest that PP2A is not the only phosphatase that regulates meiosis in mammalian oocytes, and so we sought to elucidate PP1’s functions in this important cell type, building on evidence that PP1 has important roles in meiosis in Drosophila, Caenorhabditis elegans, starfish oocytes, and mammalian spermatogenesis [Citation20–23].
PP1 is a holoenzyme consisting of a catalytic subunit (PP1c) and one to two regulatory subunits (called PIPs, for PP1-interacting subunit, or RIPPOs, for regulatory interactors of protein phosphatase 1) [Citation24,Citation25]. In mammals, there are three PP1c genes and hundreds of RIPPOs, resulting in hundreds of unique holoenzymes with distinctive functions and substrates [Citation24,Citation25]. Various forms of PP1 holoenzymes allow PP1 activity to contribute to numerous processes in mitosis, including the G2/M transition, microtubule-kinetochore attachments, the spindle assembly checkpoint, and aspects of cytokinesis [Citation6,Citation26–32]. Oscillations in phosphorylation of RIPPOs and PP1c, particularly phosphorylation of PP1c’s inhibitory site (pT320 on PP1cα and the equivalent sites in PP1cβ and PP1cγ), during M-phase play a critical role in the formation of PP1 holoenzymes and PP1 activity, and ultimately mitotic M-phase progression [Citation33–35]. Notably, oscillations in RIPPO and PP1c phosphorylations in M-phase of starfish and mammalian oocytes mirror those observed in mitotic cells [Citation4,Citation17,Citation23,Citation34,Citation35].
As noted above, exposure of mammalian oocytes to PP1/PP2A inhibitors (Okadaic Acid or Calyculin A) leads to significant aberrations during in vitro meiotic maturation, including accelerated nuclear envelope breakdown (NEBD, G2/M transition), abnormal spindle morphology, meiosis I failure, and aneuploidy [Citation12–19]. However, only two studies have attempted to tease apart the functions of PP1 and PP2A in mammalian oocytes, and these studies suggest that PP1 is important for NEBD and chromosome condensation in mouse oocytes [Citation17,Citation18]. To establish the roles that PP1 plays in mammalian oocyte M-phase, we leveraged a small molecule approach to manipulate PP1 activity in opposition to its anticipated activity (e.g. inappropriately activating PP1 at G2/M) or preventing oscillations in PP1 activity (e.g. inhibiting PP1 for the duration of meiosis). It is worth noting that mammalian oocytes present a valuable and unique opportunity to unravel the functions of cell cycle regulatory proteins due to their relatively slow and synchronous progression through M-phase of meiosis I. As a result of this synchronicity and extended M-phase (7–10 h), mouse oocytes offer an exceptional model for the precise study of PP1 at discrete windows of time (e.g. the G2/M transition only), without the need for potentially damaging synchronization methods. To leverage these strengths of the mouse oocyte system and to investigate PP1 roles with unprecedented control, mouse oocytes were exposed to the PP1 selective inhibitor tautomycetin [Citation36] and a recently developed PP1 activator PDP-Nal [Citation37] at discrete windows of meiosis (). These studies reveal that alteration of normal PP1 activity caused a range of severe meiotic defects, pointing to roles for PP1 in oocyte M-phase and female fertility.
Materials and methods
Animals and ethics approval
6–11-week-old female CF-1 mice or CD-1 (Envigo) were used in accordance with Purdue Animal Care and Use Committee guidelines. Mice were housed under a 12 h light:dark cycle with ad libitum water and food.
Oocyte collection and in vitro maturation
Prophase I stage oocytes were collected into Whitten’s-HEPES medium (109.5 mM NaCl, 4.7 mM KCl, 1.2 mM KH2PO4, 1.2 mM MgSO4, 5.5 mM glucose, 0.23 mM pyruvic acid, 4.8 mM lactic acid hemicalcium salt, with 7 mM NaHCO3, 15 mM HEPES) supplemented with 0.25 mM dbcAMP (Sigma-Aldrich, D0627) or 2.5 μM milrinone (Sigma-Aldrich, M4659) to maintain prophase I arrest. Cumulus cells were mechanically removed via repeated pipetting of oocytes before transfer into Whitten’s bicarbonate (Whitten’s medium without HEPES and with 22 mM NaHCO3) supplemented with dbcAMP or milrinone. For each experiment, oocytes were pooled from 3 to 7 females.
For in vitro maturation (IVM), oocytes were washed into Whitten’s-Bicarb without dbcAMP or milrinone to release oocytes from prophase I arrest. Oocytes were matured for up to 16 h at 37°C, 5% CO2. For assays to evaluate inappropriate exit from prophase I arrest, oocytes were washed into Whitten’s-Bicarb supplemented with 0.2 µM milrinone for 16 h at 37°C, 5% CO2.
Small molecule inhibitors and activators
Oocytes were cultured in 0.5–5 µM tautomycetin (TMC; selective PP1c inhibitor; Bio-Techne, 2305), 2.5–40 µM PDP-Nal (PP1c activator; a gift from Maja Köhn), 50 nM Calyculin A (CalA; Cell Signaling Technology (CST), 9902S) or vehicle (0.1% DMSO, equal to DMSO in 5 µM TMC treatment group) for the duration of IVM or for discrete windows of time (see ). For experiments that added TMC or PDP-Nal during meiosis I (e.g. 3 h post-meiotic arrest release), oocytes still at prophase I arrest at 2.5 h post-dbcAMP/milrinone washout were removed. Finally, for oocytes with TMC treatment for 7 and 9 h post-meiotic arrest release, oocytes still at prophase I arrest at 6.5 h post-dbcAMP/milrinone washout were manually removed from the culture droplets. Inhibitor/activator concentration and culture conditions for individual experiments are detailed in the results section and figure legends.
Immunofluorescence and F-actin staining
Oocytes were fixed in 4% paraformaldehyde (Sigma-Aldrich, P6148) in HEPES buffer (130 mM KCl, 25 mM HEPES, 3 mM MgCl2, and 0.06% Triton-X, pH 7.4) for 30 min at 37°C prior to permeabilization in PBS with 0.1% Triton X-100 (Fisher Scientific, BP151) and blocking in PBS with 0.1% BSA (Sigma-Aldrich, A9647) and 0.01% Tween-20 (Sigma-Aldrich, P7949) at room temperature. Oocytes were incubated with primary antibodies for α-tubulin (Zymed, clone Z023, 3605884, 1:100, or Developmental Studies Hybridoma Bank, clone 12G10, 10.6 μg/ml), pH3T3 (Cell Signaling Technology (CST), 13576S, 220 ng/ml), pH3S10 (CST, 9701S, 25 ng/ml), or pAKT(S473) (CST, 9271T, 200 ng/ml) for 16 h at 4°C. After 16 h, oocytes were washed in PBS with 0.1% BSA and 0.1% Tween-20 and incubated with 7.5 μg/ml goat anti-mouse IgG or donkey anti-rabbit conjugated to Alexa Fluor 488 (Jackson ImmunoResearch) at room temperature. For pAKT(S473) immunofluorescence 100 µM Na3VO4 (Sigma-Aldrich, S6508) was included in all buffers. For F-actin staining, 140 nM Acti-stain 555 phalloidin (Cytoskeleton Inc., PHDH1-A) was added to the secondary antibody. Oocytes were mounted in VectaShield (Vector Laboratories, H-1000) containing 0.75 μg/ml 4–6-diamidino-2-phenylindole (DAPI; Sigma-Aldrich, D9542). Imaging was performed using a Zeiss Axio Observer Z1 microscope with AxioCam MRm Rev3 camera and ApoTome optical sectioning (Carl Zeiss, Inc.). Optical sectioning of oocytes was performed to include all DNA and associated microtubules within the cytoplasm with an optical distance of 1 µm between sections.
Immunofluorescence analysis
Image analysis was performed with ImageJ Fiji distribution (Freeware; National Institutes of Health - https://imagej.net/software/fiji/). Details for each type of analysis are specified below.
Chromatin configuration and chromosome alignment: Slides were blinded, and oocytes were imaged and assessed for DNA morphology and chromosome alignment to classify stage of meiosis (e.g. prophase I, metaphase I, metaphase II) and chromosome alignment on the metaphase plate. Oocytes were classified as aligned if all DNA congressed on the metaphase plate, as mild chromosome misalignment if one to two chromosomes had not congressed to the metaphase plate, as moderate misalignment if three to four chromosomes had not congressed to the metaphase plate, or as severe misalignment if >4 chromosomes had not congressed to the metaphase plate or no metaphase plate was present.
Histone H3 phosphorylation fluorescence intensity (pH3T3 and pH3S10): DNA and histone H3 immunofluorescence optical sections were merged into a single DNA or histone H3 immunofluorescence Z-projection. Image threshold and analyze particles Fiji functions were used to determine DNA region-of-interest on DNA Z-projections automatically. Calculations of the pH3T3 and pH3S10 fluorescence intensity were then performed by first obtaining the value for the background signal (by multiplying the DNA area by the average of the mean background signal), and then subtracting this background signal from the integrated density value of the phospho-Histone H3 signal. Control oocytes were then normalized to an average value of 1, with this used to normalize all other groups. For experiments establishing H3T3 phospho-dynamics through meiosis, the fluorescence intensity of pH3T3 was performed on all oocytes regardless of their meiotic stage. For all other experiments quantifying pH3T3 and pH3S10 dynamics, only the fluorescence intensity of prometaphase or metaphase I oocytes was measured.
AKT(S473) phosphorylation fluorescence intensity: pAKT(S473) becomes enriched on microtubules after NEBD during prometaphase [Citation38]. Because of this, meiotic stage, the size of the meiotic spindle, and spindle orientation can all impact fluorescence quantification. To ensure these factors did not impact fluorescence intensity, fluorescence was quantified as follows. A ROI (region of interest) was set in ImageJ Fiji distribution. On a single optical section, this ROI was used to measure the fluorescence adjacent to the chromosomes (where the meiotic spindle would be) and also four cytoplasmic regions; see Supplementary Fig. S1A for an example of ROI’s. Fluorescence intensity for each ROI was then calculated as described above. The chromosome-adjacent ROI was normalized to control oocytes (DMSO or PDPm-Nal) to an average value of 1. Next, the fluorescence intensity of the cytoplasmic ROI’s for each oocyte was averaged, with these average cytoplasmic ROI’s normalized to control oocytes as above. Finally, normalized chromosome-adjacent fluorescence intensity was added to normalized average cytoplasmic fluorescence intensity to generate the final pAKT(S473) fluorescence intensity values.
Distance of metaphase I plate to the cortex: A Z-projection of the DNA optical sections and the central F-actin optical section were merged into a single image. The metaphase I spindle migrates to the cortex in a pole-first manner (Supp Fig. S2B) [Citation39]. Therefore, a straight line from the center of the metaphase I plate to the closest region of the cortex with this pole-first directionality was measured (Supp Fig. S2C).
Immunoblotting
Oocyte lysates were made by adding 20 oocytes to 4× SDS loading buffer (50% glycerol, 520.1 mM Sodium Dodecyl Sulfate, 3.1 M Tris base, and 1.4 mM bromophenol blue) with 100 µM Na3VO4. Each lysate contained exactly 20 oocytes and the whole lysate was loaded in a single lane. Prior to loading oocyte lysates onto the gel, samples were diluted to 2× SDS with TBS (137 mM NaCl, 2.7 mM KCl, 19 mM Tris base). SDS-PAGE was performed using standard protocol, and proteins were transferred onto PVDF (Millipore Sigma, IPVH00010). For immunoblotting, 100 µM Na3VO4 was included in all buffers post-transfer. Membranes were blocked in 5% BSA TBS-T (TBS with 0.1% Tween-20) for 1 h at room temperature. Following blocking, membranes were incubated in anti-pPP1c(T320) (Abcam, ab62334, 0.134 µg/ml) in 1% BSA TBS-T at 4°C. After 16 h, membranes were washed in TBS-T prior to incubation with goat anti-rabbit IgG-horseradish peroxidase (Jackson ImmunoResearch, 0.3 µg/ml) in 1% BSA TBS-T for 2 h at room temperature. Membranes were again washed with TBS-T, prior to X-ray film (Bioland Scientific LLC, A03–02) detection of chemiluminescence signal. A GelDoc Go (Bio Rad) was used to make digital images of films, and densitometry was performed using ImageJ Fiji distribution. Densitometry was normalized so that control lanes (Veh or PDPm-Nal) equaled 1. See Supplementary Fig. S1B for representative image of an uncropped immunoblot.
Statistical analysis
GraphPad Prism 9.2.0 (GraphPad Software, www.graphpad.com) was used for statistical analysis, with a p-value of <0.05 considered statistically significant. For categorical data, the Fisher’s exact test was used. For continuous/numerical data, D’Agnostino-Pearson omnibus normality test was performed to determine if the data followed a normal distribution. For normally distributed numerical data, the Student’s t-test or ANOVA with Tukey’s post hoc test was used. For all other data, the Mann–Whitney test or Kruskal–Wallis test with Dunn’s post hoc was used. The exact p-values for each analysis can be found in “Results” section. Additionally, further information on statistical tests used for each dataset can be found within the figure legends.
Results
Tautomycetin (TMC) selectively inhibits PP1 in mouse oocytes
Tautomycetin (TMC) is a PP1 selective inhibitor, with a ~ 40-fold higher affinity for PP1 over PP2A [Citation36]. We examined TMC’s selectivity for PP1 in mouse oocytes by assessing phosphorylation of three PP1 substrates as well as a PP2A substrate. To evaluate how phosphorylation of these PP1 and PP2A substrates was affected by phosphatase inhibitors, oocytes were treated with either TMC (tested at 5 µM because this concentration of TMC causes a 90% reduction in PP1 activity with no impact on PP2A activity in COS-7 cells [Citation40]) or with Calyculin A (CalA; an inhibitor of both PP2A and PP1, tested at 50 nM, a concentration known to cause significant chromosome condensation defects in mouse oocytes [Citation18]).
We assessed three different PP1-specific substrates in TMC-treated oocytes: Histone H3 on Threonine 3 (pH3T3), histone H3 on Serine 10 (pH3S10), and PP1c on Threonine 320 (pPP1c(T320)). H3T3 is dephosphorylated by PP1 at M-phase exit [Citation41,Citation42], with a significant decrease in pH3T3 observed at 9 h post-meiotic arrest release (M-phase exit; Supp Fig. S3A), suggestive of high PP1 activity on this substrate. Treatment of oocytes with 5 µM TMC from 0–7 h or 0–9 h post-meiotic arrest release caused a significant increase in the PP1 substrate pH3T3 compared to vehicle control ( and Supp Fig. S3B; 7 h, 23.1 ± 5.3% pH3T3 increase, p = 0.0332; 9 h, 41.0 ± 4.9% pH3T3 increase, p = 0.0002). The second PP1 substrate examined, H3S10, shows high phosphorylation from M-phase entry to metaphase II arrest [Citation18,Citation42], and previous studies treating oocytes with Okadaic Acid (a PP1/PP2A inhibitor) from 0 to 3 h post-meiotic arrest release (M-phase entry) resulted in increased H3S10 phosphorylation [Citation18,Citation42]. Therefore, the phosphorylation status of H3S10 was evaluated in oocytes treated with 5 µM TMC from 0 to 3 h post-meiotic arrest release. Similar to what was observed with Okadaic Acid exposure, treatment of oocytes with 5 µM TMC in this time window (0–3 h post-meiotic arrest release) significantly increased pH3S10 ( and Supp Fig. S3C; 19.8 ± 4.8% pH3S10 increase, p = 0.0181). Finally, the third PP1 substrate examined was PP1c(T320), a site that is auto-dephosphorylated by PP1. pPP1c(T320) was shown to be sensitive to Calyculin A (CalA) in starfish oocyte meiosis [Citation23] with phosphorylation increasing at M-phase entry, decreasing at meiosis I exit, and increasing at meiosis II M-phase reentry [Citation4,Citation17,Citation23]. We treated mouse oocytes with TMC from 2 to 4 h post-meiotic arrest release, which led to a significant increase in pPP1c(T320) in TMC treated oocytes compared to vehicle controls (; 55.8 ± 2.4% pPP1c(T320), p = 0.0059).
Figure 2. PP1 manipulation alters PP1, but not PP2A, substrate phosphorylation. (a-c) Graphical comparison of PP1 substrate phosphorylation between vehicle control (0.1% DMSO) and TMC (5 µM)-treated oocytes. (a) pH3T3 fluorescence intensity. Prophase I oocytes were released from meiotic arrest and cultured in TMC or Veh medium for 7 or 9 h. n = 42–77 oocytes over two replicates. (b) pH3S10 fluorescence intensity. Prophase I oocytes were released from meiotic arrest and cultured in TMC or Veh medium for 3 h. n = 67–98 oocytes over two replicates. (c) pPP1c(T320) densitometry. Prophase I oocytes were kept meiotically arrested (Pro I) or released from meiotic arrest and cultured for 2 h. At 2 h post-meiotic arrest release, NEBD oocytes were cultured in TMC or Veh medium for 2 h (4 h post-meiotic arrest release). 20 oocytes per lane, n = 3 replicates. (d) Graphical comparison of PP2A substrate phosphorylation, pAKT(S473) fluorescence intensity, between vehicle control (0.1% DMSO), TMC (5 µM)-treated, and CalA (50 nM)-treated oocytes. Prophase I oocytes were released from meiotic arrest and cultured for 2 h before exposure to TMC, CalA, or Veh for 1 h (to 3 h post-meiotic arrest release) or 2 h (to 4 h post-meiotic arrest release). n = 29–37 oocytes over two replicates. (e-g) Graphical comparison of PP1 substrate phosphorylation between control oocytes (no treatment or 10 µM PDPm-Nal) and PDP-Nal (10 µM) treated oocytes. (e) pH3T3 fluorescence intensity. Prophase I oocytes were released from meiotic arrest and cultured in PDPm-Nal, PDP-Nal or had no treatment (Ctl) for 3 to 8 h post-meiotic arrest release. n = 22–44 oocytes over three replicates. (f) pH3S10 fluorescence intensity. Prophase I oocytes were released from meiotic arrest and cultured in PDPm-Nal, PDP-Nal or had no treatment (Ctl) for 3 to 8 h post-meiotic arrest release. n = 28–48 oocytes over three replicates. (g) pPP1c(T320) densitometry. Prophase I oocytes were kept meiotically arrested (Pro I) or released from meiotic arrest and cultured for 2 h. At 2 h post-meiotic arrest release, NEBD oocytes were cultured in PDPm-Nal or PDP-Nal medium for 2 h (4 h post-meiotic arrest release). 20 oocytes per lane, n = 3 replicates (h) Graphical comparison of PP2A substrate phosphorylation, pAKT(S473) fluorescence intensity, between PDPm-Nal (10 µM) and PDP-Nal (10 µM) treated oocytes. Prophase I oocytes were released from meiotic arrest and cultured for 1 h before exposure to PDPm-Nal or PDP-Nal for 2 h (3 h post-meiotic arrest release). n = 29–37 oocytes over two replicates. For experiments with two groups, * denotes a significant difference between the groups (Mann–Whitney test). For experiments with three or more groups, different letters denote a significant difference between the groups (Kruskal–Wallis test with Dunn’s post hoc or ANOVA with Tukey’s post hoc). For example, in Panel D, the “a” with the Veh and TMC 3 h treatment groups indicates that the levels of pAKT(S473) are not statistically significantly different between these two groups. The “b” over CalA in the 3 h treatment group indicates that the level of pAKT(S473) is statistically significantly different from those in the Veh and TMC 3 h and 4 h treatment groups. For TMC 4 h treatment, the “a,c” indicates that this group is not statistically significantly different from Veh 3 h (“a”), TMC 3 h (“a”), or Veh 4 h (“c”) but is significantly different to CalA 3 h (“b”) and 4 h (“d”) groups. Fluorescence intensity and densitometry was normalized to control oocytes (Veh, no treatment, or PDPm-Nal). If fluorescence intensity was assessed at two time-points, the first control time-point was used for normalization. Graphed values are mean and SEM with scatter dot plots showing each individual oocyte’s fluorescence intensity. For immunoblots, oocytes for PP1 inhibition and activation were collected and treated in parallel, and run on the same immunoblot. Therefore, prophase I oocyte data for C and G are the same, but normalized to either Veh (c) or PDPm-Nal (d).
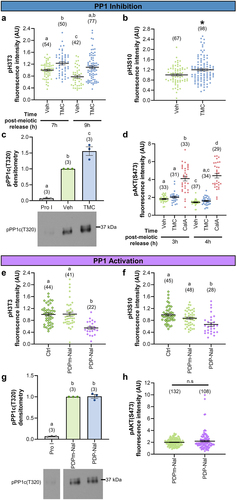
To validate the selectivity of TMC for PP1, analysis of the PP2A substrate, AKT on Serine 473 (pAKT(S473)) was performed. pAKT(S473) levels significantly decreased at 3 h post-meiotic arrest release (M-phase entry/early M-phase; Supp Fig. S3D) [Citation38,Citation43]. Treatment of oocytes with 50 nM CalA (PP1/PP2A inhibitor) from 2–3 h or 2–4 h post-meiotic arrest release caused a significant increase in phosphorylation of pAKT(S473) ( and Supp Fig. S3E; 3 h, 91.5 ± 7.8% pAKT(S473) increase, p < 0.0001; 4 h, 268.9 ± 7.7% pAKT(S473) increase, p < 0.0001). In contrast, treatment of oocytes with 5 µM TMC in these same time windows did not cause a change in pAKT(S473) ( and Supp Fig. S3E; 3 h, p > 0.9999; 4 h, p > 0.9999). Taken together, these data highlight the selectivity of 5 µM TMC for PP1 in mouse oocytes.
PP1-disrupting peptide (PDP-Nal) specifically activates PP1 in mouse oocytes
PP1-disrupting peptides (PDPs) are cell-permeable peptides that disrupt the interaction of the PP1 catalytic subunits with regulatory subunits (RIPPOs), thus increasing PP1 activity in cells [Citation37,Citation44]. The sequence of PDPs is based on the motif through which most RIPPOs interact with the PP1 catalytic subunits, known as the RVxF-type PP1-binding motif. PDP-Nal has the sequence RRKRPKRKRKNARVTFNaIEAAEII, from the RVTF motif in the RIPPO NIPP1 (PPP1R8), with 2‐naphthylalanine (Nal) replacing a serine. The inactive form, PDPm‐NaI (m for inactive mutant), has the sequence RRKRPKRKRKNARATANaIEAAEII, with RATA (underlined) replacing RVTF [Citation44]; these alanine substitutions in this motif abolish binding to the PP1 catalytic subunits [Citation44,Citation45]. We assessed the phosphorylation status of substrates for PP1 (pH3T3, pH3S10, and pPP1c(T320)) and PP2A (pAKT(S473)) in PDP-Nal-treated oocytes. Phosphorylation of H3T3 and H3S10 was interrogated at metaphase I following PDP-Nal treatment from 3 to 8 h post-meiotic arrest release, and phosphorylation of PP1c(T320) was evaluated at prometaphase following PDP-Nal treatment from 2–4 h post-meiotic arrest release. Treatment of oocytes with 10 µM PDP-Nal caused a significant loss in H3T3 and H3S10 phosphorylation compared to the negative control peptide, PDPm-Nal ( and Supp Fig. S3F; pH3T3, 46.0 ± 4.9% pH3T3 loss, p < 0.0001; pH3S10, 24.0 ± 6.0% pH3S10 loss, p = 0.0647). Conversely, no change in PP1c(T320) phosphorylation was observed following PP1 activation (; p = 0.9478). These results are consistent with the observation of Rogers et al. of fast and substantial loss of H3T3 phosphorylation in mitotic cells treated with 40 µM of the first-generation PP1 disrupting peptide (PDP3), but only a slow and modest loss of PP1c(T320) phosphorylation [Citation7]. Their findings and ours suggest that distinct PP1 substrates have different sensitivities to dephosphorylation following PP1 activation [Citation7,Citation46].
Having confirmed that PDP-Nal treatment leads to dephosphorylation of PP1 substrates, we next sought to confirm that uncoupled PP1c did not have off-target effects on the PP2A substrate pAKT(S473). Oocytes were exposed to 10 µM PDP-Nal from 1 to 3 h post-meiotic arrest release. No change in AKT(S473) phosphorylation was observed with PDP-Nal compared to PDPm-Nal treatment ( and Supp Fig. S3G; p = 0.6437). Importantly, however, there was a significant reduction in phosphorylation of the PP1 substrate H3T3 (Supp Fig. S3G; 45.3 ± 4.2% pH3T3 loss, p < 0.0001). Taken together, these data confirm the selectivity of PDP-Nal driven PP1 substrate dephosphorylation.
PP1 inhibition through meiotic maturation impairs M-phase exit and reduces oocyte quality
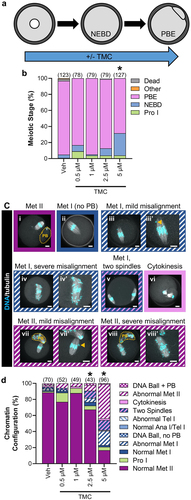
Prior studies investigating the role of PP1 in mammalian oocytes used inhibitors that inhibit both PP1 and PP2A (e.g., Okadaic Acid and CalA), which complicated interpretation of data and prevented ascribing effects to one or the other phosphatase. For our initial assessment of the functions of PP1 during mouse oocyte meiosis, we exposed oocytes to TMC for the duration of in vitro maturation (IVM; 0–16 h; ) and assessed the ability of oocytes to progress through meiosis I and to metaphase II. TMC at 5 µM impaired M-phase exit compared to vehicle control, as determined by the presence of a polar body (PB) by phase microscopy ( and Supp Table 1; Veh, 91.9% PB emission (PBE); 0.5 µM TMC 83.3% PBE, p = 0.723; 1 µM TMC 94.9% PBE, p = 0.5722; 2.5 µM TMC 86.1% PBE, p = 0.2382; 5 µM TMC 68.5% PBE, p < 0.0001). Using immunofluorescence, we further characterized the meiotic stage of oocytes and assessed features of oocyte quality. Oocytes were scored as normal or abnormal, with classification as abnormal if a normal metaphase II DNA plate was not present after 16 h of IVM (examples of abnormalities observed in ). PP1 inhibition resulted in a substantial increase in meiotic abnormalities in a dose-dependent manner compared to vehicle control (; meiotic abnormalities: Veh 11.4% abnormal; 0.5 µM TMC 23.1% abnormal, p = 0.1365; 1 µM TMC 12.2% abnormal, p=>0.9999; 2.5 µM TMC 32.6% abnormal, p = 0.0077; and 5 µM TMC 83.3% abnormal, p < 0.0001). These abnormalities ranged from oocytes being arrested in metaphase I () to two spindles with no PB (), with increasing doses of TMC leading to more severe defects.
Figure 3. PP1 inhibition for the duration of oocyte meiotic maturation reduces meiosis I exit in oocytes and causes meiotic abnormalities. (a) Schematic representation of the experimental design. Prophase I oocytes were cultured in medium lacking meiotic arrest reagents and containing TMC (0.5–5 µM) or vehicle control (0.1% DMSO) for 16 h. (b) Graphical representation of meiotic stage based on phase microscopy at 16 h into culture. Bar graph shows the percentages of oocytes at each meiotic stage. n = 78–127 oocytes over 4–6 replicates. * denotes a significant difference from Veh control oocytes (Fisher’s exact test). The numbers of oocytes at each meiotic stage is shown in Supplemental Table 1. (c) Representative images of the oocyte phenotypes observed, apostrophe denotes zoomed-in image, scale bar = 10 µM. Orange dashed line denotes the PB boundary, and orange arrow points to single misaligned chromosomes. (i) Normal metaphase II oocyte. Oocytes that underwent NEBD but had no PB with a normal (ii) metaphase I spindle, with (iii and iii’) mild chromosome misalignment, with (iv and iv’) severe chromosome misalignment, or with (v) two spindles. (vi) Oocyte at cytokinesis. Metaphase II oocytes, with (vii and vii’) mild chromosome misalignment, or with (viii and viii’) severe chromosome misalignment. Oocytes with DNA ball, ± PB refers to very condensed chromatin in the oocyte, with no obvious meiotic spindle (not shown). (d) Graphical representation of the meiotic stage and DNA morphology of oocytes at 16 h into culture. Solid colors represent normal DNA morphology for the meiotic stage, and hatched colors represent abnormal DNA morphology for the meiotic stage. n = 43–96 oocytes over 4–6 replicates. * denotes a significant difference from Veh control oocytes (Fisher’s exact test).
We attempted similar experiments treating oocytes with PDP-Nal for the duration of IVM to manipulate PP1 to an activated state [Citation37]. However, exposure of oocytes to PDP-Nal for the duration of IVM (0–16 h) resulted in 100% of oocytes dying. Taken together, these data highlight that oscillations in PP1 activity is essential for normal meiotic progression.
Reduced PP1 activity drives G2/M transition in oocytes
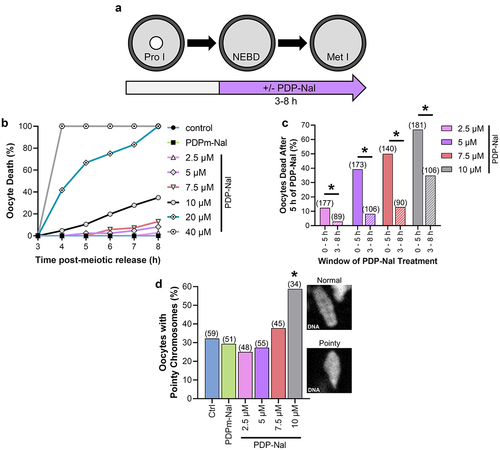
In mitosis, oscillations in PP1 activity are essential for M-phase progression, with decreased PP1 activity driving the G2/M transition and increased PP1 activity being crucial for metaphase/anaphase transition [Citation47]. This cyclic PP1 activity is driven in part by a CDK1-mediated inhibitory phosphorylation of PP1c (pPP1c(T320)) [Citation34,Citation35]. The kinetics of PP1 inhibitory phosphorylation follows an identical pattern in starfish and mouse oocytes, suggesting similar fluctuations in PP1 activity during oocyte meiosis [Citation4,Citation23]. Therefore, we sought to determine if a reduction in PP1 activity is critical for meiotic resumption by culturing oocytes in PDP-Nal during the G2/M transition (0–5 h post-meiotic arrest release; ). Oocytes were released from prophase I arrest into increasing concentrations of PDP-Nal, the negative control peptide (PDPm-Nal; which has no PP1c binding), or standard culture medium (Ctrl). G2/M transition, as determined by NEBD, was hampered by PP1 activation in a dose-dependent manner compared to PDPm-Nal treatment (; NEBD at 5 h: PDPm-Nal 86.7%; Ctrl 86.8%, p > 0.9999; 2.5 µM PDP-Nal 74.0%, p = 0.0031; 5 µM PDP-Nal 50.3%, p < 0.0001; 7.5 µM PDP-Nal 35.7%, p < 0.0001; 10 µM PDP-Nal 19.3%, p < 0.0001). Moreover, PP1 activation significantly reduced oocyte survival (; Dead oocytes at 5 h: PDPm-Nal 2.3%; Ctrl 0.6%, p = 0.2147; 2.5 µM PDP-Nal 12.4%, p = 0.0003; 5 µM PDP-Nal 39.5%, p < 0.0001; 7.5 µM PDP-Nal 50.0%, p < 0.0001; 10 µM PDP-Nal 66.9%, p < 0.0001). Critically, the majority of oocyte death was observed in prophase I oocytes, rather than oocytes that had resumed meiosis (; % of oocytes that died at prophase I: 2.5 µM 85.7%; 5 µM 83.5%; 7.5 µM 85.7%; 10 µM 91.7%).
Figure 4. PP1 activation impairs meiotic resumption. (a) Schematic representation of the experimental design. Prophase I oocytes were released from meiotic arrest into culture medium containing PDP-Nal (2.5–10 µM), 10 µM PDPm-Nal, or standard culture medium (Ctrl; 0 µM PDP-Nal). Nuclear envelope breakdown (NEBD) was monitored to track meiotic resumption. (b-c) Graphical representation of the percentage of oocytes to (b) resume meiosis (NEBD) or (c) die over time. n = 140–181 oocytes over 7–9 replicates. (d) Graphical representation of meiotic stage at oocytes death; n = 21–121 oocytes over 7–9 replicates. (e) Graphical comparison of pH3S10 fluorescence intensity. pH3S10 fluorescence was normalized to expression in Ctrl oocytes. Different letters denote a significant difference between the groups (Kruskal–Wallis test with Dunn’s post hoc). n = 13–41 oocytes over 2 replicates. Representative images of oocyte pH3S10 fluorescence, scale = 10 µm. (f) Graphical comparison of pH3T3 fluorescence intensity. pH3T3 fluorescence was normalized to expression in Ctrl oocytes. Different letters denote a significant difference between the groups (Kruskal–Wallis test with Dunn’s post hoc). n = 18–56 oocytes over 3–4 replicates. Representative images of oocyte pH3T3 fluorescence, scale = 10 µm. Scatter dot plots show each individual oocyte fluorescence intensity plus mean and SEM.
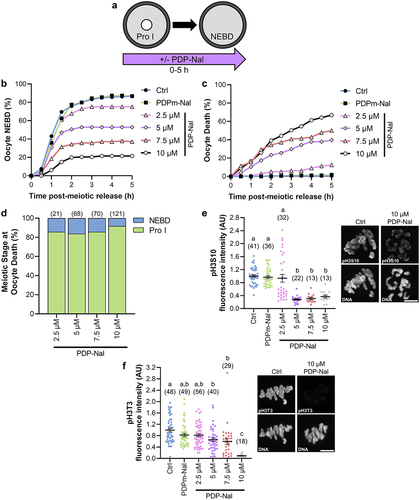
To confirm that PP1 was activated, we investigated the phosphorylation status of H3T3 and H3S10. pH3S10 was significantly decreased with 5, 7.5, and 10 µM PDP-Nal treatment compared to PDPm-Nal (; 2.5 µM, 3.2 ± 12% pH3S10 loss, p > 0.9999; 5 µM, 71.1 ± 2.3% pH3S10 loss, p < 0.0001; 7.5 µM, 68.2 ± 3.8% pH3S10 loss, p < 0.0001; 10 µM, 61.2 ± 1.7% pH3S10 loss, p = 0.0001). PP1 activation also caused a reduction of H3T3 phosphorylation, but this was only significant with the highest PDP-Nal concentration (10 µM) compared to PDPm-Nal oocytes (; 2.5 µM, 0.9 ± 5.2% pH3T3 loss, p > 0.9999; 5 µM, 20.1 ± 6.6% pH3T3 loss, p > 0.9999; 7.5 µM, 27.5 ± 1.1% pH3T3 loss, p = 0.2299; 10 µM, 88.6 ± 1.0% pH3T3 loss, p < 0.0001).
To further define the role of PP1 activity at G2/M transition, we evaluated inappropriate exit from prophase I arrest, in conjunction with TMC treatment. This assay employed a modification of culture conditions used to maintain robust prophase I arrest for extended periods (≥16 h), culturing oocytes in 2.5 μM of the phosphodiesterase 3 inhibitor milrinone [Citation48,Citation49]. To evaluate the effects of inhibiting PP1 on the maintenance of prophase I arrest, we used culture conditions that allow a portion of control oocytes to undergo the G2/M transition (NEBD) by culturing oocytes in a low concentration of milrinone (0.2 μM; ). With this lower concentration of milrinone (0.2 μM), 36.3% of Veh-treated oocytes were at prophase I arrest after 16 h of culture, compared to 6.0% of IVM control oocytes (no milrinone; p < 0.0001). Significantly more TMC-treated oocytes (2.5 µM and 5 µM TMC) underwent the G2/M transition (NEBD) and resumed meiosis as compared to Veh-treated, as reflected by a smaller percentage of oocytes in these treatment groups being at prophase I after 16 h ( and Supp Table 2; Veh 36.3%; 0.5 µM TMC 26.4%, p = 0.1280; 1 µM TMC 26.9%, p = 0.1336; 2.5 µM TMC 17.3%, p = 0.0007; 5 µM TMC 25.6%, p = 0.0375). However, despite an increase in G2/M transition with TMC treatment, the percentage of oocytes to exit M-phase was significantly reduced compared to vehicle control oocytes (; % of oocytes arrested at NEBD at 16 h: Veh 5.5%; 0.5 µM TMC 11.5%, p = 0.6916; 1 µM TMC 10.1%, p = 0.6943; 2.5 µM TMC 30.8%, p = 0.3228; 5 µM TMC 33.3%, p < 0.0001).
Figure 5. PP1 inhibition enhances NEBD, reduces M-phase exit, and causes meiotic abnormalities in oocytes in culture conditions that allow partial maintenance of prophase I arrest. (a) Schematic representation of the experimental design. Prophase I oocytes were washed into medium containing 0.2 µM milrinone and increasing amounts of TMC (0.5–5 µM) or vehicle control (0.1% DMSO) for 16 h; under these culture conditions, ~65% of oocytes will undergo the G2/M transition, exiting from prophase I arrest. (b) Graphical representation of meiotic stage based on phase microscopy at 16 h into culture. IVM Ctrl oocytes were cultured in milrinone-free medium. Bar graph shows the percentages of oocytes at each meiotic stage. n = 87–182 oocytes over 4–7 replicates. * denotes a significant difference from Veh control oocytes (Fisher’s exact test). The number of oocytes at each meiotic stage is shown in Supplemental Table 2. (c) Table of the numbers and percentages of prophase I oocytes with SN or NSN morphology, with representative images of SN and NSN DNA morphology. Orange arrow points to the nucleolus and scale bar = 10 µM. n = 37–65 oocytes over 4–7 replicates. * denotes a significant difference from Veh control oocytes (Fisher’s exact test. (d) Graphical representation of the meiotic stage and DNA morphology of oocytes at 16 h into culture. Solid colors represent normal DNA morphology for the meiotic stage, and hatched colors represent abnormal DNA morphology for the meiotic stage. n = 38–107 oocytes over 4–7 replicates. For all bar graphs, * denotes a significant difference from Veh control oocytes (Fisher’s exact test).
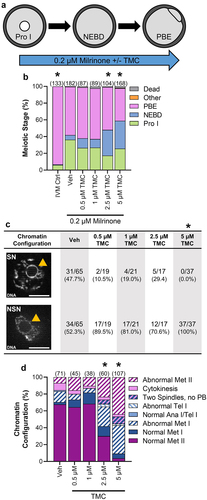
Additionally, two other effects of TMC treatment in these experiments were observed. First, the chromatin configuration of prophase I oocytes was altered by TMC treatment. Chromatin configuration in prophase I oocytes is characterized by the extent of condensation of the DNA around the nucleolus, with two categories: surrounded nucleolus (SN) with a ring of condensed DNA around the nucleolus, and non-surrounded nucleolus (NSN) with uncondensed DNA (). The transition from NSN to SN is correlated with acquisition of meiotic competence (ability of an oocyte to reach metaphase II) and with developmental potential (ability of a fertilized oocyte to support pre-implantation embryo development), and NSN oocytes display lower meiotic competence and developmental potential [Citation50,Citation51]. Veh-treated oocytes had equal numbers of SN and NSN prophase I oocytes. In contrast, 100% of prophase I oocytes treated with 5 µM TMC had NSN configuration (; Veh, 52.3% NSN; 5 µM TMC 100% NSN, p < 0.0001). A similar trend toward increased NSN configuration was also observed with 0.5 µM, 1 µM, and 2.5 µM TMC (; 0.5 µM, 89.5% NSN; 1 µM TMC 81.0% NSN; 2.5 µM TMC 70.6% NSN), but this did not reach significance. Power analysis was performed to establish the sample size needed to reject the null hypothesis (TMC treatment does not impact NSN rate) between two groups with NSN rates of 50% (observed Veh rate) and 70% (lowest observed NSN rate with TMC treatment) or 85% (hypothetical NSN rate). A sample size of 110 (50% vs. 70%) or 34 (50% vs. 85%) prophase I oocytes per group is needed to ensure appropriate statistical power. Due to the large sample size needed to detect a potential significant difference between 50% and 70% NSN, and the low levels of prophase I arrest in TMC-treated oocytes, we decided not to pursue if the lower doses of TMC (0.5–2.5 µM) were impacting NSN rate. The second effect of TMC treatment was observed in oocytes that had resumed meiosis. TMC treatment resulted in a dose-dependent increase in meiotic abnormalities, similar to those observed with 16 h TMC treatment under standard IVM conditions (; meiotic abnormalities: Veh 32.4% abnormal; 0.5 µM TMC 35.6% abnormal, p = 0.8405; 1 µM TMC 31.6% abnormal, p > 0.9999; 2.5 µM TMC 70.0% abnormal, p < 0.0001; and 5 µM TMC 96.3% abnormal, p < 0.0001). Taken together, these results confirm that reducing PP1 activity is central for G2/M transition in oocytes.
PP1 activation during M-phase reduces oocyte survival and alters chromosome shape
Having established that inhibition of PP1 is essential for the G2/M transition, we next sought to determine the effects of premature PP1 activation during M-phase. Oocytes were exposed to increasing concentrations of PDP-Nal from prometaphase (3 h post-meiotic arrest release) to metaphase I (8 h post-meiotic arrest release; ), when PP1 activity is low. We demonstrated that exposure to 10 µM PDP-Nal from prometaphase to metaphase I (3–8 h post-meiotic arrest release) decreased pH3T3 and pH3S10 levels (). These reductions in pH3T3 and pH3S10 were less than those observed with 10 µM PDP-Nal treatment in a different time window, 0–5 h post-meiotic arrest release. Therefore, to evaluate if we could achieve a higher extent of PP1 activation (and potentially lower pH3T3 and pH3S10 fluorescence signals at these time points), we tested two higher doses of PDP-Nal, 20 and 40 µM, which are required for sufficient PP1 activation in mitotic cells [Citation7,Citation37]. However, treating oocytes with these higher doses of PDP-Nal led to 100% cell death (; Dead oocytes at 8 h: 20 µM PDP-Nal 100% dead, p < 0.0001; 40 µM PDP-Nal 100% dead, p < 0.0001). Thus, subsequent experiments used PDP-Nal at 2.5, 5.0, 7.5, and 10 µM.
Figure 6. PP1 activation from prometaphase to metaphase of meiosis I decreases oocyte survival and alters chromosome morphology. (a) Schematic representation of the experimental design. Prophase I oocytes were released from meiotic arrest and cultured for 3 h before treatment with increasing concentrations of PDP-Nal (2.5–40 µM), PDPm-Nal (10 µM) or standard culture medium (Ctrl; 0 µM PDP-Nal). (b) Graphical representation of the percentage of oocyte death over time. n = 29–106 oocytes over 2–5 replicates. (c) Graphical representation of percentage of oocytes dead with 5 h of PDP-Nal treatment at G/2 M (0–5 h; solid color) or during meiosis I (3–8 h; hashed color). * denotes a significant difference between 0–5 h and 3–8 h PDP-Nal treated oocytes (Fisher’s exact test) (d) Graphical representation of the percentage of oocytes with at least one pointy chromosome, with sample images of DAPI staining showing chromosome morphology. n = 34–59 oocytes over five replicates. * denotes a significant difference from PDPm-Nal control oocytes (Fisher’s exact test). Scatter dot plots show each individual oocyte fluorescence intensity plus mean and SEM.
PP1 activation for this five-hour period from prometaphase to metaphase I caused a dose-dependent increase in oocyte death, compared to no death observed in PDPm-Nal-treated oocytes (; % of oocytes dead at 8 h: PDPm-Nal 0%; Ctrl 0%, p > 0.9999; 2.5 µM PDP-Nal 3.4%, p = 0.0963; 5 µM PDP-Nal 7.5%, p = 0.0068; 7.5 µM PDP-Nal 13.3%, p < 0.0001; 10 µM PDP-Nal 33.0%, p < 0.0001). We also compared the extent of oocyte death observed with 5 h of PDP-Nal treatment from prometaphase to metaphase I and during the G2/M transition (0–5 h post-meiotic arrest release). Surprisingly, PP1 activation for this five-hour period during M-phase (3–8 h post-meiotic arrest release) was less deleterious than PP1 activation for 5 h during the G2/M transition (0–5 h post-meiotic arrest release). Significantly higher numbers of oocytes survived PDP-Nal treatment during M-phase than during the G2/M transition (; 2.5 µM: 12.4% (0–5 h) vs. 2.9% (3–8 h) dead, p = 0.0151; 5 µM: 39.3% (0–5 h) vs. 8.2% (3–8 h) dead, p < 0.0001; 7.5 µM: 50% (0–5 h) vs. 13% (3–8 h) dead, p < 0.0001; 10 µM: 66.9% (0–5 h) vs. 34.9% (3–8 h) dead, p < 0.0001).
PP1 has roles in mitotic chromosome alignment and actin regulation [Citation52–55]. In oocytes, actin is essential for the migration of the meiotic spindle from the center of the oocyte to the cortex, and thus for asymmetrical cytokinesis [Citation56,Citation57]. Therefore, chromosome alignment on the metaphase I plate and the distance of the metaphase I plate to the cortex was assessed in oocytes following PP1 activation from prometaphase to metaphase I (3–8 h post-meiotic release). PP1 activation did not appear to affect these features of the metaphase I spindle (Supp Fig. S2). However, PP1 activation did alter the shape of individual chromosomes, with a shift from normal morphology of chromosomes with rounded ends, to chromosomes with pointy ends observed at 10 µM PDP-Nal treatment compared to PDPm-Nal (; Oocytes with at least one pointy chromosome: PDPm-Nal 29.4%; Ctrl 32.2%, p = 0.8372; 2.5 µM PDP-Nal 25.0%, p = 0.6577; 5 µM PDP-Nal 27.3%, p = 0.8322; 7.5 µM PDP-Nal 37.8%, p = 0.3964; 10 µM PDP-Nal 58.8%, p = 0.0127). Taken together, these results show that reduced PP1 activity during M-phase plays a key role in oocyte survival and chromosome architecture.
PP1 inhibition during M-phase slows the timing of meiosis I exit
We next sought to determine the effect of PP1 inhibition during M-phase, given that PP1 activity would be anticipated to be important for meiosis I exit. As our studies above found that TMC treatment for the duration of meiotic maturation impaired meiosis I exit (), we treated oocytes with 5 µM TMC from 0–7 h or 0–9 h post-meiotic arrest release (). These timepoints were selected because analyses of chromatin appearance () and phosphorylation of the PP1 substrate H3T3 in control untreated oocytes (Supp Fig. S3A) revealed that the 7-h timepoint corresponded to late prometaphase/early metaphase I with relatively low global PP1 activity, and the 9-h timepoint corresponded to the start of M-phase exit and relatively high global PP1 activity.
Figure 7. PP1 inhibition during meiosis I impairs M-phase exit. (a) Schematic representation of the experimental design. Prophase I oocytes were released from meiotic arrest and cultured in medium-containing TMC (5 µM) or vehicle control (0.1% DMSO) for 7 or 9 h. (b) Graphical representation of meiotic stages in control untreated oocytes at 7, 8, 9, and 10 h post-meiotic arrest release. n = 35–38 oocytes over two replicates. (c) Graphical representation of stages of meiotic exit at 9 h post-meiotic arrest release. * denotes a significant difference from Veh control oocytes (Fisher’s exact test). n = 50–79 oocytes over two replicates. (d) Graphical representation of chromosome alignment in metaphase I oocytes at 7 or 9 h post-meiotic arrest release. * denotes a significant difference (Fisher’s exact test). n = 27–56 oocytes over two replicates.
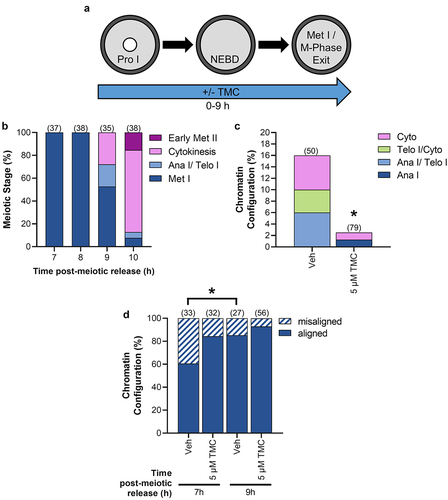
At 7 h, 100% of vehicle control and TMC-treated oocytes were at metaphase I (Veh, n = 54 oocytes; TMC, n = 50 oocytes). By 9 h, 16% of vehicle control oocytes were beginning to exit meiosis I, classified as anaphase I to cytokinesis, whereas only 2.5% TMC-treated oocytes reached this stage of M-phase exit (; p = 0.0134). We also examined the metaphase I plate of oocytes for chromosome alignment and distance from the cortex (as illustrated in Supp ). At 7 h, 60.6% of Veh-treated oocytes and 85.2% of TMC-treated oocytes had an aligned metaphase I plate (just outside of significance at p = 0.0514). At 9 h, 84.4% of Veh-treated had an aligned metaphase I plate (with this increase from 7 h being statistically significant, p = 0.0463), and 92.9% of TMC-treated oocytes had an aligned metaphase I plate (; p = 0.2764 as compared to 7 h). TMC treatment did not appear to affect metaphase spindle migration to the cortex, with no difference in the distance of the metaphase plate to the cortex between the vehicle control and TMC-treated groups (Supp Fig. S4).
Reduced PP1 activity from metaphase I onwards impairs M-phase exit, but has no detectable effects on oocyte quality
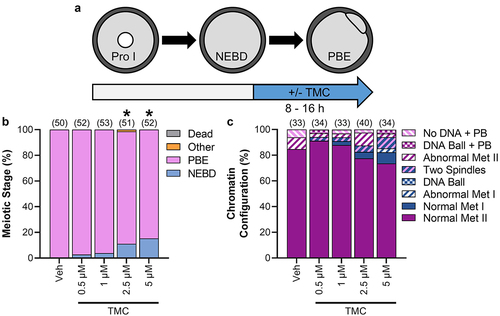
Our studies noted above () showed that TMC treatment for the duration of meiotic maturation significantly impaired meiosis I exit, with 19.8% of 5 µM TMC-treated oocytes arrested at metaphase I at 16 h IVM compared to 2.8% of Veh-treated oocytes. Similarly, PP1 inhibition in mitotic cells caused arrest at metaphase, with PP1 found to have essential roles at the metaphase/anaphase transition [Citation26]. To determine if the metaphase I arrest phenotype we observed resulted from a loss of PP1 activity specifically at metaphase I/anaphase I transition, oocytes were treated with TMC in this precise time window from metaphase I onward (8–16 h post-meiotic arrest release; ). TMC treatment during this time of meiosis reduced M-phase exit compared to vehicle control, as determined by the presence of a polar body by phase microscopy ( and Supp Table 3; Veh, 100% PBE; 0.5 µM TMC 97.3% PBE, p = 0.9999; 1 µM TMC 96.2% PBE, p = 0.4955; 2.5 µM TMC 87.6% PBE, p = 0.0267; 5 µM TMC 84.7% PBE, p < 0.0001). However, the extent of impaired M-phase exit in these experiments was substantially less than that observed with TMC treatment for the duration of meiosis (0–16 h post-meiotic arrest release). Furthermore, TMC treatment during this time of meiosis did not cause the meiotic abnormalities observed with the longer duration treatment (; meiotic abnormalities: Veh 15.2% abnormal; 0.5 µM TMC 8.8% abnormal, p = 0.4763; 1 µM TMC 12.1% abnormal, p > 0.9999; 2.5 µM TMC 22.5% abnormal, p = 0.5542; and 5 µM TMC 26.5% abnormal, p = 0.3689). These results point to PP1 having critical roles earlier in meiosis.
Figure 8. PP1 inhibition from metaphase I onwards impairs meiosis I exit, but has no impact on meiotic abnormalities. (a) Schematic representation of the experimental design. Prophase I oocytes were released from meiotic arrest into standard culture medium for 8 h before being cultured in medium containing TMC (0.5–5 µM) or vehicle control (0.1% DMSO). (b) Graphical representation of meiotic stage based on phase microscopy at 16 h into culture. Bar graph shows the percentage of oocytes at each meiotic stage. n = 50–52 oocytes over two replicates. * denotes a significant difference from Veh control oocytes (Fisher’s exact test). For the total number of oocytes at each meiotic stage see Supplemental Table 3. (c) Graphical representation of the meiotic stage and DNA morphology of oocytes at 16 h into culture. Solid colors represent normal DNA morphology for the meiotic stage, and hatched colors represent abnormal DNA morphology for the meiotic stage. n = 33–40 oocytes over two replicates.
Discussion
Temporal fluctuations in protein phosphorylation is essential for M-phase entry and progression. Kinases have a well-established role in this process, although the contributions of phosphatases during M-phase is poorly understood. Here, we establish that loss of oscillations in PP1 activity causes a range of severe meiotic defects in mammalian oocytes, pointing to crucial roles for PP1 in oocyte meiosis and, more broadly, M-phase regulation.
PP1 and chromatin architecture
PP1 plays a key role in regulating chromatin architecture in a variety of systems [Citation58,Citation59]. We found that PP1 inhibition and activation altered chromatin configuration at prophase I and metaphase I, respectively, suggesting that PP1 has important functions in chromatin architecture during oocyte meiosis. Prophase I oocytes have two chromatin configuration states: uncondensed euchromatin (NSN) or a condensed heterochromatin ring that surrounds the nucleolus (SN) [Citation60]. PP1 inhibition increased the proportion of prophase I oocytes with NSN chromatin configuration. As oocytes gain the ability to undergo the G2/M transition and exit from prophase I arrest (acquiring an ability known as meiotic competence), there is a shift from NSN to SN chromatin [Citation50,Citation51], with this shift accompanied by a translocation of PP1 to the nucleus [Citation16,Citation19]. Post-translational modifications, including phosphorylation of H3, play a major role in heterochromatin formation. In somatic cells, dephosphorylation of S28 on H3 (H3S28) via the PP1 holoenzyme, PP1c:RepoMan, is fundamental for heterochromatin formation [Citation61]. H3S28 is phosphorylated in mouse prophase I oocytes, with pH3S28 dephosphorylated in a PP1/PP2A-dependent manner at prophase I [Citation18]. Our findings, taken with these studies, suggest that PP1 plays a role in chromatin configuration changes at the NSN-to-SN transition, potentially via PP1-mediated H3S28 dephosphorylation. Therefore, it is possible that the observed change in chromatin configuration with PP1 inhibition is a product of SN heterochromatin decondensing, however, whether this results in a subsequent loss of meiotic competence is unknown.
Condensins and phosphorylation of H3 play a vital role in metaphase chromosome architecture [Citation62–65]. During M-phase, H3 is phosphorylated at T3 by Haspin and at S10 by Aurora B and C [Citation41,Citation42,Citation66,Citation67], and this phosphorylation of H3 at T3 and S10 contributes to the recruitment of condensin to chromosomes. Additionally, in mouse oocytes, active Haspin is required for the chromosomal localization of Aurora C and condensin at metaphase I [Citation41,Citation68]. Our data show that PP1 activation reduced M-phase phosphorylation of two PP1 substrates, H3 at T3 and at S10. Notably, the abnormal pointy chromosome architecture observed with PP1 activation is phenocopied in mouse oocytes with oocyte-specific conditional loss of condensin or with Haspin inhibition [Citation41,Citation69]. Therefore, activation of PP1, and subsequent reduction of pH3T3 and pH3S10 may lead to loss of chromosome condensin, ultimately causing the observed chromosome abnormalities. Further studies are warranted to determine how PP1 regulates chromosome architecture during M-phase.
Active pools of PP1 in prometaphase impact M-phase exit and oocyte quality
In mitosis, PP1 plays a pivotal role in the metaphase/anaphase transition (e.g. silencing the spindle assembly checkpoint and APC/CCDC20 activation) and cytokinesis. In human mitotic cells, PP1 inhibition or siRNA-mediated loss of PP1 leads to delayed metaphase/anaphase transition, metaphase arrest, and binucleated cells (a sign of cytokinesis failure) [Citation6,Citation26–29]. We found a similar phenotype in TMC-treated oocytes, with PP1 inhibition for the duration of meiosis (0–16 h post-meiotic arrest release) causing metaphase I arrest or meiotic abnormalities (e.g., chromosome misalignment at metaphase II or cytokinetic failure (oocytes with two spindles without a polar body)). On the other hand, TMC-treatment from metaphase I-to-metaphase II arrest (8–16 h post-meiotic arrest release) showed remarkably few abnormalities, with oocytes largely able to form a normal metaphase II oocyte by 16 h. These disparate results point to an exciting new role for PP1 during prometaphase that establishes the ability of oocytes to undergo metaphase I/anaphase I transition and form a normal metaphase II oocyte. Approximately 40% of PP1 escapes the CDK1-mediated inhibitory phosphorylation of T320, such that there is a substantial subpopulation of PP1 that could be active to mediate this novel function for PP1 in prometaphase [Citation70]. Our data further confirm the presence of an active pool of PP1, with a significant increase in pH3T3 observed in oocytes treated with TMC during prometaphase (0–7 h post-meiotic arrest release).
There are two probable causes of the abnormalities observed in oocytes treated with TMC for the duration of meiosis (0–16 h): (1) continued phosphorylation of prometaphase PP1 substrates, and (2) altered protein stability. Prometaphase PP1 substrates have been revealed in a recent study of meiotic phosphorylation dynamics in starfish oocytes, with a subset of CalA (PP1/PP2A inhibitor) sensitive protein phosphorylations peaking at NEBD and decreasing by metaphase I [Citation23]. In oocytes with PP1 inhibition for the duration of meiosis (0–16 h), these early M-phase PP1 phospho-sites could be maintained, likely contributing to the defects observed in these oocytes. In contrast, in oocytes with PP1 inhibition only during metaphase I (8–16 h), these early M-phase PP1 phospho-sites would not be affected, thus being a possible explanation for the differences in the effects of TMC treatments during these two time windows. Protein phosphorylation, including phosphorylation affected by PP1, also plays a role in targeting of proteins to the proteasome, and therefore protein half-life. PP1-mediated dephosphorylation prevents proteasome-mediated degradation of specific proteins (PER2 and MYC) [Citation71,Citation72]. Additionally, PP1-mediated dephosphorylation of CDC20 plays a role in activating APC/CCDC20, the major E3 ligase involved in the degradation of pro-M-phase proteins at metaphase/anaphase transition [Citation6,Citation73]. Degradation of the APC/CCDC20 substrates securin and cyclin B starts in prometaphase of oocytes and is essential for metaphase I/anaphase I transition and accurate chromosome segregation [Citation74,Citation75]. Consequently, PP1 inhibition in oocytes at prometaphase may alter the degradation kinetics of proteins, impacting M-phase progression. Our results show that an active pool of PP1 during prometaphase is essential for M-phase exit and the formation of normal metaphase II oocytes. The specific PP1 holoenzymes and their substrates involved in these prometaphase events remain to be identified.
PP1 activity is needed to maintain metaphase I chromosome congression
PP1 inhibition during prometaphase (0–7 h post-meiotic arrest release) appears to accelerate chromosome alignment compared to controls. However, this chromosome alignment is lost in oocytes that fail to exit metaphase I by 16 h of maturation. A possible explanation for this observation relates to PP1’s kinetochore functions. At the kinetochores, PP1 is in a feedback loop with PP2A-B56. The changing activity of these phosphatases has essential roles in chromosome alignment and microtubule-kinetochore attachments [Citation52]. PP2A-B56 initializes microtubule-kinetochore attachments, aligns chromosomes, and recruits PP1 to the kinetochore, with PP1 then stabilizing microtubule-kinetochore attachments and removing PP2A-B56 from the kinetochore [Citation76–78]. Thus, PP1 inhibition may favor kinetochore-associated PP2A-B56 and accelerate chromosome congression initially (as observed at 7 h), but then later, failure to stabilize microtubule-kinetochore attachments could cause chromosome misalignment in metaphase I oocytes at 16 h.
Timing of PP1 activation impacts oocyte survival
As discussed above, the timing of PP1 inhibition significantly impacts M-phase outcomes in oocytes. Similarly, treatment of oocytes with PDP-Nal at G2/M transition (0–5 h post-meiotic arrest release) reduces oocyte viability significantly more than PDP-Nal treatment during M-phase (3–8 h post-meiotic arrest release). The interplay between kinase and phosphatase activity is markedly different during these two treatment periods. Prophase I arrest (equivalent to G2 in mitosis) is a pro-phosphatase state characterized by high phosphatase (e.g., PP1 and PP2A) and low kinase (e.g., CDK1) activity. At the G2/M transition, this kinase/phosphatase interplay reverses, resulting in high kinase and low phosphatase activity during M-phase [Citation3,Citation79–81]. Therefore, the increased sensitivity of oocytes to PDP-Nal treatment during G2/M transition may result from an increase in the pro-phosphatase state (i.e. low CDK1 activity, even higher PP1 activity) at the start of PDP-Nal treatment. Conversely, following M-phase entry, oocytes are in a pro-kinase state; consequently, PDP-Nal needs to reactivate PP1 and counter kinases that have already established high activity, potentially causing less PP1 activation during M-phase than G2/M transition. In support of this hypothesis, PDP-Nal treatment caused a 2-to-2.5-fold greater loss of PP1 substrates pH3T3 and pH3S10 at G2/M transition (0–5 h post-meiotic arrest release) compared to M-phase (3–8 h post-meiotic arrest release). Another possible cause for the high sensitivity of G2/M transition oocytes to PDP-Nal treatment is the change in composition of PP1 holoenzymes (PP1c:RIPPO) through meiosis. RIPPOs control activity, substrates, and localization of the PP1 catalytic subunit. Because of this, the RIPPOs incorporated into the PP1 holoenzyme change throughout M-phase, which allows for PP1’s diverse M-phase functions. PDP-Nal activates PP1 via outcompeting RIPPOs for PP1c binding sites, resulting in the uncoupling of PP1c from RIPPO regulation [Citation46]. However, the ability of PDP-Nal to outcompete RIPPOs is dependent on what RIPPOs are bound to PP1c [Citation46]. Therefore, the reduced viability of oocytes treated with PDP-Nal at G2/M transition compared to M-phase might result from M-phase stage-specific differences in PDP-Nal’s ability to uncouple PP1c from RIPPO regulation and could be indicative of different regulatory partners at these meiotic stages.
Conclusion
In summary, we found that (a) PP1 has critical roles at multiple stages of mammalian oocyte meiosis and (b) impairing the anticipated oscillations in PP1 activity negatively impacts M-phase. Importantly, we show for the first time that the timing of PP1 inhibition/activation significantly influences meiotic outcomes. Our study also highlights the advantage of mouse oocytes for studying PP1 at discrete subphases of M-phase (e.g. prometaphase vs. metaphase). The extended time frame of M-phase in mouse oocytes (~10 h from G2/M to M-phase exit) allows for the investigation of PP1’s roles at specific subphases of M-phase that is not currently possible in M-phase of mammalian cell lines. Demonstrating the importance of this evaluation of PP1 at specific subphases of M-phase, our study found a novel role for PP1 in prometaphase that is essential for M-phase exit. Taken together, our results establish the vital role PP1 plays in mammalian oocyte meiosis, and therefore, female fertility. More broadly, this study underscores the need for accurate phosphatase regulation during M-phase.
Author contributions
Conceptualization: NJC and JPE; Data acquisition: NJC and IV; Data curation: NJC; Formal analysis: NJC and IV; Funding acquisition: JPE; Methodology: NJC and JPE; Resources: JPE; Supervision: NJC and JPE; Visualization: NJC; Writing – original draft: NJC; Writing – review & editing: NJC, IV, and JPE.
Ethics approval
All experiments were performed in accordance with the NIH Guidelines of the USA for Care and Use of Laboratory Animals. Protocols for animal handling were approved by Purdue Universities Institutional Animal Care and Use Committee.
Supplemental Material
Download Zip (2.6 MB)Acknowledgements
The authors gratefully acknowledge Malgorzata Trebacz and Maja Köhn (University of Freiburg) for providing the PP1 activators and control (PDP-Nal and PDPm-Nal). We also thank Brittany Allen-Petersen and Jennifer Ikle for critical reading of the manuscript.
Disclosure statement
No potential conflict of interest was reported by the authors.
Supplementary material
Supplemental data for this article can be accessed online at https://doi.org/10.1080/15384101.2023.2225924.
Data availability statement
All data supporting the findings of this study can be found within the article and its supplementary materials.
Additional information
Funding
References
- Hassold T, Hunt P. To err (meiotically) is human: the genesis of human aneuploidy. Nat Rev Genet. 2001;2(4):280–291. doi: 10.1038/35066065
- Nagaoka SI, Hassold TJ, Hunt PA. Human aneuploidy: mechanisms and new insights into an age-old problem. Nat Rev Genet. 2012;13(7):493–504. doi: 10.1038/nrg3245
- Crncec A, Hochegger H. Triggering mitosis. FEBS Lett. 2019;593(20):2868–2888. doi: 10.1002/1873-3468.13635
- Adhikari D, Zheng W, Shen Y, et al. Cdk1, but not Cdk2, is the sole Cdk that is essential and sufficient to drive resumption of meiosis in mouse oocytes. Hum Mol Genet. 2012;21(11):2476–2484. doi: 10.1093/hmg/dds061
- St-Denis N, Gupta GD, Lin ZY, et al. Phenotypic and interaction profiling of the human phosphatases identifies diverse mitotic regulators. Cell Rep. 2016;17(9):2488–2501. doi: 10.1016/j.celrep.2016.10.078
- Bancroft J, Holder J, Geraghty Z, et al. PP1 promotes cyclin B destruction and the metaphase–anaphase transition by dephosphorylating CDC20. Mol Biol Cell. 2020;31(21):2315–2330. doi: 10.1091/mbc.E20-04-0252
- Rogers S, Fey D, McCloy RA, et al. PP1 initiates the dephosphorylation of MASTL, triggering mitotic exit and bistability in human cells. J Cell Sci. 2016;129:1340. doi: 10.1242/jcs.179754
- Ma S, Vigneron S, Robert P, et al. Greatwall dephosphorylation and inactivation upon mitotic exit is triggered by PP1. J Cell Sci. 2016;129:1329. doi: 10.1242/jcs.178855
- Grallert A, Boke E, Hagting A, et al. A PP1–PP2A phosphatase relay controls mitotic progression. Nature. 2015;517(7532):94–98. doi: 10.1038/nature14019
- Tang A, Shi P, Song A, et al. PP2A regulates kinetochore-microtubule attachment during meiosis I in oocyte. Cell Cycle. 2016;15(11):1450–1461. doi: 10.1080/15384101.2016.1175256
- Hu M-W, Wang Z-B, Jiang Z-Z, et al. Scaffold subunit Aalpha of PP2A is essential for female meiosis and fertility in mice. Biol Reprod. 2014;91(1):19. doi: 10.1095/biolreprod.114.120220
- Alexandre H, Van Cauwenberge A, Tsukitani Y, et al. Pleiotropic effect of okadaic acid on maturing mouse oocytes. Development. 1991;112(4):971–980. doi: 10.1242/dev.112.4.971
- Schwartz DA, Schultz RM. Stimulatory effect of okadaic acid, an inhibitor of protein phosphatases, on nuclear envelope breakdown and protein phosphorylation in mouse oocytes and one-cell embryos. Dev Biology. 1991;145(1):119–127. doi: 10.1016/0012-1606(91)90218-R
- Mailhes JB, Hilliard C, Fuseler JW, et al. Okadaic acid, an inhibitor of protein phosphatase 1 and 2A, induces premature separation of sister chromatids during meiosis I and aneuploidy in mouse oocytes in vitro. Chromosome Res. 2003;11(6):619–631. doi: 10.1023/A:1024909119593
- Gavin A-C, Tsukitani Y, Schorderet-Slatkine S. Induction of M-phase entry of prophase-blocked mouse oocytes through microinjection of okadaic acid, a specific phosphatase inhibitor. Exp Cell Res. 1991;192(1):75–81. doi:10.1016/0014-4827(91)90159-R
- Smith GD, Sadhu A, Mathies S, et al. Characterization of protein phosphatases in mouse oocytes. Dev Biology. 1998;204(2):537–549. doi: 10.1006/dbio.1998.9043
- Swain JE, Wang X, Saunders TL, et al. Specific inhibition of mouse oocyte nuclear protein phosphatase-1 stimulates germinal vesicle breakdown. Mol Reprod Dev. 2003;65(1):96–103. doi: 10.1002/mrd.10258
- Swain JE, Ding J, Brautigan DL, et al. Proper chromatin condensation and maintenance of histone H3 phosphorylation during mouse oocyte meiosis requires protein phosphatase activity. Biol Reprod. 2007;76(4):628–638. doi: 10.1095/biolreprod.106.055798
- Wang X, Swain JE, Bollen M, et al. Endogenous regulators of protein phosphatase-1 during mouse oocyte development and meiosis. Reproduction. 2004;128(5):493–502. doi: 10.1530/rep.1.00173
- Wang L-I, Das A, McKim KS, et al. Sister centromere fusion during meiosis I depends on maintaining cohesins and destabilizing microtubule attachments. PLoS Genet. 2019;15(5):e1008072. doi: 10.1371/journal.pgen.1008072
- Hattersley N, Cheerambathur D, Moyle M, et al. A nucleoporin docks protein phosphatase 1 to direct meiotic chromosome segregation and nuclear assembly. Dev Cell. 2016;38(5):463–477. doi: 10.1016/j.devcel.2016.08.006
- Oppedisano L, Haines G, Hrabchak C, et al. The rate of aneuploidy is altered in spermatids from infertile mice. Hum Reprod. 2002;17(3):710–717. doi: 10.1093/humrep/17.3.710
- Swartz SZ, Nguyen HT, McEwan BC, et al. Selective dephosphorylation by PP2A-B55 directs the meiosis I-meiosis II transition in oocytes. Elife. 2021;10:e70588. doi: 10.7554/eLife.70588
- Bollen M, Peti W, Ragusa MJ, et al. The extended PP1 toolkit: designed to create specificity. Trends Biochem Sci. 2010;35(8):450–458. doi: 10.1016/j.tibs.2010.03.002
- Heroes E, Lesage B, Görnemann J, et al. The PP1 binding code: a molecular-lego strategy that governs specificity. FEBS J. 2013;280(2):584–595. doi: 10.1111/j.1742-4658.2012.08547.x
- Winkler C, De Munter S, Van Dessel N, et al. The selective inhibition of protein phosphatase-1 results in mitotic catastrophe and impaired tumor growth. J Cell Sci. 2015;128:4526. doi: 10.1242/jcs.175588
- Bhowmick R, Thakur RS, Venegas AB, et al. The RIF1-PP1 axis controls abscission timing in human cells. Curr Biol. 2019;29(7):1232–42.e5. doi: 10.1016/j.cub.2019.02.037
- Cheng A, Dean NM, Honkanen RE. Serine/Threonine protein phosphatase type 1γ1 is required for the completion of cytokinesis in human A549 lung carcinoma cells. J Biol Chem. 2000;275(3):1846–1854. doi: 10.1074/jbc.275.3.1846
- Capalbo L, Bassi ZI, Geymonat M, et al. The midbody interactome reveals unexpected roles for PP1 phosphatases in cytokinesis. Nat Commun. 2019;10(1):4513. doi: 10.1038/s41467-019-12507-9
- Conti D, Gul P, Islam A, et al. Kinetochores attached to microtubule-ends are stabilised by Astrin bound PP1 to ensure proper chromosome segregation. Elife. 2019;8:e49325. doi: 10.7554/eLife.49325
- Margolis SS, Walsh S, Weiser DC, et al. PP1 control of M phase entry exerted through 14-3-3-regulated Cdc25 dephosphorylation. Embo J. 2003;22(21):5734–5745. doi: 10.1093/emboj/cdg545
- Smith RJ, Cordeiro MH, Davey NE, et al. PP1 and PP2A use opposite phospho-dependencies to control distinct processes at the kinetochore. Cell Rep. 2019;28(8):2206–19.e8. doi: 10.1016/j.celrep.2019.07.067
- Nasa I, Rusin SF, Kettenbach AN, et al. Aurora B opposes PP1 function in mitosis by phosphorylating the conserved PP1-binding RVxF motif in PP1 regulatory proteins. Sci Signaling. 2018;11(530):11. doi: 10.1126/scisignal.aai8669
- Kwon YG, Lee SY, Choi Y, et al. Cell cycle-dependent phosphorylation of mammalian protein phosphatase 1 by cdc2 kinase. Proceedings of the National Academy of Sciences of the United States of America. 1997; 94:2168–2173.
- Dohadwala M, da Cruze Silva EF, Hall FL, et al. Phosphorylation and inactivation of protein phosphatase 1 by cyclin-dependent kinases. Proc Natl Acad Sci USA. 1994; 91:6408–6412 doi: 10.1073/pnas.91.14.6408.
- Mitsuhashi S, Matsuura N, Ubukata M, et al. Tautomycetin is a novel and specific inhibitor of serine/threonine protein phosphatase type 1, PP1. Biochem Biophys Res Commun. 2001;287(2):328–331. doi: 10.1006/bbrc.2001.5596
- Wang Y, Hoermann B, Pavic K, et al. Interrogating PP1 activity in the MAPK pathway with optimized PP1-disrupting peptides. Chembiochem. 2019;20(1):66–71. doi: 10.1002/cbic.201800541
- Kalous J, Solc P, Baran V, et al. PKB/AKT is involved in resumption of meiosis in mouse oocytes. Biol Cell. 2006;98(2):111–123. doi: 10.1042/BC20050020
- Fabritius AS, Ellefson ML, McNally FJ. Nuclear and spindle positioning during oocyte meiosis. Curr Opinion Cell Biol. 2011;23(1):78–84. doi: 10.1016/j.ceb.2010.07.008
- Mitsuhashi S, Shima H, Tanuma N, et al. Usage of tautomycetin, a novel inhibitor of protein phosphatase 1 (PP1), reveals that PP1 is a positive regulator of Raf-1 in vivo. J Biol Chem. 2003;278(1):82–88. doi: 10.1074/jbc.M208888200
- Nguyen AL, Gentilello AS, Balboula AZ, et al. Phosphorylation of threonine 3 on histone H3 by haspin kinase is required for meiosis I in mouse oocytes. J Cell Sci. 2014;127:5066–5078. doi: 10.1242/jcs.158840
- Wang Q, Wei H, Du J, et al. H3 Thr3 phosphorylation is crucial for meiotic resumption and anaphase onset in oocyte meiosis. Cell Cycle (Georgetown, Tex). 2016;15(2):213–224. doi: 10.1080/15384101.2015.1121330
- Han SJ, Vaccari S, Nedachi T, et al. Protein kinase B/Akt phosphorylation of PDE3A and its role in mammalian oocyte maturation. Embo J. 2006;25(24):5716–5725. doi: 10.1038/sj.emboj.7601431
- Reither G, Chatterjee J, Beullens M, et al. Chemical activators of protein phosphatase-1 induce calcium release inside intact cells. Chem Biol. 2013;20(9):1179–1186. doi: 10.1016/j.chembiol.2013.07.008
- Beullens M, Vulsteke V, Van Eynde A, et al. The C-terminus of NIPP1 (nuclear inhibitor of protein phosphatase-1) contains a novel binding site for protein phosphatase-1 that is controlled by tyrosine phosphorylation and RNA binding. Biochem J. 2000;352(Pt 3):651–658. doi: 10.1042/bj3520651
- Chatterjee J, Beullens M, Sukackaite R, et al. Development of a peptide that selectively activates protein phosphatase‐1 in living cells. Angewandte Chemie. 2012;51(40):10054–10059. doi: 10.1002/anie.201204308
- Moura M, Conde C. Phosphatases in mitosis: roles and regulation. Biomolecules. 2019;9(2):55. doi: 10.3390/biom9020055
- Stein P, Schindler K. Mouse oocyte microinjection, maturation and ploidy assessment. J Vis Exp. 2011;53:2851. doi: 10.3791/2851-v
- Tsafriri A, Chun S-Y, Zhang R, et al. Oocyte maturation involves compartmentalization and opposing changes of camp levels in follicular somatic and germ cells: studies using selective phosphodiesterase inhibitors. Dev Biology. 1996;178(2):393–402. doi: 10.1006/dbio.1996.0226
- Zuccotti M, Ponce RH, Boiani M, et al. The analysis of chromatin organisation allows selection of mouse antral oocytes competent for development to blastocyst. Zygote. 2002;10(1):73–78. doi: 10.1017/S0967199402002101
- Bellone M, Zuccotti M, Redi CA, et al. The position of the germinal vesicle and the chromatin organization together provide a marker of the developmental competence of mouse antral oocytes. Reproduction. 2009;138(4):639–643. doi: 10.1530/REP-09-0230
- Vallardi G, Cordeiro MH, Saurin AT. A kinase-phosphatase network that regulates kinetochore-microtubule attachments and the SAC. In: Black B, editor Centromeres and kinetochores: discovering the molecular mechanisms underlying chromosome inheritance. Springer Cham; 2017. pp. 457–484 978-3-319-58592-5 .
- Carmody LC, Baucum AJ 2nd, Bass MA, et al. Selective targeting of the γ1 isoform of protein phosphatase 1 to F-actin in intact cells requires multiple domains in spinophilin and neurabin. FASEB J. 2008;22(6):1660–1671. doi: 10.1096/fj.07-092841
- Canals D, Roddy P, Hannun YA. Protein phosphatase 1α mediates ceramide-induced erm protein dephosphorylation: a novel mechanism independent of phosphatidylinositol 4, 5-biphosphate (PIP2) and myosin/ERM phosphatase. J Biol Chem. 2012;287(13):10145–10155. doi: 10.1074/jbc.M111.306456
- Vallée B, Cuberos H, Doudeau M, et al. LIMK2-1, a new isoform of human LIMK2, regulates actin cytoskeleton remodeling via a different signaling pathway than that of its two homologs, LIMK2a and LIMK2b. Biochem J. 2018;475(23):3745–3761. doi: 10.1042/BCJ20170961
- Evans JP, Robinson DN. The spatial and mechanical challenges of female meiosis. Mol Reprod Dev. 2011;78(10–11):769–777. doi: 10.1002/mrd.21358
- Uraji J, Scheffler K, Schuh M. Functions of actin in mouse oocytes at a glance. J Cell Sci. 2018;131(22):131. doi:10.1242/jcs.218099
- Gil RS, Vagnarelli P. Protein phosphatases in chromatin structure and function. Biochim Biophys Acta, Mol Cell Res. 2019;1866(1):90–101. doi: 10.1016/j.bbamcr.2018.07.016
- Bui H-T, Yamaoka E, Miyano T. Involvement of histone H3 (Ser10) phosphorylation in chromosome condensation without Cdc2 kinase and mitogen-activated protein kinase activation in pig oocytes. Biol Reprod. 2004;70(6):1843–1851. doi: 10.1095/biolreprod.103.026070
- Bogolyubova I, Bogolyubov D. Heterochromatin morphodynamics in late oogenesis and early embryogenesis of mammals. Cells. 2020;9(6):1497. doi: 10.3390/cells9061497
- de Castro IJ, Budzak J, Di Giacinto ML, et al. Repo-man/PP1 regulates heterochromatin formation in interphase. Nat Commun. 2017;8(1):14048. doi: 10.1038/ncomms14048
- Hirota T, Lipp JJ, Toh B-H, et al. Histone H3 serine 10 phosphorylation by Aurora B causes HP1 dissociation from heterochromatin. Nature. 2005;438(7071):1176–1180. doi: 10.1038/nature04254
- Fischle W, Tseng BS, Dormann HL, et al. Regulation of HP1–chromatin binding by histone H3 methylation and phosphorylation. Nature. 2005;438(7071):1116–1122. doi:10.1038/nature04219
- Piskadlo E, Tavares A, Oliveira RA. Metaphase chromosome structure is dynamically maintained by condensin I-directed DNA (de)catenation. Elife. 2017;6:e26120. doi: 10.7554/eLife.26120
- Hirota T, Gerlich D, Koch B, et al. Distinct functions of condensin I and II in mitotic chromosome assembly. J Cell Sci. 2004;117(26):6435–6445. doi: 10.1242/jcs.01604
- Qian J, Lesage B, Beullens M, et al. PP1/Repo-man dephosphorylates mitotic histone H3 at T3 and regulates chromosomal aurora B targeting. Curr Biol. 2011;21(9):766–773. doi: 10.1016/j.cub.2011.03.047
- Balboula AZ, Schindler K, Ohkura H. Selective disruption of aurora C kinase reveals distinct functions from auroraB kinase during meiosis in mouse oocytes. PLoS Genet. 2014;10(2):e1004194. doi: 10.1371/journal.pgen.1004194
- Giet R, Glover DM. Drosophila aurora B kinase is required for histone H3 phosphorylation and condensin recruitment during chromosome condensation and to organize the central spindle during cytokinesis. J Cell Bio. 2001;152(4):669–682. doi: 10.1083/jcb.152.4.669
- Lee J, Ogushi S, Saitou M, et al. Condensins I and II are essential for construction of bivalent chromosomes in mouse oocytes?. Mol Biol Cell. 2011;22(18):3465–3477. doi: 10.1091/mbc.e11-05-0423
- Olsen JV, Vermeulen M, Santamaria A, et al. Quantitative phosphoproteomics reveals widespread full phosphorylation site occupancy during mitosis. Sci Signaling. 2010;3(104):ra3–ra. doi: 10.1126/scisignal.2000475
- Gallego M, Kang H, Virshup DM. Protein phosphatase 1 regulates the stability of the circadian protein PER2. Biochem J. 2006;399(1):169–175. doi: 10.1042/BJ20060678
- Dingar D, Tu WB, Resetca D, et al. MYC dephosphorylation by the PP1/PNUTS phosphatase complex regulates chromatin binding and protein stability. Nat Commun. 2018;9(1):3502. doi: 10.1038/s41467-018-05660-0
- Kim T, Lara-Gonzalez P, Prevo B, et al. Kinetochores accelerate or delay APC/C activation by directing Cdc20 to opposing fates. Genes Dev. 2017;31(11):1089–1094. doi: 10.1101/gad.302067.117
- Thomas C, Wetherall B, Levasseur MD, et al. A prometaphase mechanism of securin destruction is essential for meiotic progression in mouse oocytes. Nat Commun. 2021;12(1):4322. doi: 10.1038/s41467-021-24554-2
- Levasseur MD, Thomas C, Davies OR, et al. Aneuploidy in oocytes is prevented by sustained CDK1 activity through degron masking in cyclin B1. Dev Cell. 2019;48(5):672–684. doi: 10.1016/j.devcel.2019.01.008
- Xu P, Raetz EA, Kitagawa M, et al. BUBR1 recruits PP2A via the B56 family of targeting subunits to promote chromosome congression. Biol Open. 2013;2(5):479–486. doi: 10.1242/bio.20134051
- Nijenhuis W, Vallardi G, Teixeira A, et al. Negative feedback at kinetochores underlies a responsive spindle checkpoint signal. Nat Cell Biol. 2014;16(12):1257–1264. doi: 10.1038/ncb3065
- Liu D, Vleugel M, Backer CB, et al. Regulated targeting of protein phosphatase 1 to the outer kinetochore by KNL1 opposes Aurora B kinase. J Cell Bio. 2010;188(6):809–820. doi: 10.1083/jcb.201001006
- Lemonnier T, Dupré A, Jessus C. The G2-to-M transition from a phosphatase perspective: a new vision of the meiotic division. Cell Div. 2020;15(1):9. doi: 10.1186/s13008-020-00065-2
- Li J, Qian WP, Sun QY. Cyclins regulating oocyte meiotic cell cycle progression. Biol Reprod. 2019;101(5):878–881. doi: 10.1093/biolre/ioz143
- Kishimoto T. MPF-based meiotic cell cycle control: half a century of lessons from starfish oocytes. Proc Jpn Acad Ser B Phys Biol Sci. 2018;94(4):180–203. doi: 10.2183/pjab.94.013