
Abstract
Objective
The objectives of this study were to evaluate computationally efficient small female (54.1 kg, 149.9 cm) and midsize male (78.4 kg, 174.9 cm) models with active muscles using volunteer sled test data in a frontal-oblique loading direction and check their response in crash mitigating maneuvers using field test data.
Methods
The Global Human Body Models Consortium small female (F05-OS+Active) and midsize male (M50-OS+Active) simplified occupant models with active musculature were used in this study. The data from a total of 48 previously published sled test experiments were used to simulate a total of 16 simulations. The experimental study recorded occupant responses of six small female and six midsize male volunteers (n = 12 total) in two muscle conditions (relaxed and braced) at two acceleration pulses representing pre-crash braking (1.0 g) and a low-speed impact (2.5 g). Each model’s kinematics and reaction forces were compared with experimental data. Along with sled test simulations, both of these models were simulated in abrupt braking, lane change, and turn and brake events using literature data. A total of 36 field test simulations were carried out. A CORA analysis was carried out using reaction load and displacement time-history data for sled test simulations and head CG displacement time-history was used for field test simulations.
Results
The occupant peak forward and lateral excursion results of both active models reasonably matched the volunteer data in the low-speed sled test simulations for both pulse severities. The differences between the active and control models were statistically significant (p-value < 0.05) based on the results of Wilcoxon signed-rank tests using peak forward and lateral excursion data. The average CORA scores calculated for the sled test (sled test: M50-OS+Active= 0.543, male control= 0.471, F05-OS+Active= 0.621, female control= 0.505) and field test (M50-OS+Active= 0.836, male control= 0.466, F05-OS+Active= 0.832, female control= 0.787) simulations were higher for active models than control.
Conclusions
The responses of the F05-OS+Active and M50-OS+Active models were better than control models based on overall CORA scores calculated using both sled and field tests. The results highlight their ability to predict occupant kinematics in crash-mitigating maneuvers and low-speed impacts in the frontal, lateral and frontal-oblique directions.
Introduction
While frontal crash events remain the most frequently encountered crash mode for vehicle occupants (62% of all crashes in the U.S. (NHTSA Citation2019)), the oblique crash mode is a key area of study for several reasons. A review of real-world left offset and left small overlap frontal crashes showed that even a small overlap produces oblique kinematics, increasing injuries due to components like A-pillar and door (Rudd et al. Citation2011). Another reason is self-directed evasive maneuvering: when drivers detect upcoming crashes they tend to brake and steer the vehicle (Hault-Dubrulle et al. Citation2011; Scanlon et al. Citation2015). In addition to driver-initiated maneuvers, crash-mitigating maneuvers carried out by advanced driver assistance systems (ADAS) are one of the reasons that move occupants away from their nominal posture (Osth et al. Citation2013; Reed, Ebert, Park, et al. Citation2018). All these cases are situations where occupants move in a lateral direction in vehicles with a traditional seating arrangement, but with the advancement in autonomous driving technologies, vehicle occupants are expecting comfortable seating arrangements with seats that can be rotated (Jorlöv et al. Citation2017). These new seating arrangements in highly automated vehicles (HAV) may turn a frontal impact event into an oblique one if the seat is rotated.
The federal policy published in 2016 states that all HAVs should fully protect their occupants in any planned seating and interior configuration (NHTSA Citation2016). While HAVs may be years from wide-scale deployment, other ADAS systems are making their way steadily into the market. Driver assistance systems like autonomous braking and emergency lane assist are a few examples of crash-avoidance systems, whereas adaptive restraint systems that adjust airbags, seatbelts, and steering column parameters based on occupant characteristics will reduce injuries during a collision. These systems are relatively recent additions to the safety offerings in many vehicles and some areas for improvement have been indicated. One study suggested that active safety systems are capable of reducing injury to the head, neck, and lower extremities but they may increase the risk of chest injuries due to higher stresses (Boyle et al. Citation2020).
Finite element human body models (FEHBMs) have been one of the advanced tools for designing new safety systems due to their ability to predict occupant kinematics and injuries. The use of FEHBMs for studying alternative principal directions of force (PDOFs), including the oblique condition and HAV conditions, has been investigated by many researchers (Kitagawa et al. Citation2017; Gayzik et al. Citation2018). Gayzik et al. (Citation2018) reported higher neck injury criteria values when the seat was rotated 30° from the forward-facing seating position in a frontal collision, creating an oblique trajectory for the occupant, compared to a frontal PDOF. Another study about frontal crashes by Kitagawa et al. (Citation2017) observed greater T1 displacements for the occupants in lateral or frontal-oblique impacts compared to the frontal. All these studies simulated frontal crash scenarios, but none of them focused on the effect of pre-crash maneuvers.
Pre-crash maneuvers like braking and steering move occupants away from a nominal posture (Hault-Dubrulle et al. Citation2011), which increases the injury risk, and the potential for serious injuries may further increase if the occupant braces before the crash (Nie et al. Citation2018). Consequently, it is important to study the effect of muscle state, occupant awareness, and posture before simulating any crash event. Boyle et al. (Citation2020) studied the effect of occupant diversity and pre-crash posture on the risk of injury. They simulated crash events by positioning models in pre-crash postures due to braking events and then simulated frontal crashes using different restraint system designs. As per their findings, the pre-crash posture had a significant influence on the outcome of the crash event. Simulating pre-crash events with passive HBMs may not produce accurate results when compared against experimental data from same body habitus volunteers as they lack active muscle response (Kato et al. Citation2017; Devane et al. Citation2019). Although researchers have used active HBMs in frontal low-speed impacts, braking events, and steering maneuvers (Osth et al. Citation2012; Kato et al. Citation2017; Devane et al. Citation2019), all of these studies were limited to midsize male models.
There are a limited number of studies that have focused on validating small female active HBMs (Iwamoto et al. Citation2013; Mishra et al. Citation2020; Devane et al. Citation2022). Mishra et al. developed an active model for the 5th percentile female of the Chinese population and validated it in 1 g braking events with limited data comparison. Iwamoto et al. (Citation2013) used the THUMS AF05 model to simulate low-speed rear impact. Devane et al. (Citation2022) calibrated both midsize male and small female models in pre-crash braking and low-speed impacts in the frontal direction with only relaxed volunteer data. None of these studies have extensively evaluated female models in relaxed and braced muscle conditions in pre-crash braking and low-speed impact events and/or acceleration in multiple directions. The availability of small female-specific data in pre-crash and low-speed events is limited (Osth et al. Citation2013; Reed, Ebert, Park, et al. Citation2018; Chan, Albert, et al. Citation2021; Chan et al. Citation2022). This study presents volunteer sled test experimental data for small females and midsize males in pre-crash and low-speed events in relaxed and braced muscle conditions and its use to assess same-body habitus model responses.
Considering the importance of active HBMs for predicting occupant kinematics in multiple directions in pre-crash events, this study is focused on the performance evaluation of two active HBMs using experimental sled and field tests. These two models represent the midsize male and small female populations. The first objective of this study was to evaluate GHBMC midsize male and small female simplified occupant models in an oblique direction using volunteer experimental sled test data. The experimental data consists of volunteer responses in pre-crash braking and low-speed impacts in an oblique direction in relaxed and braced muscle conditions. The second objective was to compare the model responses to field test data in various pre-crash maneuvers. The field test data consists of subject head CG excursion in abrupt braking, lane change, and turn and brake events.
Methods
The Global Human Body Model Consortiums (GHBMC) midsize male (M50-OS+Active v2.3: weight = 78.4 kg, height = 174.9 cm) and small female (F05-OS+Active v2.3: weight = 54.1 kg, height = 149.9 cm) simplified occupant models with active musculatures were used in this study (Devane et al. Citation2019, Citation2022). Both active models use one-dimensional (1 D) beam elements to model all the major skeletal muscles of the body (n = 232). These models were validated in frontal pre-crash braking and low-speed impact tests in previous studies (Devane et al. Citation2019, Citation2022), and this study is focused on evaluating them in frontal-oblique scenarios. All the simulations in this study were carried out using Ansys LS-DYNA (Ansys LST, Livermore, CA, USA).
Volunteer sled test experimental data
The detailed experimental procedure and the volunteers’ kinematics were previously reported (Chan, Albert, et al. Citation2021; Chan et al. Citation2022). A total of 12 (6 females and 6 males) volunteers were involved in the study. Female volunteers (height: mean = 156.6 cm, range = 146.5 − 163.9 cm; weight: mean = 50 kg, range = 46 − 52.2 kg) represent small females and male volunteers (height: mean = 175.9 cm, range = 173.4 − 179.4 cm; weight: mean = 76.1 kg, range = 70.6 − 80.1 kg) represent midsize males (Schneider Citation1983). All test procedures were reviewed and approved by the Virginia Tech IRB (IRB #17-1008). All volunteers were required to sign an informed consent form before participating in the study and at the beginning of each test day. Each volunteer was subjected to two pulse severities (1.0 g and 2.5 g) and with two muscle conditions (relaxed and braced) in a rigid seat buck. The relaxed volunteers were unaware of the start of the acceleration pulse, whereas braced volunteers were informed and asked to brace themselves before the acceleration pulse was applied. The seat buck was rotated on the sled to represent a PDOF of 330° (). The mean acceleration pulses, calculated across volunteers, in the X and Y directions measured by accelerometers placed on the buck aligned with the local buck coordinate system are shown in Figures A1 and A2 (see online supplement). The volunteers’ motion was captured using a VICON motion capture system. The orientation of the coordinate system used for the VICON motion capture is shown in . The measurement procedure for the reaction forces was described in a previous study (Devane et al. Citation2022). This study reports reaction forces and volunteer kinematics time-history data from the sled experiments that have not been published before.
Figure 1. Schematic of oblique impact experimental setup.
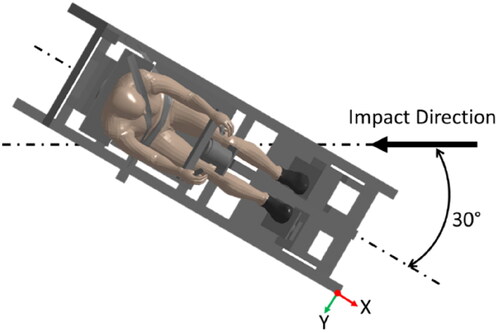
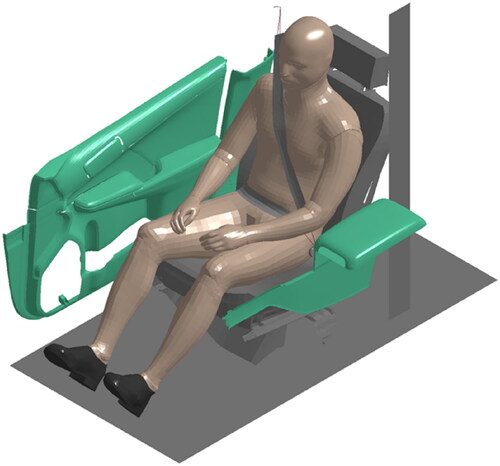
Figure 2. Setup for simulating field tests.
Volunteer sled test simulation setup
For simulating the oblique loading of the seating buck, acceleration pulses were applied in the frontal (Figure A1, see online supplement) and lateral directions (Figure A2, see online supplement). Due to this, it was not necessary to rotate the setup about the global Z-axis and a direct comparison of volunteer kinematics was possible as the experimental study reported volunteer kinematics in the local buck coordinate system. Both F05-OS+Active and M50-OS+Active models were prepared for these simulations using the same procedure mentioned in previous studies (Chan, Devane, et al. Citation2021; Devane et al. Citation2022). A total of 16 sled test simulations were carried out with two models at two pulse severities (1.0 g and 2.5 g), two muscle activation states (with and without muscle activation), and two muscle conditions (relaxed and braced) (). In relaxed muscle condition, the muscles were activated after the acceleration pulse was applied, whereas in the braced muscle condition simulations the muscles were activated before the acceleration pulse and the model was bracing against the buck, which is in line with the experimental study. The relaxed and braced muscle condition simulations had different settling times at the start of the experimental case simulation (Chan, Devane, et al. Citation2021). Due to this, the total simulation times were different for relaxed and braced case simulations. The models without muscle activation (F05-OS and M50-OS) were the controls in this study and were run with the same boundary conditions that were used for both relaxed and braced case simulations of active models to make sure they are run the same way as active models.
Table 1. Volunteer sled test simulation matrix.
The contact forces were measured and used to compare them with the forces at the steering column, seat back, seat pan, left foot, and right foot. The shoulder seatbelt force was measured at the upper D-ring and the lap belt force was measured near the anchor point similar to the test measurement locations.
Volunteer field test simulation setup
To simulate volunteer field tests in a production car, data from Reed, Ebert, Park, et al. (Citation2018) were used. A simplified version of the passenger side of the car was created using a seat, a door, and a center console model (). The acceleration pulses used to simulate abrupt braking (blue line), lane change (orange line), and turn and brake (green and pink line) events are shown in Figure A3 (see online supplement). The lane change (1.5 s) was the shortest event of these three events, whereas turn and brake (3.5 s) was the longest event and the abrupt braking event was 2.5 s long. A total of 36 field test simulations were carried out using F05-OS+Active and M50-OS+Active (), 6 of which were without muscle activation (control). All the field test simulations were carried out using relaxed muscle conditions, similar to the sled test simulations, to replicate unaware volunteers from the field tests. For each model, all three events were simulated with 5 different initial head postures. The head of the baseline model was rotated by 15° about the local x- (left-right) and y-axis (anterior-posterior) as shown in Figure A4 (see online supplement). This sub-study was carried out to evaluate the effect of head posture on the model response. The 15° angle of rotation was chosen so that the initial position of the models falls toward the farthest boundary of the volunteer initial head position ellipse and it was kept constant for all four rotation directions. For each simulation head CG x-, y-, and z-displacements were measured and compared with volunteer field test data (Reed, Ebert, Jones, et al. Citation2018; Reed, Ebert, Park, et al. Citation2018). The upper extremity PID controllers were turned off for both models for field test simulations to avoid unrealistic arm motion. In the experimental study, volunteers were holding a piece of paper with their arms resting on their lap, which justifies turning off upper extremity PID controllers. The trunk controller gains (proportional, integral, and derivative) for the male model were updated for the field test simulations based on literature data (Devane et al. Citation2022).
Figure 3. Comparison of head CG peak forward excursion of both models in braking event (top view). The head outline was created using the midsize male model and the CG of the head was placed at the experimental mean.
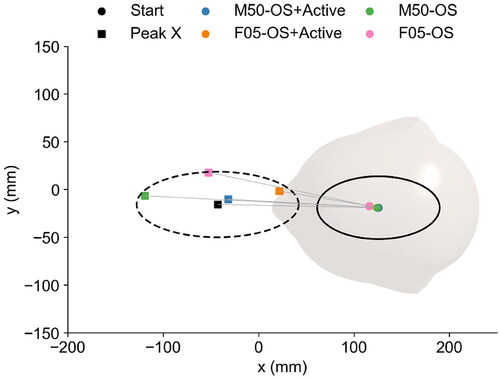
Figure 4. Comparison of head CG peak lateral excursion of both models in lane change event (top view). The head outline was created using the midsize male model and the CG of the head was placed at the experimental mean.
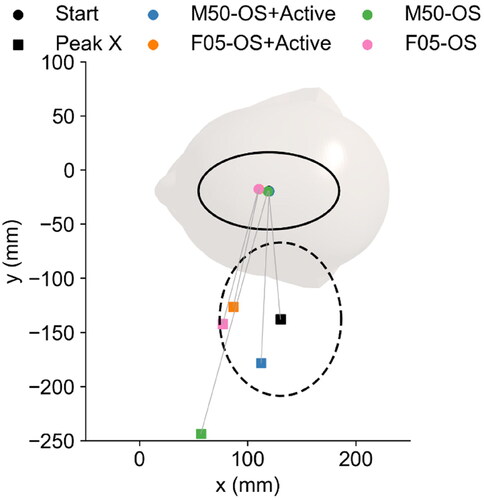
Table 2. Field tests simulation matrix.
Quantitative analysis
The quantitative analysis was carried out using CORA analysis (CORAplus 4.04) and the CORA settings used are reported in Table A1 (see online supplement). The CORA score is a combination of corridor and cross-correlation (phase, magnitude, and shape) ratings used to compare the model response curve with an experimental curve. The CORA score ranges from 0 to 1, with 0 being no correlation and 1 as a perfect correlation. The CORA is a useful tool for making a direct comparison between two models and suggesting which one better correlates with experimental data. An overall CORA score for each model was calculated using the average CORA scores from the sled test and field test simulations. For sled test simulations reaction force and displacement time-history data were used and for the field test simulations head CG forward (braking and turn and brake) and lateral excursion (lane change and turn and brake) time-history data were used in the CORA analysis. The mean ± SD and mean ± 2SD corridors were used as inner and outer corridors for the calculation of corridor score. The Wilcoxon signed-ranked test was used to test if the differences between control and active models are statistically significant using peak forward and lateral excursion values and a significance value of alpha = 0.05 for all the sled test simulations. All the peak lateral excursions were measured until the point of peak forward excursion.
Results
Volunteer sled test simulations
The peak forward and lateral excursions of the different body markers for the model and the volunteers in the sled test simulations are reported in Tables A7–A10 (see online supplement) and are shown in Figures A5–A12 (see online supplement). The peak forward and lateral excursions were reduced with muscle activation. The peak lateral excursions of C7, right shoulder, and elbow for relaxed 2.5 g cases were underestimated by both active and control male models in comparison with volunteer data (Figure A8, see online supplement). For all other cases, excursion of the active model correlated better with volunteer data than the control model, which is evident in the displacement plots in the sagittal and transverse plane of various body markers of both the models with and without muscle activation compared against individual volunteer data (Figures A13–A52, see online supplement). The x-, y-, and z-displacement time-history data of various body markers are plotted against volunteer data in Figures A53–A112 (see online supplement). The head CG x-displacement time-history curve for both active models falls within the experimental corridor (Figures A53 and A54, see online supplement).
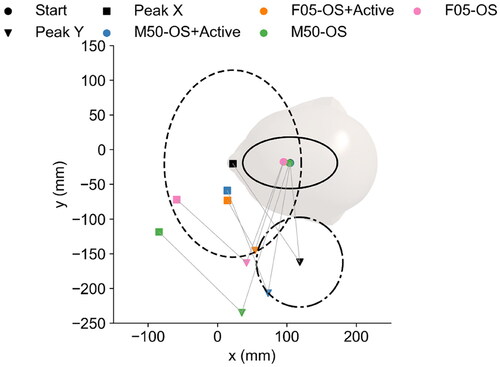
Figure 5. Comparison of head CG peak lateral and forward excursion of both models in turn and brake event (top view). The head outline was created using the midsize male model and the CG of the head was placed at the experimental mean.
The reaction forces at the steering column, seat back, seat pan, left foot, and right foot and seatbelt forces for both male and female models are plotted against volunteer data in Figures A113–A126 (see online supplement). All time-history plots contain data for the volunteer (Midsize Male/Small Female) mean, mean ± SD, and mean ±2SD corridors and model data with (M50-OS+Active/F05-OS+Active) and without muscle activation (M50-OS/F05-OS). The foot forces in relaxed conditions for both active and control models closely track the volunteer data, but for the braced muscle conditions, the active models captured the initial bracing forces (Figures A113–A116, see online supplement). The average CORA scores for both female and male models for sled test simulations, calculated using reaction forces and x-, y-, and z-displacements of various body markers, are reported in along with the p-value of the Wilcoxon signed-rank test, which used peak forward and lateral excursion data, and detailed CORA analysis results are provided in Tables A2–A5 (see online supplement). For both male and female active models in sled test simulations, the average CORA scores are greater than the control models indicating an improved match to the data in all cases (). The F05-OS+Active and M50-OS+Active models demonstrated improved performance in braced conditions. The differences in peak forward and lateral excursion between active and control models were statistically significant ().
Table 3. Comparison of CORA scores for both models in relaxed and braced muscle conditions for volunteer sled tests and Wilcoxon signed-rank test p-value using peak forward and lateral excursion data.
Volunteer field test simulations
For each field test braking simulation, head CG peak forward excursion and forward displacement time-history data are plotted against volunteer response (Reed, Ebert, Park, et al. Citation2018) in , A127, and A128 (see online supplement) for both the models with and without muscle activation. The head CG peak lateral excursion and lateral displacement time-history data for the lane change event for both models are compared in , A129, and A130 (see online supplement). For the turn and brake event, forward and lateral displacement volunteer time-history data was available along with peak lateral and forward excursion, which is plotted against both model responses in Figures A131 and A132 (see online supplement) and . The solid black ellipse with the black dot at the center in all the peak excursion plots represents the start position of volunteer head CG whereas the dashed black ellipse and black square are used for peak forward excursion in braking and turn and brake event and peak lateral excursion in lane change event. The dash-dotted black ellipse with a black triangle represents peak lateral excursion in the turn and brake event. For all the peak excursion plots ellipses were created using mean ± 1.64 SD of the volunteer data on each axis. Both control models had higher forward and lateral excursion than their active models in all three events and CORA scores reflect that (). The peak forward and lateral excursion data in all three cases for both models are reported in Table A11 (see online supplement). The detailed CORA scores for both models in all three events are reported in Table A6 (see online supplement).
Table 4. Average CORA scores of both models in field tests simulations.
The head CG of both male and female active models was rotated about the local x- and y-axis to check if the head posture has any effect on model response. The simulation results with 5 different head postures for all three events are reported in Figures A133–A141 (see online supplement) for M50-OS+Active and Figures A142–A150 (see online supplement) for F05-OS+Active. The percentage changes in average CORA scores of field test simulations for both active models were in the range of −3.6% to 4.8% for the female models and for the male models the range was −5.4% to 5.0%, which is lower compared to the difference between control and active models.
The differences observed between the male and female models in both sled and field tests were similar to what was reported in previous studies (Reed, Ebert, Park, et al. Citation2018; Chan, Albert, et al. Citation2021). The head CG, C7, left and right shoulder, and left elbow forward and lateral excursion of the female model was less compared to the male model (Tables A7–A10, see online supplement) in the sled tests. Similarly, the head CG forward and lateral excursion of the female model was less than the male model in the field tests (Table A11, see online supplement). The active female model’s average CORA scores were generally higher than the active male model in almost every simulation condition.
Discussion
For the control model, CORA scores were lower () and forward and lateral excursions were higher than the active model in all the cases simulated in this study. This suggests that the active models provide a better correlation with experimental data and are suitable for predicting occupant kinematics in pre-crash and low-speed events. The CORA scores for the sled test simulations reported in this study are comparatively low for both models if compared with the previous studies (Devane et al. Citation2019, Citation2022). The previous studies only used either 7 (Devane et al. Citation2022) or 13 (Devane et al. Citation2019) signals for resultant reaction forces and accelerations to calculate the CORA score, and no comparisons of displacement time-history data were carried out. In this study, the average CORA score for the sled test simulations was calculated by averaging all signal scores (37 signals for each case).
Table 5. Overall CORA scores of both models.
The foot forces for the active models in sled test simulations are within the experimental corridor in the initial part of the simulation but after some time, they exceed the volunteer data corridors. This might be due to higher target angles for the leg and/or the higher integral gains for the lower extremity. Initially, forces are within volunteer corridors, but as time passes they move away from the corridors. The integral term adds the effect of past errors and is one of the reasons for overshooting in PID controllers. Similar observations were made for the male model in braced 2.5 g cases for seatback and seat pan forces. Notable differences in the seatback forces between active and control models were observed in braced muscle conditions for both male and female models (Figures A121 and A122, see online supplement). The seatbelt forces were well outside the corridors for control models in braced cases, but more closely tracked the volunteer behavior when using muscle activation (Figures A123–A126, see online supplement). Overall, both male and female active models are better at representing volunteer experiment reaction forces in braced conditions than control models.
The initial position of the M50-OS+Active and F05-OS+Active baseline models in field test simulations was inside the start position volunteer data ellipses for all three events except F05-OS+Active in the side view plot for the braking event. The reason why the F05-OS+Active model falls outside that corridor is the size of the model is on the lower side of the experimental subject pool. The F05-OS+Active model sitting height is 800 mm and only 2 subjects (772 and 799 mm) out of 87 (Reed, Ebert, Park, et al. Citation2018) were shorter than the model. Only male control model peak excursions and displacement fall outside the volunteer corridors in all three events. Both control and active models failed to capture the initial displacement trajectory of head CG in the forward direction in turn and brake event. Due to this, the CORA scores for the turn and brake event are lower than the other events (Table A6, see online supplement), and also turn and brake event uses two time-history signals to calculate CORA scores. All the models tended to move in the forward direction while moving laterally in the lane change event and turn and brake event, whereas subjects moved backward. In field test simulations, subjects were asked to read a paper during the test but after realizing the vehicle maneuver they may have adjusted the posture to sit more upright while moving their head rearward. Due to this, the subjects’ heads may have moved backward in the field tests while the models are unable to capture this behavior. This is one of the areas that need further investigation.
The upper extremity PID controllers were turned off for both models and trunk PID controller gains were changed for the male model based on a previous study (Devane et al. Citation2022) in field test simulations. All three events simulated are of front passengers who were asked to read a paper while keeping their hands on their laps. This makes it difficult for the occupants to brace themselves using their arms and all the forward motion is controlled by the trunk muscles of the passengers, whereas drivers use their arm and trunk muscles for bracing. For the male model, default controller gains were lower than what was used in Devane et al. (Citation2022). Using controller gains for the trunk muscles from Devane et al. (Citation2022) improved male model performance in the field test simulations.
This study utilized small female-specific volunteer data in sled test simulations to evaluate the performance of an active female human model in multiple directions (frontal, frontal-oblique, and lateral). The midsize male model performance was assessed simultaneously in the study, which had similar responses as that of midsize male volunteers. All the field tests had a mix of volunteer sizes and shapes and both male and female model measurements lie inside the volunteer measurement ranges. One of the goals of the study was to see if both male and female model responses were within the respective experimental corridors, and results suggest that they are. Both model responses were different in all the cases, which suggests that the occupant response changes with size. Consequently, just one or two models are not sufficient to represent all the occupants. In future studies, multiple models can be developed using morphing techniques similar to previous studies (Hu et al. Citation2019; Boyle et al. Citation2020), and then used to study occupant responses for various sizes and shapes. Apart from occupant characteristics, initial conditions have a significant effect on occupant kinematics (Reed et al. Citation2021). As per Reed et al. (Citation2021), if the occupant seat is in a more-forward position then the occupant head forward excursion was smaller compared to the more-rearward position due to more belt wrapping around the shoulder, which was the case with the female model in sled tests simulations. The female model was more-forward compared to the male model. For field test simulations the seat position was the same for both models, but the anchor location was different, which might have played some role in reducing the excursion of the female model in field test simulations. It would be interesting to study the effect of anchor location, seatbelt routing, and seat position on occupant response with models of varying sizes and shapes.
The experimental tests (Reed, Ebert, Park, et al. Citation2018; Chan, Albert, et al. Citation2021; Chan et al. Citation2022) used in this study represent both laboratory and field tests. The sled tests used were for the driver, whereas the field test data were for the front passenger. In all of these driver and passenger scenarios, responses from both active models were better correlated with the experimental data than the control models. The results highlight their ability to predict occupant kinematics in pre-crash maneuvers as well as low-speed impacts in the frontal and lateral directions. The differences observed between the control and active model strongly support the need for HBMs with active musculature in long-duration low-speed events. Both these models are evaluated in frontal (relaxed muscle condition) (Devane et al. Citation2022) and frontal-oblique (relaxed and braced muscle condition) pre-crash and low-speed events and based on the CORA scores they are better than control models at predicting occupant kinematics in these events.
In addition to the limitations discussed throughout the discussion, there are two more limitations of the study. First, the bones in these models were modeled as rigid bodies, and the pronation and supination of the arms are restricted as the ulna and radius are modeled as one rigid part. The effect of this constraint on occupant kinematics will be part of future work. Second, the foot forces in the braced conditions for the active models go outside volunteer corridors after some time which can be addressed by changing the target angles for the lower extremity joints and/or by lowering the integral gain of the lower extremity PID controllers.
Supplemental Material
Download Zip (16.6 MB)Acknowledgments
All simulations were run on the DEAC cluster at Wake Forest University with support from Stevens Cody and Adam Carlson.
Disclosure statement
Scott Gayzik is a member of Elemance, LLC., which distributes academic and commercial licenses for the use of GHBMC-owned computational human body models.
Additional information
Funding
References
- Boyle K, Fanta A, Reed MP, Fischer K, Smith A, Adler A, Hu J. 2020. Restraint systems considering occupant diversity and pre-crash posture. Traffic Inj Prev. 21(sup1):S31–S36.
- Chan H, Albert DL, Gayzik FS, Kemper AR. 2021. Assessment of acclimation of 5th percentile female and 50th percentile male volunteer kinematics in low-speed frontal and frontal-oblique sled tests. SAE Int J Trans Safety. 9(1):3–103.
- Chan H, Albert DL, Gayzik FS, Kemper AR. 2022. Occupant kinematics of braced 5th percentile female and 50th percentile male volunteers in low-speed frontal and frontal-oblique sled tests. IRCOBI Conference, Porto, Portugal.
- Chan H, Devane KS, Albert DL, Gayzik FS, Kemper AR. 2021. Comparisons of initial joint angles and test buck reaction forces for relaxed and braced 5th percentile female and 50th percentile male volunteers and analogous active human body models in a simulated driver’s seat. IRCOBI Conference, Online.
- Devane K, Chan H, Albert D, Kemper AR, Gayzik FS. 2022. Implementation and calibration of active small female and average male human body models using low-speed frontal sled tests. Traffic Inj Prev. (In press). doi: 10.1080/15389588.2022.2114078.
- Devane K, Johnson D, Gayzik FS. 2019. Validation of a simplified human body model in relaxed and braced conditions in low-speed frontal sled tests. Traffic Inj Prev. 20(8):832–837.
- Gayzik F, Koya B, Davis M. 2018. A preliminary study of human model head and neck response to frontal loading in nontraditional occupant seating configurations. Traffic Inj Prev. 19(sup1):S183–S186.
- Hault-Dubrulle A, Robache F, Pacaux M-P, Morvan H. 2011. Determination of pre-impact occupant postures and analysis of consequences on injury outcome. Part I: A driving simulator study. Accid Anal Prev. 43(1):66–74.
- Hu J, Zhang K, Reed MP, Wang J-T, Neal M, Lin C-H. 2019. Frontal crash simulations using parametric human models representing a diverse population. Traffic Inj Prev. 20(sup1):S97–S105.
- Iwamoto M, Nakahira Y, Kimpara H, Min K. 2013. Development of a finite element model of 5th percentile female with multiple muscles and its application to investigation on impact responses of elderly females. Paper Presented at Proceedings of the 23rd ESV Conference, Seoul, Korea.
- Jorlöv S, Bohman K, Larsson A. 2017. Seating positions and activities in highly automated cars–a qualitative study of future automated driving scenarios. Paper presented at: International Research Conference on the Biomechanics of Impact, Antwerp, Belgium.
- Kato D, Nakahira Y, Iwamoto M. 2017. A study of muscle control with two feedback controls for posture and reaction force for more accurate prediction of occupant kinematics in low-speed frontal impacts. Paper presented at 25th International Technical Conference on the Enhanced Safety of Vehicles (ESV) National Highway Traffic Safety Administration, Detroit, Michigan, USA.
- Kitagawa Y, Hayashi S, Yamada K, Gotoh M. 2017. Occupant kinematics in simulated autonomous driving vehicle collisions: influence of seating position, direction and angle. SAE Technical Paper 2017-22-0005. doi: 10.4271/2017-22-0005
- Mishra A, Ghosh P, Chitteti R, Mayer C. 2021. Development of a Chinese 5th percentile female active human body model. IRCOBI Asia, Online.
- NHTSA. 2016. Federal automated vehicles policy: Accelerating the next revolution in roadway safety. Washington, DC: US Department of Transportation.
- NHTSA. 2019. Traffic safety facts 2017: A compilation of motor vehicle crash data. Washington (DC): U.S. Department of Transportation. National Highway Traffic Safety Administration National Center for Statistics and Analysis. Report No. DOT HS 812 806.
- Nie B, Sathyanarayan D, Ye X, Crandall JR, Panzer MB. 2018. Active muscle response contributes to increased injury risk of lower extremity in occupant–knee airbag interaction. Traffic Inj Prev. 19(sup1):S76–S82.
- Osth J, Brolin K, Carlsson S, Wismans J, Davidsson J. 2012. The occupant response to autonomous braking: a modeling approach that accounts for active musculature. Traffic Inj Prev. 13(3):265–277.
- Osth J, Olafsdottir JM, Davidsson J, Brolin K. 2013. Driver kinematic and muscle responses in braking events with standard and reversible pre-tensioned restraints: validation data for human models. Stapp Car Crash J. 57:1–41.
- Reed MP, Ebert SM, Jones MLH, Park B-K. 2021. Occupant dynamics during crash avoidance maneuvers. U.S. Department of Transportation. National Highway Traffic Safety Administration. Report No. DOT HS 812 997.
- Reed MP, Ebert SM, Jones MLH, Park BKD, Hallman JJ, Sherony R. 2018. Passenger head kinematics in abrupt braking and lane change events. Traffic Inj Prev. 19(sup2):S70–S77.
- Reed MP, Ebert SM, Park BKD, Jml H. 2018. Passenger kinematics during crash avoidance maneuvers. Ann Arbor, MI: University of Michigan Transportation Research Institute.
- Rudd R, Scarboro M, Saunders J. 2011. Injury analysis of real-world small overlap and oblique frontal crashes. Paper presented at 22nd ESV Conference.
- Scanlon JM, Kusano KD, Gabler HC. 2015. Analysis of driver evasive maneuvering prior to intersection crashes using event data recorders. Traffic Inj Prev. 16 Suppl 2:S182–S189.
- Schneider LW. 1983. Development of anthropometrically based design specifications for an advanced adult anthropomorphic dummy family, Volume 1. Washington (DC): U.S. Department of Transportation. National Highway Traffic Safety Administration. Final Report.