
Abstract
Objective
In Bangladesh, drivers’ failure to yield to pedestrians at designated crossings poses a significant safety risk and discourages their use of such crossings. The use of behavior change theories could be more appropriate in such complex situations where the interdependent behaviors of drivers and pedestrians interact. While many studies have identified factors that affect drivers’ yielding behavior in the literature, fewer efforts have been made to apply behavior change theories in exploring and validating these factors, and to reach a consensus among competing road users. This study is among the first to utilize behavior change theories in Bangladesh to identify pedestrians’ safety factors that could promote drivers’ yielding behavior, upon which a consensus between drivers and pedestrians could be established.
Methods
A self-reported attitudinal survey was administered to 202 drivers on two highways in Bangladesh with a questionnaire using the capability, opportunity, motivation, and behavior (COM-B) model for the comprehensive coverage of behavior change theories. The focus group interviews were also conducted with 40 pedestrians and 19 drivers who have experience with four crossing sites on the selected highways. The collected data were analyzed using a regression model to identify significant factors influencing the drivers’ yielding behavior. These factors were then justified using a deductive thematic coding framework based on behavior change theories.
Results
The regression model explained the variance in drivers’ yielding by 45.1% with eight factors. The model found seven positive significant contributory factors in the drivers’ yielding that could promote pedestrian safety. Of them, the motivation factors were avoiding random crossing by pedestrians, vulnerable groups, assertiveness, and facial fear expressions; and the opportunity factors were traffic signs or advanced yield lines, crossing in groups at specific times, and enforcement.
Conclusions
The study’s findings have practical implications for policymakers, highway designers, and other stakeholders involved in promoting pedestrian safety by acknowledging their stake in making any decision that might impact them. Highway designers can use the thematic coding framework to recommend any contributory factors involved, where competing drivers’ unwillingness to yield is the primary threat to pedestrians’ safety.
Introduction
Around 93% of road fatalities occur in low and middle-income countries (LMICs). Furthermore, the increasing number of vehicles in developing countries has increased traffic injuries, highlighting the urgent need for effective road safety measures in these regions. Unlike high-income countries (HICs), student and worker numbers are rising in LMICs, and the conflicts between pedestrian and vehicular traffic on high-speed roads are also increasing (Tiwari Citation2020). Bangladesh’s road traffic fatality rate is 102.1 per 10,000 vehicles and 13.6 per 100,000 population (The World Bank Citation2020), where 65% of road injuries involve pedestrians (Ahmed et al. Citation2014). Students and workers in Bangladesh risk their lives when attempting to cross a major road because of nearby industrial, commercial, and educational activities. Road agencies of Bangladesh provide at-grade crossings (such as zebra crossings) and grade-separated facilities (such as pedestrian footbridges). A study shows that pedestrians often do not use footbridges in Bangladesh (iRAP Citation2013). The zebra crossing is the most viable option as the cost for providing grade-separated facilities is very high and not pragmatic to install frequently over the highway. However, drivers’ unyielding to pedestrians attempting to cross a road at at-grade crossings undermines pedestrians’ safety and discourages them from using designated crossings.
Designers often deliver interventions that are found ineffective in achieving goals when it involves competing requirements by road users (Wittink Citation2001; Michie et al. Citation2014). Moreover, institutional weakness in designing interventions is more profound in LMICs (Bhalla and Shotten Citation2019). Evidence shows there are significant disparity exists between the needs of drivers and pedestrians for mutual communication (Sucha et al. Citation2017). Drivers’ behavior could depend on many factors, such as road structure, which can affect pedestrian expectations (Björklund and Åberg Citation2005). Overlooking the effect of drivers’ unyielding behaviors on pedestrians’ expectations could pose an extra threat to vulnerable road users, such as students and workers. To manage users’ expectations, it is vital to agree on the intervention type(s) and the degree of anticipated behavior change that design can cause (Nag et al. Citation2020). Intervention designing should concentrate on people-oriented road systems, conducting psychological analysis of crossing behavior (especially for unsafe behavior) to meet the psychological needs of pedestrians (Ding et al. Citation2015). Therefore, pedestrians’ perception of the drivers’ yield factors should be evaluated on their psychological needs concerning the safe use of crossings. In the literature, limited studies used behavior change methodology or tools to identify the factors involved in drivers’ yielding with a consensus among drivers and pedestrians.
This research aimed to find what factors influenced drivers’ yielding behavior while preserving the pedestrians’ target behavior (safe use of crossings). It identified drivers’ yield factors using their self-reported attitudinal data. Then, a conceptual deductive thematic framework was based on behavior change theories to evaluate those factors in the contribution of pedestrians’ safe use of crossings and competitive behavior of drivers yielding.
Theoretical background and literature review
Behavioral models have been used in multiple domains in predicting behavior in terms of intentions. Most models focus on individual decision-making, such as the theory of planned behavior (TPB). However, many researchers do not recommend TPB for developing and planning interventions that encourage behavior change (Taylor et al. Citation2006; Webb et al. Citation2010) because of the inherent weaknesses with TPB, such as the emotional component being absent and the intention-behavior gap. The combined psychological model () could minimize the intention-behavior gap. It acknowledged that people’s behavior is affected by more than just intentions or desires; it also depends on emotions and barriers.
Figure 1. Combined model from Fylan (Citation2017).
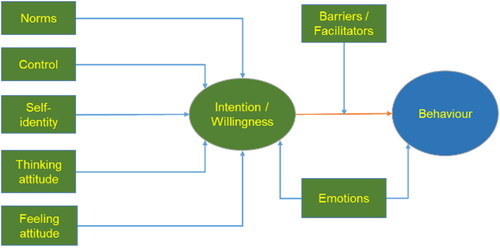
The implementation intention is a self-control technique in the form of an “if-then plan” and can improve goal achievement. It can be used to develop new habits and has been proven useful in various circumstances (Adriaanse et al. Citation2011). A few factors are common in many behavior-change models (Witte Citation1998), which are listed in Appendix A1, along with the strategies to change behavior.
While many behavior-change models have limited or weak theoretical foundation, the capability, opportunity, motivation, and behavior (COM-B) performs as an overarching model of different health behavior models. The three components of the COM-B, capability (physical and psychological), opportunity (physical and social), and motivation (automatic and reflective) are all indicators of an individual’s willingness to engage in a behavior (Michie et al. Citation2011; Varisco et al. Citation2020). Few COM-B questionnaires to date have tested acceptability, reliability or validity. Keyworth et al. (Citation2020) used a short version of a generic 6-item self-evaluation capability, opportunity, and motivation (COM) questionnaire in the health domain where predictive validity is tested for the first time. The theoretical domains framework (TDF) helps to formulate measuring instruments as it can readily be mapped to the COM-B and covers a range of behavioral determinants (Cane et al. Citation2012). TDF consists of 14 domains: knowledge; skills; social/professional role and identity; beliefs about capabilities; optimism; beliefs about consequences; reinforcement; intentions; goals; memory, attention and decision processes; environmental context and resources; social influences; emotions; and behavioral regulation.
In behavioral studies, Rasouli and Tsotsos (Citation2020) have undertaken a meta-analysis with a large subset of crucial studies (1953–2017) on pedestrians’ behavior. Their analysis revealed that pedestrian attributes and environmental factors are the two broad categories that govern typical pedestrians’ behavior, with 54% of studies focusing on pedestrian attributes and 46% on environmental factors. Anciaes et al. (Citation2020) also analyzed past studies and identified several environmental and pedestrian-associated factors influencing drivers’ behavior positively at marked unsignalized crossings (zebras). Those factors are-
Environmental factors: Positive environmental factors in drivers’ yielding are crossing width, staggered crossing, speed humps, traffic signal, kerb extensions, high-visibility signs and markings, advanced yield marking, in-street signs, junction, morning time (vs. afternoon), buses and cars, and another vehicle yield in an adjacent lane.
Pedestrian factors: Positive pedestrian-associated factors are the presence of vulnerable groups (such as children, disabled, or older people), same age group as a driver, ethnic minority, number of pedestrians, conspicuity, assertiveness, friendliness, crossing from far side pavement, and second stage of crossing at a staggered crossing.
Besides, interpersonal skills, outdoor information, and monitoring the compliance of traffic rules at crossing sites are found effective in other studies. Study shows that roadside or overhead billboard posters (small posters, banners) and face-to-face communication are effective for road safety (Delhomme et al. Citation2009). A study shows that facial expressions (Rasouli et al. Citation2017) are beneficial for understanding the type of communication between vehicle drivers and pedestrians. For example, the expression of fear, since fear is a vital component of Plutchik’s wheel of emotions (Plutchik Citation1980). Enforcement is another vital component of road safety, such as speed management (Fred Wegman Citation2006), which could be considered an environmental factor. Stricter penalties for drivers’ traffic rules violations contribute to vulnerable road users’ safety (Avenoso and Beckmann Citation2005).
Methodology
Research design
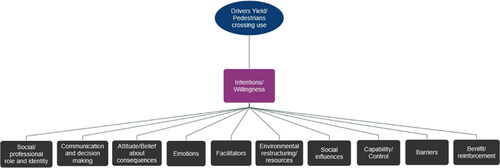
This study used a mixed-methods research design framework with a quantitative and qualitative approach (Creswell and Clark Citation2017). The quantitative data collection relied on the COM-B model. However, this study focused on the individual factors rather than the model construct in predicting drivers’ yielding behavior. The qualitative data served a supportive role in the survey questionnaire formulation and analyzing the findings through the lens of behavior change theories from the in-depth views of drivers and pedestrians on common subject matters. The timing of the two data collection approaches was sequential. The focus group interviews (qualitative part) were carried out in December 2021; and the survey was conducted from January 2022 to March 2022. At the end of data collection, both (drivers’ and pedestrians’) focus group interview transcripts were deductively analyzed using a conceptual thematic coding framework (). That framework was framed on the combined model and TDF to explain the findings of the outcome of the quantitative method. In the framework, the theme of the drivers’ yield, drivers’ intention or willingness, was conceptualized with the codes (n = 10) related to their various behavior and attitudinal attributes. Similarly, pedestrians’ crossing use was conceptualized with their intention or willingness as a theme and their attitude and behavior as codes.
Figure 2. Thematic coding framework.
Focus group interviews
Drivers sample and interview procedure
For participant recruitment in Bangladesh, the research team visited bus stands from where the drivers usually start their journey. The research routes (see Appendix A3) were Nabinagar to Chandra highway (N-540) and Dhaka-Sylhet highway (N-2). The justification for selecting these two highways for the study is their high accident rate and significant traffic flow. Dhaka-Sylhet Highway (N2) has been identified as one of the most dangerous roads in Bangladesh, where iRAP (Citation2013) found a high average death rate per kilometer (0.55). The road is also characterized by various roadside marketplaces (bazaars) along the rural highway segment, which are hotspots for accidents and casualties. On the other hand, the Nabinagar-DEPZ-Kaliakoir (Chandra) Highway has a high average pedestrian death rate per kilometer (0.56) according to the available ARI crash data from 2006 to 2015. This road is also characterized by the presence of numerous industries and educational institutions close to the semi-urban road, which generates many students and workers needing to cross the road. N2 has a length of 287 km with an Annual Average Daily Traffic (AADT) of 15536, while N540 has a length of 16 km with an AADT of 13650.
The participants were identified with the help of drivers’ association offices. The total number of participants for the three focus groups was 19. They had different categories of vehicle (bus, truck, car, three-wheelers) driving experiences who could share more experiences of designated crossing sites on the selected highways. Each focus group interview session took around 30–40 min and was audio and video recorded. The focus group interviews started with a general discussion on pedestrians’ crossing behavior around designated crossing facilities, leading to the following question:
Question- From your experiences, what situations decide your willingness or intentions in yielding to pedestrians, whether you will give way or not in or around a designated road crossing?
Pedestrians sample and interview procedure
The researcher visited the schools, colleges, marketplaces, and garments factories near the N2 and N-540 routes to meet with the institutional representatives. With those representatives’ help, participants who cross the research route(s) regularly and who could provide more experiences for the site of designated crossings such as zebra crossing were selected. The total number of participants for the four focus (one focus group from college, school, marketplace, and garments industry each) groups was 40, where the numbers of students and workers were 20 each. Each focus group interview started with a general discussion on pedestrians’ crossing behavior around designated crossing facilities. Later, the lead researcher provided summary notes of driver interview sessions to the pedestrians. The researcher interviewed the participants with the following questions (Q1 and Q2).
Q1. From your experiences, what situations decide your willingness or intentions to use the designated crossing safely?
Q2. What are the agreements/disagreements on drivers’ comments (based on summary notes) on pedestrians’ behavior and drivers’ yielding?
The lead researcher classified responses on Q2 as per respondents’ verbal or gestural responses to the level of agreement/disagreement. Major agreement or disagreement counted for those responses where most group participants used their voice or gesture to strengthen or nullify the statement. A general agreement or neutrality is considered where the participants remained silent or undecided in their opinions.
Data analysis
After completing all focus group interviews, the lead researcher classified the files separately for transcription and analysis of the drivers’ and pedestrians’ interview data. To avoid biases due to human interference, all audio recordings were electronically transcribed in the Bengali language using an online transcription service ‘Transkriptor’ with a 90% accuracy rate (https://transkriptor.com/support/). Moreover, a four-step procedure was employed to reduce errors in transcriptions. To refresh the memory of the subject matter, the researcher and his assistants initially watched the recorded video without going through transcription. Then, the research team checked the transcripts with video recording for necessary corrections where the online transcription failed. Later, all verified Bengali documents were translated into English using the google doc translation service. The lead researcher rechecks each focus group interview transcript to make the final corrected transcription.
In addition to the focus group transcripts, the lead researcher sorted individual interview text for coding and analysis using NVivo 12. The credibility of coding could be enhanced by using an audit procedure (Johnson et al. Citation2020). Therefore, an independent local expert in qualitative thematic coding checked the whole translation and coding procedure.
Survey
Questionnaire development
This study followed Kenworth’s validated COM questionnaire, as mentioned earlier. However, a recommended typical COM-B Questionnaire (Michie et al. Citation2014) and the Sample questions for making a COM-B diagnosis (West et al. Citation2020) were also used to form questions for TDF mapping with the COM-B constructs. The drivers focus group interview notes also helped to identify various aspects of pedestrians’ attributes that affect the driver’s yielding behavior. For each questionnaire statement, this study used the tested behavioral modification technique of the ‘if-then plan’ cause-effect relationship between constructs and indicators, as mentioned earlier.
This study formulated a COM-B questionnaire, as shown in Appendix A2, which included twenty-six questionnaire items within the broader theoretical coverage of COM-B. The questionnaire also included items for gathering drivers’ demographic information and their perception of pedestrians’ behavior. The respondents were asked to respond on a 5-point Likert agreement scale (i.e., 1 = strongly disagree to 5 = strongly agree) to measure the agreement level of their yielding to pedestrians on different COM statements, as shown in Appendix A4. The COM statements were related to physical opportunity (PO), social opportunity (SO), reflective motivation (RM), automatic motivation (AM), physical capability (PC), and psychological capability (PsC). Another 5-point Likert yielding frequency scale (i.e., 1 = never to 5 = always) was used to measure the target behavior ‘Yield’. A preliminary questionnaire was piloted into two groups of drivers, where the lead researcher interviewed the participants (n = 12) to understand the questionnaire structure and modify them accordingly.
Procedure and sample
The researcher and his team visited bus stands from where the drivers start and end their journey along the research routes of N-540 and N-2, including drivers’ association offices in bus stands. The research team also visited filling stations or marketplaces where drivers frequently halt their vehicles for fueling or other purposes.
The researcher collected the respondents’ self-reported pre-COVID (before March 2020) behavior and attitudinal data. For sample size estimation, this study used an online sample calculator (http://www.raosoft.com/samplesize.html), where the estimated sample size turned out as 203 only with a margin of error 5%, confidence level 90%, estimated population size 800 based on peak hour traffic flow, and response distribution 50%. The total driver sample size was 202, with the distribution by vehicle types: bus/minibus (96), truck/pick up (35), car (56), and three-wheeler/slow-moving type (15). Large portions of respondent groups had primary or high school education (81.2%) and driving experiences of up to 10 years (41.6%).
Data analysis
The collected data were entered directly into the SPSS 26 software tool. This study applied a formative approach as the indicators were the cause of the respective constructs. However, how the indicators were rooted in each respective construct is measured with the principal component analysis (PCA). A minimum of 150 cases (Sofroniou and Hutcheson Citation1999), or 5 cases per variable (Bryant and Yarnold 1995), has been recommended as a minimum sample size to get a reliable result through PCA. The Kaiser-Meyer-Olkin (KMO) value of 0.6 (Awang Citation2010) was used as a threshold to measure the sampling adequacy for the data set. Stepwise multiple regressions enabled removing unnecessary variables and preserving all significant variables. The survey data was analyzed stepwise with the multiple regression model using SPSS 26. Before regression analysis, the assumptions were checked for normality, homoscedasticity, and the absence of multicollinearity.
Results and discussions
Survey
Socioeconomic factors in drivers’ yielding and near-crash situations
Drivers had an accident history (or had witnessed an accident) 51%. They frequently (40.6%) yielded to pedestrians, followed by sometimes (38.1%), always (9.4%), infrequently (8.4%), and never (3.5%). The near-crash situations were primarily infrequent (62.4%) while interacting with pedestrians. The crosstabulation distribution of the drivers’ yielding to pedestrians and near-crash situations are analyzed with the key socioeconomic variables such as education level (college/university level and below) and vehicle types (bus vs. car). shows the drivers’ yielding and infrequent near-accidental events in different socioeconomic conditions. The data analysis from the crosstabulation indicates drivers with a college/university degree and those driving cars consistently showed higher yielding frequencies (45.94% and 57.14%, respectively) and a greater frequency of infrequent near-crash events (75.67% and 73.21%, respectively).
Table 1. Drivers’ yield and near-crash frequency in different socioeconomic conditions.
Descriptive statistics on drivers’ perception on pedestrian behaviors
Drivers have reported the pedestrians’ behaviors on a 5-point Likert scale (i.e., 1 = never, 2 = infrequent, 3 = sometimes, 4 = frequent, and 5 = always). The highest response to pedestrians’ lapses was frequent 81.2%). Similarly, the highest response on pedestrians’ uses of nearby crossings was sometimes (42.6%), other violation behavior was frequent (46.5%), and aggression toward the driver was infrequent (52.5%). When interacting with drivers, pedestrians primarily used hand gestures with the L-straight-erect type (63.4%), and drivers’ near-crash situation was infrequent (60.9%).
Principal component analysis (PCA) and regression model
The SPSS output of KMO value (0.681) was adequate to run principal component analysis (PCA). The PCA output showed that twenty-five questionnaire items, as shown in Table A2 (see Appendix, supplementary material), were distributed in nine components with eigenvalue conditions greater than one and orthogonal rotating components. However, seventeen items were loaded in six PCA components (PO, SO, RM, AM, PC, and PsC) with a cutoff coefficient (loading) of 0.5. The loadings of each item on the components are shown in Appendix A5. The remaining items (PO3, PO6-8, SO2, RM4, AM4, and PsC3) were loaded into the other three PCA components and are not incorporated in Table A5 (see Appendix, supplementary material), as they were not loaded in their respective components where most of the items were loaded.
Table 2. Stepwise regression model with predictors.
We performed stepwise multiple regression to look at the most pertinent predictors of the target behavior. The regression process established a model with the highest R square value of 0.451 (). The model included six predictor items (AM2, PO2, RM1, AM3, SO3, and SO1) from the six components of PCA. Item PO3 concerning the enforcement of traffic rules factor and item AM4 concerning pedestrians’fear expression factor significantly influenced drivers’yield. However, those items were not included in the six PCA components. Therefore, those IDs were replaced with EF (enforcement) and FE (fear expression), respectively, to assign them to identities different from their constructed identity.
The significance of each item is shown in . The model confirmed that the pedestrians’ avoiding random crossing (RM1; β = 0.244 & p < 0.001), pedestrians’ assertiveness (AM3; β = 0.216 & p < 0.01), and vulnerable groups such as children or women (AM2; β = 0.139 & p < 0.05) were significant factors in drivers’ motivation that precited yield. Similarly, traffic signs or advance road marking (PO2; β = 0.244 & p < 0.001), pedestrians group crossing (SO3; β = 0.288 & p < 0.01), and many crossing users (SO1; β=-0.213 & p < 0.05) were significant drivers’ opportunity factors in yielding. Other factors such as enforcement (EF; β = 0.190 & p < 0.01) and pedestrians’ fear expressions of traffic injury/death (FE; β = 0.152 & p < 0.01) also significantly predicted drivers’ yield.
Table 3. Summary coefficients with significance.
In the analysis of variance, the F-ratio measures how well the total regression model fits the data. According to the ANOVA (), F (8, 193) = 19.786 and p < 0.001 suggests the independent factors statistically substantially predicted the dependent variable (i.e., the total regression model fits the data).
Table 4. Summary of ANOVA.
The multiple regression analysis found eight factors that explained 45.1% of the variance in drivers’ yielding. The adjusted R-square value of this model is 0.428. In model explanatory power, R2 should be greater than 0.10 to be deemed adequate (Falk and Miller Citation1992). In contrast, others suggest 0.26 as substantial (Cohen et al. Citation2014). This model included seven significant positive factors and only one negative factor in predicting drivers’ yield. Earlier studies using the COM-B model in different domains suggested that motivation was more influential than other components in predicting the target behavior. The prediction model has eight items. Four of them (such as avoiding random crossing, vulnerable groups, pedestrians’ assertiveness, and pedestrians’ facial fear expressions) were rooted in the motivation factors. Other four items (such as traffic signs or advanced road marking, crossing in groups at specific times, many crossing users using all the time, and enforcement) were rooted in opportunity factors, which could also be valid in other developing countries as physical infrastructural facilities. Social norms are different and not in mature stage compared to the developed countries.
Driver focus group interviews
According to the thematic coding structure of the conceptual framework for the drivers yielding behavior, the NVivo analysis revealed that the most discussed topic among participants (n = 19) was barrier (30%), followed by attitude/belief about consequences (25%), emotions (11%), and other factors, such as communication and decision-making, environmental restructuring, and social influences. Thematic data analysis of the drivers’ focus group with notable quotes from the participants are shown in Appendix A6.
In drivers’ focus group interviews, the drivers identified risky running, long wait for pedestrians to cross a road, and violation behavior as key barriers to their yielding intentions or willingness. Survey data shows that drivers mostly yield when pedestrians avoid random crossing, in other words, present in the designated crossing area. Focus group participants reported that drivers become angry if they see pedestrians not using footbridges and cross the road randomly underneath it. Studies have shown that drivers’ most common form of emotion is anger, which can lead to an increase in driving speed (Kadoya et al. Citation2021).
Drivers emphasized the consequences of the pedestrians’ actions in building their intention or willingness to yield to pedestrians. They think about the safety concerning pedestrians’ actions or expressions, such as fear of pedestrians’ aggression, pedestrians’ injury risk, and the safety of vehicle passengers and pedestrians. Survey data finds that the pedestrians’ gestural or facial fear expressions of traffic injury/death significantly predicted drivers’ yield. Fear-based communication is often used in road safety domains (Lewis et al. Citation2007) as fear is one of the strongest emotions anyone can feel, as stated earlier. Drivers’ positive attitude builds when the pedestrians’ actions meet their expectations. Some drivers acknowledged the pedestrians’ priority in using the zebra crossing. However, their perception toward pedestrians’ crossing use and knowledge is negative.
The drivers’ emotions are activated when they see old or disabled people on the road waiting to cross, and they also prioritize children and women while they try to cross a road. Survey data shows that vulnerable groups such as children or women significantly impacted the drivers’ yielding, as supported in past studies, as stated earlier. Drivers’ family members sometimes are in the same socioeconomic category, such as school-going boys, girls, or women workers. In such cases, the drivers find a social/professional role in prioritizing their crossing needs.
The communication and decision-making process plays a vital role in pedestrian-driver interactions. Most drivers reported that pedestrians mostly use their gestures (right hand) while they try to cross a road. Pedestrians’ assertiveness through gestures and eye contact, an implicit type (Fuest et al. Citation2017) of communication, could change behavior (Kellermann and Cole Citation1994).
Most participants emphasized environmental restructuring or physical road facilities, such as road signage, markings, and road furniture, to facilitate the users. Survey findings also recognize that the road signage and markings found a contributory predictor in the drivers’ yielding. As stated earlier, previous studies on road signage and markings had similar results on drivers’ yielding. Focus group participants also emphasized that social influences such as group size or pedestrian group crossing at a particular time of the day positively affect the drivers’ yielding behavior. Survey data finds that the pedestrian group crossing at specific times predicted drivers’ yielding behavior. When pedestrians know each other (Tezcan et al. Citation2019) or the same type of pedestrian (school student, garments worker) moves at a particular time for study or work purposes, forming a platoon. This platooning can attract drivers’ attention, influencing them to reduce speed (Avinash et al. Citation2019; Sheykhfard and Haghighi Citation2019).
Pedestrian focus group interviews
Safe uses of crossing
Regarding the intention or willingness to the safe use of crossings, the NVivo analysis revealed that the most discussed topic among focus group participants (n = 40) was barriers (43%), followed by attitude/belief about consequences (17%), facilitators (12%), environmental restructuring (9%), social influences (8%), communication and decision making (5%), and others. Thematic data analysis of the pedestrians’ focus group with notable quotes from the participants are shown in Appendix A7.
Pedestrians’ safe use of crossings could be characterized by three essential compliance of crossing behavior: avoiding violations, aggressive behavior, and lapses. Concerning the drivers’ yielding behavior of avoiding pedestrians’ random crossing, the pedestrian focus group participants agreed with the drivers’ comments that pedestrians often violate crossing rules, making it difficult for drivers to yield to them, as mentioned earlier. The survey also finds that pedestrians (42.6%) sometimes used their nearby crossing. Such violation type of unsafe behavior is predominant in Bangladesh. Study shows that such violation behavior is much more expensive for jaywalker (McIlroy et al. Citation2019). Concerning enforcement of drivers’ speed and other traffic rules compliances, pedestrians, especially vulnerable road users, could benefit from the strict application, as stated earlier. The pedestrians focus group participants expressed concern about drivers speeding and violating priority rules of the zebra crossing. They emphasized the importance of speed reduction management techniques before a zebra crossing and the functioning of appropriate actions of the police. According to Retting (Citation2017), more law enforcement can boost yielding rates and promote pedestrian safety.
Belief about consequences for pedestrians’ actions played an essential role in pedestrians’ intention or willingness to use crossings safely. Concerning pedestrians’ fear of traffic injury/death on drivers yielding, pedestrians focus group participants reported that recalling previous injuries and fear of death contribute to safe crossings, using their gestures or facial expressions. Such informal communication between drivers and pedestrians is beneficial, as mentioned earlier. Fear-arousing messages can be persuasive in changing behavior, depending on cultural differences. In countries such as Australia, New Zealand, the United States, and Great Britain, it is a common practice to display explicit pictures of crashes, causalities, injuries and blood, and the grief of traffic victims (Goldenbeld Citation2007).
The presence of traffic police is recognized as a facilitator for the safe crossing of pedestrians. Pedestrians also feel secure in the situation where there is no or less traffic on the road and have time in hand to cross a road.
The environmental restructuring is considered essential for the pedestrians’ safe use of crossings. Concerning traffic signs or advanced road marking, a study shows that when there is no zebra crossing or traffic signal, the crossing probability is less than 50% (Rasouli et al. Citation2017). Pedestrians focus group participants also emphasized the environmental restructuring to facilitate safe crossing. They emphasized installing high visibility zebra crossings, light signal systems, and other facilities for drivers’ visibility and knowing the compliance of the crossing sites. A previous study also shows that high visibility marking increases pedestrians’ safety (Sarwar et al. Citation2017).
Survey findings show that social influences such as pedestrian group crossing at specific times contribute to the drivers’ yield. Focus group participants also stated that they use more crossing in a group. Literature supports that people in a group are less likely to follow someone breaching the law, such as crossing at a red light (Lefkowitz et al. Citation1955). Another study shows groups have a more stable overall behavior due to difficulty in changing the direction of movement and a tendency to maintain cohesion and communication among themselves (Bandini et al. Citation2014).
Pedestrians try to communicate with drivers using their eyes and hands as a means of communication and decision-making process. Pedestrian focus group participants stated that while they cross a road, they try to communicate with drivers by raising their hands. They feel safe using crossings when drivers respond to their gestural appeal and yield. They reported that drivers usually do not want to give a yield unless pedestrians seek their attention before crossing a road. That informal approach of drawing the drivers’ attention is quite common in developing countries due to the lack of a light signal system in a designated zebra crossing. An experiment in China (Zhuang and Wu Citation2014) shows that the left elbow bent with hands level and palm facing left (L-bent-level) was the most effective type of gesture in drivers yielding than the other types of gestural positions. This study also finds that pedestrians mostly used the L-straight-erect type (63.4%) for drivers’ yielding, as mentioned earlier.
Feedback on drivers’ comments
The researcher exposed summary notes during the pedestrians focus group interview sessions with a total of 42 statements and quotes from drivers. Analysis shows that the major agreements (n = 14 on pedestrians’ behavior and n = 6 on drivers’ yield) and disagreements (n = 5 on pedestrians’ behavior and n = 5 on drivers’ yield) that cover around 71% of the total statements or quotes. However, participants remained undecided on the remaining 29% of statements or quotes.
All student and worker participants strongly agreed with the drivers’ comments on the typical pedestrians’ behavior around crossings. They agreed that pedestrians often display lapses, such as phone conversation during crossings, not paying attention to the vehicles even with a horn, do not see a vehicle coming. Similarly, pedestrians commit violations, such as not using the designated crossing, rushing to cross at peak hours, and crossing randomly. In a group, someone raises a hand to draw drivers’ attention to stop or slow their vehicles, and others follow the crowd. Students agreed strongly that they often tell stories and sometimes look back while crossing roads together. Workers agreed with some of the drivers’ comments. Workers agreed that most pedestrians do not know how to cross a road under the footbridge and often cross a road diagonally. They also agreed with the drivers’ comments that the marketplace workers are uneducated and often forcefully stop vehicles (aggressive behavior).
Responding to drivers’ comments on their yield to pedestrians, student focus group participants agreed that drivers generally yield if someone reaches the middle of the road and drivers are at a reasonable safe distance. Workers agreed that drivers yield when they see pedestrians raise a hand from a reasonable distance, vulnerable groups waiting on the road to cross, or pedestrians crossing in an area with no nearby designated crossings. Workers also agreed that drivers do not yield when pedestrians cross in the unmarked area under the footbridge or have a designated crossing nearby but not using it, afternoon time, and when pedestrians suddenly run to cross a road. However, students and workers did not firmly agree on those factors in drivers’ yielding.
Pedestrian vulnerability and the need for context-specific solutions
The study acknowledges the concerns about the hierarchical relationship between pedestrians and drivers, particularly in LMICs, where the competitive dynamics among road users can be exacerbated due to factors such as limited infrastructure, inadequate traffic enforcement, and socioeconomic disparities. The study expanded the discussion to encompass the unique challenges faced by pedestrians in these settings beyond the immediate design modifications to examine the broader legal, cultural, and policy aspects that contribute to the existing hierarchy between pedestrians and drivers, with a specific focus on their implications for LMICs:
Legal frameworks and cultural norms
The legal frameworks can disproportionately impact pedestrians in LMICs, leading to inconsistencies in road user protection and prioritization. It emphasizes the need to address inconsistencies in road user protection and prioritization, considering the influence of cultural norms on individual perceptions and decision-making on the road. This recognition underscores the importance of comprehensive approaches encompassing legal considerations and cultural contexts to enhance road safety and protect vulnerable users such as pedestrians.
Policy considerations and culturally sensitive solutions
This study advocates for policies targeting the socioeconomic factors impacting pedestrian safety in LMICs. It underscores the significance of adopting context-specific and culturally sensitive approaches, recognizing that effective interventions must be tailored to the unique realities of these regions.
Community-based approaches and school curricula
Community-driven programs and school curricula that integrate road safety education in a culturally appropriate manner can effectively address the challenges faced by pedestrians in LMICs by fostering awareness, promoting responsible road behavior, and empowering pedestrians to assert their rights as road users.
Stakeholder analysis
Any intervention may affect various stakeholders. Lusthaus (Citation1999) identifies category, interests, and role as the three essential elements in stakeholder mapping. This study identified vital stakeholders with those elements, including the Roads and Highways Department (governmental organization for design, safety of road users, implementation), Bangladesh Road Transport Authority (governmental regulatory body, rules and guidelines, coordination), the Highway Police (government enforcing agency, traffic rules enforcement, enforcement), the Road Transport and Highway Division (decision support, monitoring implementing bodies, policy formulation), drivers’ and pedestrians’ association leaders (independent, advocate for community interests, bargaining with the government), and institutions like schools or garment industries (community, welfare of students or employees, role model).
Conclusion and recommendations
At-grade crossings are viable options in developing countries compared to the grade-separated facilities on highways. The regression model found seven significant positive factors influencing drivers’ yield at at-grade crossings. They are pedestrians’ presence in the designated crossing area by avoiding random crossing, pedestrians’ assertiveness, presence of individuals of vulnerable groups such as children or women, traffic signs or advance road markings such as yield lines or zigzag markings for the drivers, pedestrians’ group crossing during peak hours, enforcement against traffic rule violations, and pedestrians’ fear of traffic injury or death. Although some other opportunity factors (such as short crossing paths and designated waiting areas, pedestrian fences, and visibility) do not significantly influence drivers’ yielding directly, they could indirectly affect yielding through motivational factors.
The deductive thematic framework analysis also suggests that the model factors similarly affect drivers’ yielding and pedestrians’ safe crossings use. The focus group participants’ comments and views on those factors align with this study’s survey findings. Therefore, a consensus among drivers and pedestrians was established regarding the model factors. Designers should consider the consensus among the drivers and pedestrians in designing interventions, which could mutually benefit pedestrians and drivers in meeting their expectations and achieving safe use of crossings. Transportation agencies in developing countries should focus more on improving drivers’ motivational and opportunity factors to meet the expectation of road users (drivers and pedestrians). Additionally, it could recommend that transportation planners and designers work with community members to develop interventions that are tailored to the specific needs and behaviors of local drivers and pedestrians.
One research limitation is that the number of driver participants in the focus group is relatively small compared to the pedestrians’ focus group participants. However, it could not affect the reliability of findings as it is a complementary part of the drivers’ survey. Other factors could impact the research finding, such as COVID situation-related stress, forgetfulness of the pre-COVID behavior and attitude in responding, and inadequate physical opportunities on the research highway routes upon which the respondents gave their opinions in the questionnaire survey. The principal component analysis found that some COM items failed to represent their construct identity. However, this study emphasized factors instead of constructs. Therefore, enforcement and pedestrians’ fear of road traffic casualties are still considered an opportunity and motivational factor, respectively.
This study serves as a catalyst for positive change in LMICs by identifying the root causes of pedestrian vulnerability and contribute to the ongoing discourse on creating safer and more equitable road environments for pedestrians in these regions. Continuous engaging in a critical dialogue on the ethical considerations surrounding pedestrian safety should be emphasized by not only identifying the issues but also highlighting the responsibility of various stakeholders, including policymakers, to address the systemic challenges that contribute to pedestrian vulnerability. The economic constraints that LMICs face and advocate for solutions that are feasible and sustainable within these contexts should be considered in intervention design to maximize the efficacy of intervention with the limited resource settings.
Ethical approval
The University of Leeds Research Ethics Committee has given ethical approval for this study (Ref: AREA 20-103). All ethical protocols, including the Participant Information Sheet and Consent Form, were provided to the participants during this research.
Supplemental Material
Download MS Word (639.3 KB)Acknowledgements
The authors would like to thank the executive engineer of the Narshingdi and Manikganj road division of the Roads and Highways Department (RHD), Bangladesh, for assisting in data collection and arranging venues for focus group participants’ interviews. The authors acknowledged the contribution of Mr. Kazi Burhan Uddin, Deputy Manager (Monitoring and Evaluation) of the Centre for Injury Prevention and Research, Bangladesh (CIPRB), for his expertise in the qualitative data coding process assessment of this study.
Disclosure statement
The authors report there are no competing interests to declare.
Data availability statement
Data will be made available on request.
Additional information
Funding
References
- Adriaanse MA, Gollwitzer PM, De Ridder DT, De Wit JB, Kroese FM. 2011. Breaking habits with implementation intentions: a test of underlying processes. Pers Soc Psychol Bull. 37(4):502–513. doi:10.1177/0146167211399102.
- Ahmed I, Ahmed B, Hainin MR. 2014. Road traffic accident characteristics in Dhaka, Bangladesh. Jurnal Teknologi. 71(3):75–82. doi:10.11113/jt.v71.3763.
- Anciaes P, Di Guardo G, Jones P. 2020. Factors explaining driver yielding behaviour towards pedestrians at courtesy crossings. Transpor Res Part F Traffic Psychol Behav. 73:453–469. doi:10.1016/j.trf.2020.07.006.
- Avenoso A, Beckmann J. 2005. The safety of vulnerable road users in the southern, eastern and central European countries. Brussels: European Transport Safety Council.
- Avinash C, Jiten S, Arkatkar S, Gaurang J, Manoranjan P. 2019. Evaluation of pedestrian safety margin at mid-block crosswalks in India. Saf Sci. 119:188–198. doi:10.1016/j.ssci.2018.12.009.
- Awang ZH. 2010. Research methodology for business & social science. Selangor, Malaysia: University Publication Centre (UPENA), UiTM.
- Bandini S, Crociani L, Gorrini A, Vizzari G. 2014. Empirical investigation on pedestrian dynamics in presence of groups: a real world case study. In: Proceedings of the 2014 International Conference on Autonomous Agents and Multi-Agent Systems.
- Bhalla K, Shotten M. 2019. Building road safety institutions in low-and middle-income countries: the case of Argentina. Health Syst Reform. 5(2):121–133. doi:10.1080/23288604.2019.1565061.
- Björklund GM, Åberg L. 2005. Driver behaviour in intersections: formal and informal traffic rules. Transport Res Part F Traffic Psychol Behav. 8(3):239–253. doi:10.1016/j.trf.2005.04.006.
- Bryant FB, Yarnold PR. 1995. Principal-components analysis and exploratory and confirmatory factor analysis. In Grimm LG, Yarnold PR, editors. Reading and understanding multivariate statistics. American Psychological Association. p. 99–136.
- Cane J, O’Connor D, Michie S. 2012. Validation of the theoretical domains framework for use in behaviour change and implementation research. Implementation Sci. 7(1):1–17. doi:10.1186/1748-5908-7-37.
- Cohen P, West SG, Aiken LS. 2014. Applied multiple regression/correlation analysis for the behavioral sciences. Psychology press.
- Creswell JW, Clark VLP. 2017. Designing and conducting mixed methods research. Sage publications.
- Delhomme P, De Dobbeleer W, Forward S, Simões A. 2009. Manual for designing, implementing, and evaluating road safety communication campaigns: part I. Campaigns and Awareness Raising Strategies in Traffic Safety.
- Ding T, Wang S, Xi J, Zheng L, Wang Q. 2015. Psychology-based research on unsafe behavior by pedestrians when crossing the street. Adv Mech Eng. 7(1):203867. doi:10.1155/2014/203867.
- Falk RF, Miller NB. 1992. A primer for soft modeling. University of Akron Press.
- Fred Wegman CG. 2006. Speed management: enforcement and new technologies. The Netherlands: SWOV Institute for Road Safety Research.
- Fuest T, Sorokin L, Bellem H, Bengler K. 2017. Taxonomy of traffic situations for the interaction between automated vehicles and human road users. In: International Conference on Applied Human Factors and Ergonomics. p. 708–719.
- Fylan F. 2017. Using Behaviour Change Techniques: guidance for the road safety community. RAC Foundation Perth, Australia.
- Goldenbeld C. 2007. SWOV Fact Sheet, Fear Based Information Campaigns.
- iRAP. 2013. International Road assessment Programme Technical Report, ADB Road safety programme.
- Johnson JL, Adkins D, Chauvin S. 2020. A review of the quality indicators of rigor in qualitative research. Am J Pharm Educ. 84(1):7120. doi:10.5688/ajpe7120.
- Kadoya Y, Watanapongvanich S, Khan MSR. 2021. How is emotion associated with driving speed? A study on taxi drivers in Japan. Transport Res Part F Traffic Psychol Behav. 79:205–216. doi:10.1016/j.trf.2021.04.020.
- Kellermann K, Cole T. 1994. Classifying compliance gaining messages: taxonomic disorder and strategic confusion. Commun Theory. 4(1):3–60. doi:10.1111/j.1468-2885.1994.tb00081.x.
- Keyworth C, Epton T, Goldthorpe J, Calam R, Armitage CJ. 2020. Acceptability, reliability, and validity of a brief measure of capabilities, opportunities, and motivations (“COM-B”). Br J Health Psychol. 25(3):474–501. doi:10.1111/bjhp.12417.
- Lefkowitz M, Blake RR, Mouton JS. 1955. Status factors in pedestrian violation of traffic signals. J Abnorm Psychol. 51(3):704–706. doi:10.1037/h0042000.
- Lewis I, Watson B, Tay R, White KM. 2007. The role of fear appeals in improving driver safety: a review of the effectiveness of fear-arousing (threat) appeals in road safety advertising. Inter J Behav Consult Ther. 3(2):203–222. doi:10.1037/h0100799.
- Lusthaus C. 1999. Enhancing organisational performance: a toolbox for self-assessment. IDRC.
- McIlroy RC, Plant KL, Jikyong U, Nam VH, Bunyasi B, Kokwaro GO, Wu J, Hoque MS, Preston JM, Stanton NA. 2019. Vulnerable road users in low-, middle-, and high-income countries: validation of a pedestrian questionnaire. Accid Anal Prev. 131:80–94. doi:10.1016/j.aap.2019.05.027.
- Michie S, Atkins L, West R. 2014. The behaviour change wheel. Silverback Publishing. (A guide to designing interventions 1st ed Great Britain).
- Michie S, Van Stralen MM, West R. 2011. The behaviour change wheel: a new method for characterizing and designing behaviour change interventions. Implementation Sci. 6(1):1–12. doi:10.1186/1748-5908-6-42.
- Nag D, Bhaduri E, Kumar GP, Goswami AK. 2020. Assessment of relationships between user satisfaction, physical environment, and user behaviour in pedestrian infrastructure. Transp Res Procedia. 48:2343–2363. doi:10.1016/j.trpro.2020.08.284.
- Plutchik R. 1980. Plutchik’s wheel of emotions. https://www researchgate net/publication/234005320_Discovering_Basic_Emotion_Sets_via_Semantic_Clustering_on_a_TwitterCorpus/figures
- Rasouli A, Kotseruba I, Tsotsos JK. 2017. Agreeing to cross: how drivers and pedestrians communicate. In: 2017 IEEE Intelligent Vehicles Symposium (IV); IEEE.
- Rasouli A, Tsotsos JK. 2020. Autonomous Vehicles That Interact With Pedestrians: a Survey of Theory and Practice. IEEE Trans Intell Transport Syst. 21(3):900–918. doi:10.1109/TITS.2019.2901817.
- Retting R. 2017. Pedestrian traffic fatalities by state.
- Sarwar MT, Fountas G, Bentley C, Anastasopoulos PC, Blatt A, Pierowicz J, Majka K, Limoges R. 2017. Preliminary investigation of the effectiveness of high-visibility crosswalks on pedestrian safety using crash surrogates. Transport Res Record. 2659(1):182–191. doi:10.3141/2659-20.
- Sheykhfard A, Haghighi F. 2019. Performance analysis of urban drivers encountering pedestrian. Transport Res Part F Traffic Psychol Behav. 62:160–174. doi:10.1016/j.trf.2018.12.019.
- Sofroniou N, Hutcheson GD. 1999. The multivariate social scientist. SAGE. p. 1–288.
- Sucha M, Dostal D, Risser RJAA. 2017. Pedestrian-driver communication and decision strategies at marked crossings. Accid Anal Prev. 102:41–50.
- Taylor D, Bury M, Campling N, Carter S, Garfied S, Newbould J, Rennie T. 2006. A Review of the use of the Health Belief Model (HBM), the Theory of Reasoned Action (TRA), the Theory of Planned Behaviour (TPB) and the Trans-Theoretical Model (TTM) to study and predict health related behaviour change.
- Tezcan HO, Elmorssy M, Aksoy G. 2019. Pedestrian crossing behavior at midblock crosswalks. J Safety Res. 71:49–57. doi:10.1016/j.jsr.2019.09.014.
- The World Bank. 2020. Delivering Road Safety in Bangladesh: leadership Priorities and Initiatives to 2030.
- Tiwari G. 2020. Progress in pedestrian safety research. Int J Inj Contr Saf Promot. 27(1):35–43. doi:10.1080/17457300.2020.1720255.
- Varisco TJ, Downs CG, Rathburn KR, Fleming ML, Thornton JD. 2020. Applying the capability, opportunity, motivation, and behavior model to identify opportunities to increase pharmacist comfort dispensing naloxone in Texas: a structural equation modeling approach. Int J Drug Policy. 83:102827. doi:10.1016/j.drugpo.2020.102827.
- Webb TL, Sniehotta FF, Michie S. 2010. Using theories of behaviour change to inform interventions for addictive behaviours. Addiction. 105(11):1879–1892. doi:10.1111/j.1360-0443.2010.03028.x.
- West R, Michie S, Chadwick P, Atkins, L, Fabiana. 2020. Achieving behaviour change, A guide for national government. UK.
- Witte K. 1998. Theory-based interventions and evaluations of outreach efforts. Research review National Network of Libraries of Medicine Pacific Northwest Region, Outreach Evaluation Resource Centre, Seattle.
- Wittink R. 2001. Promotion of mobility and safety of vulnerable road users.
- Zhuang X, Wu C. 2014. Pedestrian gestures increase driver yielding at uncontrolled mid-block road crossings. Accid Anal Prev. 70:235–244. doi:10.1016/j.aap.2013.12.015.
