
Abstract
Objective
Using benzodiazepines and certain antidepressants is associated with an increased risk of motor vehicle crashes due to impaired driving skills. Hence, several countries prohibit people who use these drugs from driving. Traffic regulations for driving under the influence of these drugs are, however, largely based on single-dose studies with healthy participants. The effects of drugs on chronic users may be different because of potential development of tolerance or by adapting behavior. In this study, we test the effects of anti-depressants, hypnotics, or anxiolytics use on driving performance in patients who use these drugs for different durations and compare the effects to healthy controls’ performance.
Methods
Sixty-six healthy controls and 82 medication users were recruited to perform four drives in a driving simulator. Patients were divided into groups that used anti-depressants, hypnotics, or anxiolytics, for shorter or longer than 3 years (i.e. LT3− or LT3+, respectively). The minimum term of use was 6 months. Driving behavior was measured in terms of longitudinal and lateral control (speed variability and Standard Deviation of Lateral Position: SDLP), brake reaction time, and time headway. Impaired driving performance was defined as performing similar to driving with a Blood Alcohol Concentration of 0.5‰ or higher, determined by means of non-inferiority analyses.
Results
Reaction time analyses revealed inconclusive findings in all groups. No significant performance differences between matched healthy controls, LT3− (n = 2), and LT3+ (n = 8) anxiolytics users were found. LT3+ antidepressants users (n = 12) did not perform inferior to their matched controls in terms of SDLP. LT3− hypnotics users (n = 6) showed more speed variability than their matched healthy controls, while this effect was not found for the LT3+ group (n = 14): the latter did not perform inferior to the healthy controls. Regarding Time Headway, no conclusions about the LT3− hypnotics group could be drawn, while the LT3+ group did not perform inferior compared to the control group.
Conclusions
The small number of anxiolytics users prohibits drawing conclusions about clinical relevance. Although many outcomes were inconclusive, there is evidence that some elements of complex driving performance may not be impaired (anymore) after using antidepressants or hypnotics longer than 3 years.
Introduction
Drugs classified by the International Council on Alcohol, Drugs and Traffic Safety (ICADTS) such as, so-called, type III medication are on the rise. These psychoactive drugs that can potentially impair driving performance include benzodiazepines, certain antidepressants, antipsychotics, and some anti-epileptic drugs (ICADTS List Version 26 June 2007). In the Netherlands, over one and a half million people use these types of drugs (GIP/Zorginstituut Nederland Citation2022). More specifically, over one million people use antidepressants and around half a million people use anxiolytics or hypnotics (i.e. approximately 7.7% and 3.2% of the Dutch adult population in 2022, respectively). These numbers are even higher for antidepressants users in the United States: according to the National Center of Health Statistics (NCHS), the percentage of American women who used antidepressants (in the 30 days before the survey) increased from 13.8% in 2009–2010 to 18.6% in 2017–2018 (Brody and Gu Citation2020). Furthermore, the U.S. National Survey on Drug Use and Health (NSDUH) revealed that the percentage of adults over 18 who used prescription tranquilizers over the last year (including anxiolytics) ranged from 15.8% in 2015 to 13.8% in 2019 (SAMHSA Citation2017, Citation2022). The percentage of adults using prescription sedatives (including hypnotics) was 7.4% and 6.0% in 2015 and 2019, respectively.
Epidemiological studies have consistently demonstrated a positive association between the use of anxiolytics and hypnotics and the risk of being involved in a traffic crash (Dassanayake et al. Citation2011; Dubois et al. Citation2008; Gjerde et al. Citation2015; Orriols et al. Citation2011; Ravera et al. Citation2011). An important note, however, is that the magnitudes of these associations are generally modest. For instance, a meta-analysis by Dassanayake et al. (Citation2011), involving 21 epidemiological studies, reported an odds ratio (OR) of 1.59 for the increased crash risk associated with the use of anxiolytics and hypnotics. Similarly, Ravera et al. (Citation2011) found an OR of 1.54 among drivers who use anxiolytics, while the ORs regarding hypnotics and sedatives were mostly not significant after correction for combination therapy (OR = 1.39). The only exception concerned intermediate half-life benzodiazepines, although this was based on very few observations and contained large confidence intervals. For antidepressants users, Ravera et al. (Citation2011) concluded that the odds of a traffic crash were mainly increased for SSRI (selective serotonin reuptake inhibitor) users (OR = 2.03). In addition, Hill et al. (Citation2017) found in their meta-analysis, containing 10 epidemiological studies about the effects of antidepressants on motor vehicle crashes, an overall increased crash risk OR of 1.40 depending on the specific type of medication.
In comparison, a review and meta-analysis conducted by Taylor et al. (Citation2010) on the influence of alcohol on motor vehicle crashes revealed that ORs increased by approximately 1.24 per 10 grams increase in alcohol consumption. Assuming that one standard drink size contains ±12 grams of alcohol (see, e.g. Taylor et al. Citation2010) and approximately 2–3 drinks are sufficient to reach the legal limit of 0.5‰, this means that the OR for a motor vehicle accident when driving under or at the, for most countries, legal limit of 0.5‰ alcohol would be in-between 2.98 and 4.46. Moreover, a more recent meta-analysis by Høye and Hesjevoll (Citation2023) indicated that the OR = 6.44 for being involved or injured in a traffic crash while driving with a blood alcohol concentration (BAC) of 0.5‰ or higher. Indeed, while there is a positive association between the use of anxiolytics and hypnotics and driving crash risk, the magnitudes of these associations are generally lower than those observed for alcohol-related crashes. This is interesting because the ICADTS categorized the impairing effects of psychoactive substance on driving performance in three levels that are comparable to that of certain BACs. Category I is presumed to be safe or unlikely to produce an effect and is comparable to a BAC below 0.5‰. Category II contains medications that are likely to produce minor or moderate adverse effects, comparable to a BAC between 0.5% and 0.8‰. Medications that are classified as category III are likely to produce severe effects on performance and are presumed to have potentially dangerous effects comparable to driving with a BAC of more than 0.8‰ (ICADTS List Version 26 June 2007). Based on the mentioned epidemiological studies, one would categorize anxiolytics and hypnotics under Category I and not III. On the other hand, experimental studies have shown that driving under the influence of ICADTS III drugs is also associated with impaired driving (related) skills, including swerving, longer (brake) reaction times, and decrements in complex driving maneuvers such as parking, turning, and obstacle avoidance (Dassanayake et al. Citation2011; Hetland and Carr Citation2014; Roth et al. Citation2014). In the experimental studies, impairments were found to be comparable to driving under the influence of the legal alcohol limit or more, depending on the dosing and type of drugs.
A critical limitation of (many) experimental studies is that they have been conducted with healthy participants (Dassanayake et al. Citation2011). Patients have a legitimate reason to use medication, such as anxiolytics for the treatment of generalized anxiety disorders, for example. Healthy participants do not suffer from such disorders, which could mean that the effects of medication on their driving behavior and crash risk may differ from those of true medication users. Moreover, these studies primarily focus on acute single-dose effects, while patients use these medications for extended periods of time. Although treatments with benzodiazepines are typically limited to 2 to 4 weeks (Ashton Citation1994), clinical observations revealed that up to one-third of new users find ways to extend this duration and become long-term users (Bushnell et al. Citation2017; Gerlach et al. Citation2018). Some studies suggest that longer (chronic) use of medication may lead to a reduction in driving impairments over time (Brunnauer et al. Citation2021; Van der Sluiszen et al. Citation2017; Wingen et al. Citation2006). Therefore, it is crucial to investigate potential habituation or tolerance effects on driving behavior to determine fitness to drive of long-term mediation users (Leung Citation2011).
In their extensive literature review, Van der Sluiszen et al. (Citation2017) examined the effects of benzodiazepines on driving-related cognitive skills of long-term users. Their findings indicate that although tolerance effects can be observed in long-term users of these medications, tolerance does not completely eliminate the negative impact of use of medication on driving performance. This suggests that even with improved driving performance over time, long-term benzodiazepine users still demonstrate some degree of impaired performance compared to healthy drivers. The presence of statistically significant impaired performance on tests, however, does not automatically imply that these individuals are unfit to drive. To assess the fitness to drive of patients using psychoactive substances, the golden standard is to compare effects of these drugs on driving performance to driving under the influence of alcohol (Brookhuis Citation1998). This has not been done for long-term users of these types of medicines before.
As mentioned, ICADTS category III medication is classified as such because of its likelihood to produce severe and potentially dangerous effects on driving performance: comparable to driving under the influence of 0.8‰ BAC or more. Based on solely the results of epidemiological studies, however, the influence of anxiolytics, hypnotics, or antidepressants on crash risk seems to be more comparable to a BAC in-between 0.1‰ and 0.5‰, rather than 0.8‰. This means that, based on their effects on crash risk alone, these category III medicines would fall under category I (i.e. comparable to a BAC beneath 0.5‰). Even if the performance of long-term users of hypnotics and anxiolytics would be comparable to driving between 0.5‰ and 0.8‰, this would mean that these drugs fall under Category II containing groups of medicines that are likely to produce minor or moderate adverse effects (ICADTS List Version 26 June 2007).
In the current study, we aim to test fitness to drive in long-term users of category III anxiolytics, hypnotics and antidepressants. Fitness to drive can be measured with different instruments, mainly consisting of on-the-road or simulated driving tests. On-road tests have the major advantage of high ecological validity, but are relatively limited in terms of which driving tests one can perform, and have restricted experimental control. One of the most standardized on-road test measures, which is also validated according to the golden standard of driving under the influence of alcohol, is the standard deviation of the lateral position (SDLP) of the Road Tracking Test (O'Hanlon et al. Citation1982). The Road Tracking Test, however, assesses automated driving processes and it may be that impairment occurs in more complex driving tasks (Leufkens et al. Citation2014). Therefore, it is important to assess more complex driving tasks as well: tasks that can be measured more safely in a controlled environment with a driving simulator (Van Dijken et al. Citation2020).
The present data were collected as part of a larger study on the long-term effects of benzodiazepines and antidepressants on driving performance. As stated, the current study investigates driving behavior in patients who use anxiolytics, hypnotics, or antidepressants that fall within ICADTS category III, while performing both complex driving tasks and the road tracking task in a driving simulator. It was expected that driving performance does not differ between healthy controls and persons who had been using their medication longer than three years. Persons who had used their medication for a shorter period than 3 years, however, are expected to perform worse than participants in the healthy control group. Moreover, it was expected that this difference between healthy controls and short-term users of ICADTS category III would be clinically relevant, meaning that driving performance is impaired to a similar extent as driving with a BAC of 0.5‰ or higher (the golden standard).
Methods
Design
The current study was part of a large between-subjects, matched controls, multi-center trial in the Netherlands conducted at the universities of Utrecht, Maastricht, and Groningen. The goal of this trial was to compare driving performance in a simulator of long-term (>6 months) medication users with healthy controls. Specifically, potential differences between driving impairments of medication users who have used their medication shorter or longer than three years were explored. The selection of these durations is primarily based on Dutch law: benzodiazepine users are considered unfit to drive while being treated for less than 3 years, but they are allowed to request an individual fitness to drive evaluation after they used their medication for more than 3 years (Ministry of Infrastructure and Water Management Citation2000). The study design and procedures were the same at all three institutions.
Participants
Eighty-two medication users and 66 healthy controls participated in the current study. The participants were between 21 and 75 years old and were in possession of a driver’s license for at least 3 years. The medication users were using one type of ICADTS category III medication for at least 6 months and were allocated to either the antidepressants, anxiolytics, or hypnotics group. Medication users were divided in two groups: people that used their medication either shorter or longer than 3 years (LT3− or LT3+, respectively).
Exclusion criteria for all participants were presence of neurological conditions, use of illegal drugs, and alcohol abuse (>21 beverages a week; Monshouwer et al. Citation2018). Furthermore, healthy controls were excluded if they used other medication than over-the-counter medication, antihypertensive, or cholesterol-lowering medication. Medication users were excluded if they used multiple ICADTS category III medicines, or if the physician expected an undesired interaction (within this study) between the different medications that they reported to use. Inclusion criteria were an age between 21 and 75 years, being able to independently drive a motor vehicle, possession of a driver’s license for at least three years, and a minimal visual acuity of 0.5.
Thirty-eight medication users used antidepressants (20 LT3−, 18 LT3+), 32 used hypnotics (9 LT3−, 23 LT3+), and 12 used anxiolytics (3 LT3−, 9 LT3+; see for an overview of the medications used). Medication users had a mean age of 55 years (SD = 12.0 years), 50% was female, and they drove on average 11.650 kilometers per year (SD = 8350 km/year). Healthy controls were recruited with comparable age, gender distribution, and years of driving experience as the medication users. The healthy controls did not use any ICADTS category III medication, had an average age of 58 years (SD = 10.4 years), 44% was female, and they drove on average 13.500 kilometers per year (SD = 9450 km/year). For more details with regard to the specific participant groups, the reader is referred to Van der Sluiszen et al. (Citation2019) and Van der Sluiszen, Vermeeren, et al. (Citation2021).
Table 1. Overview of participants by medication used. LT3− = medication use in-between 6 months and 3 years; LT3+ = medication use longer than 3 years.
Prior to their participation, all participants provided written informed consent. The Medical Ethics Committee of Maastricht University provided ethical approval for the study, which was performed according to the ethical principles for medical research involving human participants established by the declaration of Helsinki (amended by the 64th WMA General Assembly, at Fortaleza, Brazil, October 2013) and in agreement with the Medical Research Involving Human Subjects Act (WMO). Participants were paid for their participation.
Measures
The measures of interest and the research equipment in the current study, as listed below, were also used and reported in a previous study (Van Dijken et al. Citation2020).
Driving simulator
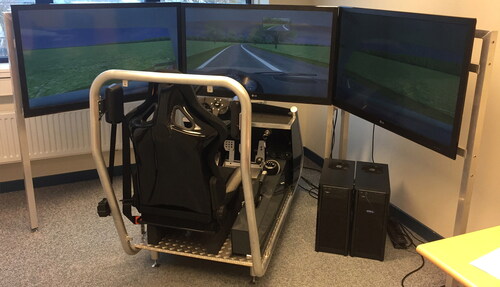
An ST Software© Jentig50 driving simulator was used for the study. This simulator includes a fixed-base mockup car cabin with a safety belt, accelerator, brake and clutch pedals, a steering wheel, handbrake, gear box, and indicator controls. Three 50-inch LED screens around the cabin that display dashboard, mirrors, and the road environment with a 200° field of view (see ). Other (simulated) vehicles in the environment interacted with the participant and the traffic environment in a natural manner (Van Winsum and Van Wolffelaar Citation1993).
Figure 1. The driving simulator.
Driving tasks
The order of driving tasks was fixed to reduce the risk of simulator sickness while also controlling for fatigue transfer effects. Experimenters adhered to a fixed protocol for providing instructions to participants at the start of each drive. While driving, additional speech instructions were presented by a computer voice. The first simulated drive took place on a winding road, without any traffic signs, and lasted approximately 10 min. Participants received instructions to drive as they normally would on comparable roads in the real world. This drive had as its aim to familiarize participants with the driving simulator. No data were collected during this drive.
Driving the second drive (see also Piersma et al. Citation2016) required about 10 min as well, and this part consisted of driving on a rural road, at max 80 km/h, with traffic signs and other traffic in the environment. While driving, participants passed six intersections with different speed and priority regulations. Participants were told to adhere to the traffic rules and to cross each intersection and drive straight on. Each driver’s reaction time was measured as the time between an upcoming traffic light that turned amber (at an approaching distance of 111 meters) and the driver pressing the brake pedal.
For the third driving task, participants were placed on an on-ramp of a highway. First, they were instructed to accelerate and merge into traffic once they could enter the highway. While on the highway, and they were asked to overtake one car after which they should directly return back to the right-hand lane again. All other cars in the fast lane followed the cars ahead of them at a preferred distance. Each consecutive car, however, attained a larger distance to the car in front of them, making increasingly more room available for the participant to perform the overtake. After the overtake was completed, the participants were asked to take the exit and park the car on the side of the road. Time-headway between the participant’s car and the vehicle ahead of them was measured during the overtake maneuver.
The sequence of driving tasks was concluded with a simulated version of the standard Road Tracking Test (O'Hanlon et al. Citation1982). For this drive, participants were instructed to drive for 30 min in the center of the right-hand lane on a single carriageway at a constant speed of 100 km/h. No traffic signs or other road users were present in the environment. The main aim of this task was to measure sustained vehicle control by means of the Standard Deviation of the Lateral Position (SDLP) and the Standard Deviation of Speed (SDSP) of the driver in the (simulated) vehicle.
Procedure
Advertisements in local newspapers were used to recruit participants. People could show their interest by phone or by signing up on a website and potential participants were contacted to check for initial inclusion and exclusion criteria. After this, eligible persons received a package with more information about the study, a medical questionnaire, and an informed consent form through mail. A researcher and a licensed physician evaluated the medical questionnaire: the researcher checked for inclusion and exclusion criteria and the physician judged the medical information. For each individual medication user, the physician evaluated whether the combination of the different medications that they used (with a maximum of one ICADTS category III medicine) were eligible for the study. For each healthy control that used over-the-counter medications, the physician judged if this had implications for their participation in the study.
During the days of their participation, all participants were asked to refrain from smoking, using drugs, drinking alcohol, or taking drinks that contain caffeine. Furthermore, all participants were asked to adopt a normal sleep pattern during the week before participation (i.e. not working in night shifts). Medication users were asked to use their medication, as they would normally do.
Participants visited the research center on two different occasions. The goal of the first occasion was to familiarize the participants with the tests, data were collected only during the second occasion. The procedures during both test occasions were identical. First, participants were informed that they could terminate their participation at any moment. Subsequently, they were checked for alcohol use (via a breathalyzer) and drug use (urine sample).
Furthermore, participants filled out a questionnaire about their medication use in the prior 24 h, after which a series of tests began. Based on their own personal preference, the participants started at 8:30, 10:30, or 12:30, and these times were kept the same over the practice and test days.
Since the current driving simulator study was part of a larger study, participants visited the research center for 5 h on each occasion. The inclusion check, neurocognitive and on-the-road driving performance were assessed in the first 4 h (for detailed procedures see: Van der Sluiszen, Vermeeren, et al. Citation2021). The last 60 min of each occasion consisted of the driving tasks in the simulator that are described in the current study. Before the driving tasks were performed, participants had a short break, they also had a break between the third and last drive.
Statistical analyses
Initial analysis revealed that the data were not normally distributed. Missing values were left out of the analyses. In Table A1, an overview per group is given including the reasons for dropping out.
Boxplots were used to detect extreme outliers within each medication sub-group and matched control sub-group. Outliers of three times the interquartile range or more were removed before the non-inferiority analyses, but not before the superiority testing. The removed outliers within the medication group were one participant from the short-term antidepressant users and one participant from the long-term hypnotics users subgroups, both showing an extremely high (i.e. safer) time headway compared to the rest of their subgroup. The removed outliers within the matched control group were two participants within the LT3+ antidepressant user’s subgroup who showed an extremely high (i.e. less safe) SDLP and one participant within the same subgroup who showed an extremely high (i.e. less safe) SDSP compared to the rest of the subgroup.
To investigate whether medication users showed deteriorated driving performance compared to healthy controls, each medication group was compared to their matched controls with two-sided Mann–Whitney-U tests (superiority testing). Because superiority analyses provide no information on the clinical relevance of found differences between medication users and healthy controls, and do not indicate similarity between groups (Sackett Citation2004), non-inferiority analyses were performed. In non-inferiority analyses, the difference in an outcome value between two groups and the 95% confidence interval (CI) surrounding that difference is compared to a predetermined reference value (Δ), which is the clinically or scientifically accepted difference of that outcome value. In the current study, the reference value that was used for each measure was the effect of 0.5‰ alcohol on the driving performance measures as described in Van Dijken et al. (Citation2020): a study that was conducted using the same driving simulator and scenarios as the current study. Non-inferiority was concluded when the average difference and its 95% Confidence Interval (CI) was below the 0.5‰ alcohol reference value for the measures in which lower values represent a better performance (the reaction time to a traffic light, swerving behavior, and variation in speed) (see e.g. Piaggio et al. Citation2012). Inferiority was in this case concluded when the lower limit of the 95% CI was above the reference value. For the measure in which higher values represent better performance (time headway during overtaking), non-inferiority was concluded when the average difference and its 95% CI was above the 0.5‰ alcohol reference level. Inferiority was in this case concluded when the upper limit of the 95% CI was below the reference value. Results on non-inferiority remained inconclusive when the 95% CI contained both 0 and Δ (Ahn et al. Citation2013; Hahn Citation2012; Walker and Nowacki Citation2010). Additionally, the results in which lower values represent a better performance were considered “within the spectrum of inconclusive and inferior” if both the upper limit of the 95% CI exceeded the 0.5‰ alcohol reference value, and the lower limit of the 95% CI was above zero
Conversely, the results in which higher values represent a better performance were considered “within the spectrum of inconclusive and inferior” in case both the lower limit of the 95% CI exceeded the 0.5‰ alcohol reference value, and the upper limit of the 95% CI was below zero (Piaggio et al. Citation2012; Althunian et al. Citation2017; cited in Van der Sluiszen, Urbanus, et al. Citation2021).
Sample size calculation
As a starting point for the power analysis, the main outcome variable SDLP was used. Assuming an omnibus p-value of < 0.05, a minimum detectable difference of 2.5 cm, an average population S.D. of 4 cm, and a group size of n = 40, the analysis revealed a power of 0.8 to detect clinically relevant differences between groups. With regard to subgroups (n = 20), the power is 0.6.
Results
The aim of this research was to determine differences in driving performance between LT3− and LT3+ users (patients) of anxiolytics, hypnotics, or antidepressants (i.e. ICADTS category III). Driving performance was measured in terms of swerving (SDLP), speed variation (SDSP), brake reaction time to an amber traffic light (RTTL), and adopted distance while overtaking another driver on the motorway (Time Headway: THW), all assessed in a driving simulator. Two types of analyses were performed: Mann–Whitney U Tests to compare behavioral group differences and non-inferiority tests to verify clinical relevance. For the outcome of all analyses performed, the reader is referred to the appendices (Tables A2 and A3), while a summary of all clinically relevant effects is provided in .
Table 2. Summary of results.
Anxiolytics
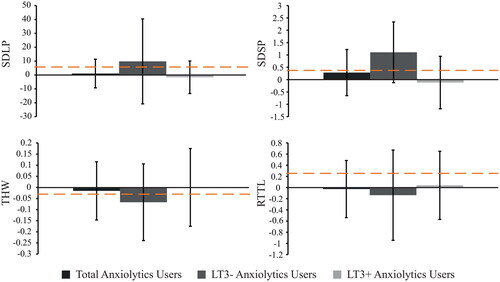
The first analyses revealed that on average, the overall group of anxiolytics users, as well as divided into LT3− and LT3+, did not significantly differ from their matched controls on SDLP, SDSP, RTTL, and THW (see Table A2). In addition, the non-inferiority analyses for all driving measures showed inconclusive results (see and Table A3).
Figure 2. Non-inferiority analyses of swerving behavior (SDLP, cm), SD speed (km/h), time headway (THW, s), and reaction time (RTTL, s) of anxiolytics users. Bars show differences (medication user – matched control), with the 95% confidence interval. The dashed orange line represents the reference value that was found at 0.5‰ alcohol in a repeated measures study (Van Dijken et al. Citation2020).
Antidepressants
Antidepressants users did not differ significantly from their matched controls on SDLP, SDSP, RTTL, and THW (Table A2). The non-inferiority analyses showed that SDLP of the antidepressants users was non-inferior to that of their matched controls, meaning that there was no clinically relevant difference in the amount of swerving (see and ). With regard to SDSP, RTTL, and THW, the evidence was inconclusive for determining clinical relevance (Table A3).
Figure 3. Non-inferiority analyses of antidepressants users. Bars show differences (medication user – matched control), with the 95% confidence interval. The dashed orange line represents the reference value that was found at 0.5‰ alcohol in a repeated measures study (Van Dijken et al. Citation2020).
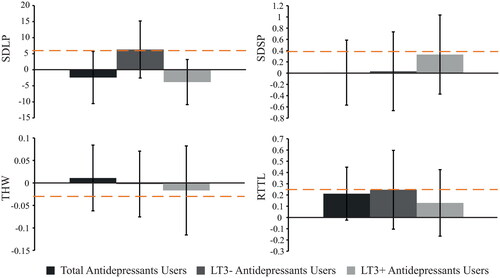
As separate groups, LT3+ and LT3− users of antidepressants did not significantly differ from their matched controls on any of the driving variables (Table A2). Furthermore, the non-inferiority analysis revealed that LT3+ antidepressants users showed swerving behavior (SDLP) that was non-inferior to that of matched controls, indicating that there is no clinically relevant difference (see and ). This analysis also indicated that outcomes regarding SDLP of LT3− users were inconclusive, however. In addition, the data showed inconclusive results for both LT3+ users and LT3− users of antidepressants in terms of SDSP, RTTL, and THW (Table A3).
Hypnotics
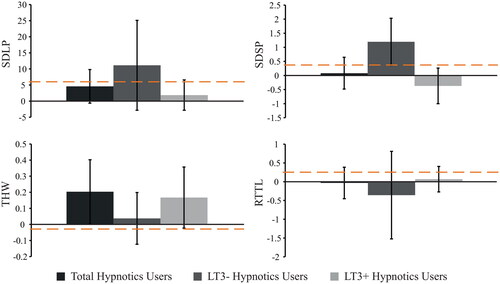
The overall group of hypnotics users did not significantly differ from their matched controls on SDLP, SDSP, RTTL, or THW (Table A2). With regard to clinical relevance, only the adopted distance during overtaking (THW) of the hypnotics users was non-inferior to that of matched controls (see ). The remaining non-inferiority analyses showed inconclusive results (Table A3).
Division of hypnotics users into LT3+ and LT3− users did not reveal significant differences between the LT3+ users and matched controls on any of the driving measures (Table A2). This is largely the case for LT3− hypnotics users as well, but LT3− hypnotics users did show a significantly larger variation in speed (SDSP) compared to matched controls (). In addition, the non-inferiority analyses revealed that SDSP was within the spectrum of inconclusive and inferior compared to the matched control group. The majority of the individual patients’ SDSP scores were above the alcohol criterion, however, which could be interpreted as inferior speed control in LT3− hypnotics users (see and ). All remaining non-inferiority tests for the LT3− hypnotics users revealed inconclusive results (Table A3). For LT3+ hypnotics users, both SDSP and the adopted distance during overtaking (THW) were non-inferior to those of matched controls ( and ). The remaining non-inferiority analyses showed inconclusive results for the LT3+ users (Table A3). Taken together, these results suggest that LT3− users of hypnotics show some signs of deteriorated speed control, while LT3+ users (and the overall group) show no clinically relevant differences on speed control and adopted distance.
Figure 4. Non-inferiority analyses of hypnotics users. Bars show differences (medication user – matched control), with the 95% confidence interval. The dashed orange line represents the reference value that was found at 0.5‰ alcohol in a repeated measures study (Van Dijken et al. Citation2020).
Discussion
The main goal of this study was to determine differences in driving performance between users of so-called ICADTS III medication (i.e., anxiolytics, hypnotics, or antidepressants) as compared to healthy controls. We tested both complex driving and basic driving performance in a driving simulator. The medication users were divided into two groups, based on the time span of their medication usage: shorter or longer than three years (LT3− and LT3+, respectively). The main dependent variables were swerving (SDLP), speed control (SDSP), reaction time to a traffic light (RTTL), and time headway while overtaking another driver on the highway (THW). Median values of driving performance in the two medication user groups were first compared with matched healthy controls, followed by comparing the mean differences with a preset 0.5‰ BAC reference mean (golden standard) to determine clinical relevance of potential impairments.
Anxiolytics
For patients using anxiolytics, it was found that neither the overall group, nor the LT3− or LT3+ users differed from their matched controls on any of performance measures in the driving simulator. Although this might seem like all patients performed similarly to healthy controls, it should be noted that the sample was small, resulting in less statistical power (particularly in the separated LT3− and LT3+ groups), and the measurements showed large inter-individual variation. As a consequence, the 95% Confidence Intervals of all differences between anxiolytics users and matched controls included both zero and the alcohol criterion, which prevents drawing reliable conclusions about both the superior and inferiority testing and, therefore, of the clinical relevance of the results found with this sample. It is therefore difficult to conclude whether there are no clinically relevant effects, or that a potential lack of statistical power prevented finding such effects. The outcomes of the driving simulator supplement the findings reported in Van der Sluiszen et al. (Citation2019) who tested the same sample of anxiolytics users while driving in a real car on the motorway. In this test, the variability was also high and the analyses revealed non-significant differences and inconclusive results as well.
Antidepressants
With regard to users of antidepressants, no significant differences were found between patients and their matched controls on any of the driving measures. Most of the non-inferiority analyses revealed inconclusive results, specifically regarding SDSP, RTTL, and THW. However, it was found that swerving behavior (SDLP) of the overall group of antidepressant users was non-inferior to that of their matched healthy controls, meaning that there was no clinically relevant difference in the amount of swerving. Similar to the on-road test results found by Van der Sluiszen, Vermeeren, et al. (Citation2021), it seems that this finding is largely explained by the LT3+ users group because the SDLP performance of the LT3+ users was non-inferior to that of the control group, while the SDLP analyses for the LT3− users were inconclusive. This could indicate that SDLP impairments are unimpaired or mitigate over longer use of antidepressants medication. This is in line with the literature study by Brunnauer et al. (Citation2021), who also found indications that long-term use of antidepressants may limit driving impairments or at least stabilizes these at a more “normal” level. It is still unclear, however, whether this effect originates from tolerance effects or because of treated symptoms of depression (Hill et al. Citation2017).
Hypnotics
For the users of hypnotics, on average, LT3− hypnotics users showed higher speed variability (SDSP) than healthy controls. The non-inferiority analyses classified this difference as inferior, indicating that there is a 95% chance that car velocity control in LT3− hypnotics users is similar to driving with 0.5‰ BAC. For the LT3+ hypnotics users, however, mean SDSP was neither significantly different from the healthy control group, nor did the 95% CI of the difference include the 0.5‰ BAC criterion for impaired driving. Even though the absolute difference is relatively small, this seems to indicate that the ability to maintain a constant speed is impaired in LT3− hypnotics users because they were explicitly instructed to drive at a constant speed of 100 km/h during this task. Moreover, in LT3+ users, SDSP turned out to be non-inferior, suggesting that the effects of this medication diminished after prolonged use (i.e. after more than 3 years use). None of the remaining group comparisons revealed significant differences between hypnotics users and healthy controls, but it was found that THW of hypnotics users in general was non-inferior to their matched healthy controls. This means that there was no clinically relevant difference between long-term users and non-users in the adopted distance to a car in front while overtaking. Separate this analysis into LT3− and LT3+ hypnotics users, evidence for non-inferiority only holds for LT3+ users, while the analysis for LT3− users revealed inconclusive effects. Taking into account that both SDSP and THW are variables related to longitudinal control (speed), it seems that potential detrimental effects of hypnotics on this aspect of driving behavior could mitigate after prolonged use, which is in line with findings of Leufkens et al. (Citation2014) and Van der Sluiszen et al. (Citation2019).
It should be noted, however, that the non-inferiority analyses with regard to SDLP and RTTL only revealed non-significant and inconclusive results, while LT3+ hypnotic users showed non-inferior SDLP performance during on-the-road driving (Van der Sluiszen et al. Citation2019). Considering the confidence intervals of the mean differences between patients and healthy controls, it seems that inter-individual variance of SDLP performance in the driving simulator was larger compared to the on-road driving task. For this reason, it could be that the sample was sufficient to indicate non-inferiority while driving in a real car, but not in the driving simulator. This could either mean that a driving simulator is less sensitive to show this aspect of driving behavior, or it could be a limitation in statistical power from the sample. Furthermore, reaction time performance of LT3+ hypnotics users on neurocognitive tests was found to be non-inferior (Van der Sluiszen et al. Citation2019), which could neither be confirmed nor disproved in the driving simulator RTTL task.
Strengths and limitations
As with every study, there are several strengths and limitations that should be mentioned. First, the sample consisted of participants who used a wide variety of different medications. On the one hand, this should be considered a strength because these medications are all used in real life practice, resulting in high ecological validity. At the same time, however, this also increases the heterogeneity of the sample because the different effects of these medications lead to large variability. This may have resulted in many inconclusive findings. Second, the participants who volunteered to join in the study may have been relatively well-feeling or functioning compared to the “average” user of the tested medication. This could mean that their driving behavior might be different (e.g. less impaired or influenced by their condition) compared to users of the same medication who feel less able or inclined to volunteer. On the other hand, however, one might expect that these participants are the more active type of persons who also participate more in traffic, which is the target group of this study. Third, the participants in the current study were limited to people that only used the specified medication. This procedure was followed in order to isolate the effects of these medications. This also means, however, that sample sizes were limited, particularly in the anxiolytics users group, which, potentially also in combination with using non-parametric tests, could have resulted in a lack of power to detect statistically significant differences. Furthermore, it also occurs that people use other psychoactive substances concomitantly with their own medication (see e.g. Herrera-Gomez et al. Citation2020), potentially resulting in different effects on driving behavior and crash risk, which the current study could not determine. Finally, it should be noted that even though an advanced driving simulator was used, some aspects, such as a limited field of view and the absence of motion feedback, may limit a driver in perceiving (subtle) changes in driving speed compared to driving in a real car. For this reason, the absolute values of variation in speed may be different compared to on-road driving, for example. Generalization of the findings to the driving task in a real car should, therefore, be performed with caution.
Conclusions
On the basis of the present study, it may be concluded that, even though the majority of analyses were inconclusive, there is evidence that some elements of both basic and complex driving performance may not be impaired anymore in long-term users of antidepressants and hypnotics. Specifically, lateral control (SDLP) in long-term users of antidepressants and distance keeping behavior (THW) on the highway in hypnotics users. For the latter group, we found that speed control (SDSP) is clinically impaired in hypnotics users who used this medication for less than three years, but this was not clinically impaired in drivers who used hypnotics for longer than three years. Therefore, the present study supports the idea that impairing effects of these medications found on the short-term decrease over time.
Supplemental Material
Download MS Word (55.5 KB)Acknowledgements
The authors would like to thank B. de Kruijk, E. Flier, and M. Janmaat (University of Groningen), J. Jansen, R. Enkelaar, Z. Kösem, J. Zwart, W. Langendroff, S. Timmermans, S. van Kreel, D. Bervoets, and S. de Klerk (University of Utrecht), A. van Oers, I. Brauers, H. Brauers, C. Steins, J. Jongen, and S. Coleman (Maastricht University), for their assistance in carrying out the study and P.P. de Deyn, MD (University of Groningen), N. Bouwmeester, MD (University of Utrecht), and C. van Leeuwen, MD (Maastricht University), for their medical supervision.
Disclosure statement
Over the past three years, J.C. Verster has acted as a consultant/advisor for Eisai, KNMP, Sen-Jam Pharmaceutical, Red Bull, and Toast!. A. Vermeeren and J.G. Ramaekers have received funding over the last 4 years from Eisai, Jazz, Merck, and Transcept.
Additional information
Funding
References
- Ahn S, Park S, Lee K. 2013. How to demonstrate similarity by using noninferiority and equivalence testing in radiology research. Radiology. 267(2):328–338. doi:10.1148/radiol.12120725.
- Althunian TA, de Boer A, Groenwold RH, Klungel OH. 2017. Defining the noninferiority margin and analysing noninferiority: an overview. Br J Clin Pharmacol. 83(8):1636–1642. doi:10.1111/bcp.13280.
- Ashton H. 1994. Guidelines for the rational use of benzodiazepines. Drugs. 48(1):25–40. doi:10.2165/00003495-199448010-00004.
- Brody D, Gu Q. 2020. Antidepressant use among adults: United States, 2015–2018. Hyattsville (MD): National Center for Health Statistics. NCHS Data Brief, no 377. https://www.cdc.gov/nchs/products/databriefs/db377.htm.
- Brookhuis K. 1998. How to measure driving ability under the influence of alcohol and drugs, and why. Hum Psychopharmacol Clin Exp. 13(S2):S64–S69. doi:10.1002/(SICI)1099-1077(1998110)13:2+<S64::AID-HUP51>3.0.CO;2-N.
- Brunnauer A, Herpich F, Zwanzger P, Laux G. 2021. Driving performance under treatment of most frequently prescribed drugs for mental disorders: a systematic review of patient studies. Int J Neuropsychopharmacol. 24(9):679–693. doi:10.1093/ijnp/pyab031.
- Bushnell G, Stürmer T, Gaynes B, Pate V, Miller M. 2017. Simultaneous antidepressant and benzodiazepine new use and subsequent long-term benzodiazepine use in adults with depression, United States. JAMA Psychiatry. 74(7):747–755. doi:10.1001/jamapsychiatry.2017.1273.
- Dassanayake T, Michie P, Carter G, Jones A. 2011. Effects of benzodiazepines, antidepressants and opiods on driving: a systematic review and meta-analysis of epidemiological and experimental evidence. Drug Saf. 34(2):125–156.
- Dubois S, Bédard M, Weaver B. 2008. The impact of benzodiazepines on safe driving. Traffic Inj Prev. 9(5):404–413. doi:10.1080/15389580802161943.
- Gerlach L, Maust D, Leong S, Mavandadi S, Oslin D. 2018. Factors associated with long-term benzodiazepine use among older adults. JAMA Internal Med. 178(11):1560–1562.
- GIP/Zorginstituut Nederland. 2022. Het aantal gebruikers van antidepressiva, 2003 - 2021. https://www.gipdatabank.nl/databank?infotype=g&label=00-totaal&tabel=85_dep&geg=gebr&item=bijlage
- Gjerde H, Strand M, Morland J. 2015. Driving under the influence of non-alcohol drugs - an update part I: epidemiological studies. Forensic Sci. Rev. 27(2):90–113.
- Hahn S. 2012. Understanding noninferiority trials. Korean J Pediatr. 55(11):403–407. doi:10.3345/kjp.2012.55.11.403.
- Herrera-Gómez F, García-Mingo M, Álvarez F. 2020. Benzodiazepines in the oral fluid of Spanish drivers. Subst Abuse Treat Prev Policy. 15(1):1–8. doi:10.1186/s13011-020-00260-y.
- Hetland A, Carr DB. 2014. Medications and impaired driving. Ann Pharmacother. 48(4):494–506. doi:10.1177/1060028014520882.
- Hill L, Lauzon V, Winbrock E, Li G, Chihuri S, Lee K. 2017. Depression, antidepressants and driving safety. Inj Epidemiol. 4(1):1–10. doi:10.1186/s40621-017-0107-x.
- Høye A, Hesjevoll I. 2023. Alcohol and driving - how bad is the combination? Traffic Inj Prev. 24(5):373–378. doi:10.1080/15389588.2023.2204984.
- Leufkens T, Ramaekers J, De Weerd A, Riedel W, Vermeeren A. 2014. On-the-road driving performance and driving-related skills in older untreated insomnia patients and chronic users of hypnotics. Psychopharmacology (Berl). 231(14):2851–2865. doi:10.1007/s00213-014-3455-z.
- Leung SY. 2011. Benzodiazepines, opioids and driving: an overview of the experimental research. Drug Alcohol Rev. 30(3):281–286. doi:10.1111/j.1465-3362.2011.00311.x.
- Ministry of Infrastructure and Water Management. 2000. Regeling eisen geschiktheid (REG 2000). http://wetten.overheid.nl/BWBR0011362/.
- Monshouwer K, Tuithof M, van Dorsselaer S. 2018. Factsheet riskant alcoholgebruik in Nederland [Factsheet risky alcohol use in the Netherlands]. Utrecht: trimbos-Instituut [Netherlands Institute of Mental Health and Addiction]. [accessed 2023, Feb 23]. https://www.trimbos.nl/wp-content/uploads/sites/31/2021/09/af1599-factsheet-riskant-alcoholgebruik-in-nederland.pdf
- O’Hanlon J, Haak T, Blaauw G, Riemersma J. 1982. Diazepam impairs lateral position control in highway driving. Science. 217(4554):79–81. doi:10.1126/science.7089544.
- Orriols L, Philip P, Moore N, Castot A, Gadegbeku B, Delorme B, Mallaret M, Lagarde E, CESIR Research Group. 2011. Benzodiazepine-like hypnotics and the associated risk of road traffic accidents. Clin Pharmacol Ther. 89(4):595–601. doi:10.1038/clpt.2011.3.
- Piaggio G, Elbourne DR, Pocock SJ, Evans SJW, Altman DG, CONSORT Group FT. 2012. Reporting of noninferiority and equivalence randomized trials: extension of the CONSORT 2010 statement. JAMA. 308(24):2594–2604. doi:10.1001/jama.2012.87802.
- Piersma D, Fuermaier ABM, de Waard D, Davidse RJ, de Groot J, Doumen MJA, Bredewoud RA, Claesen R, Lemstra AW, Vermeeren A, et al. 2016. Prediction of fitness to drive in patients with Alzheimer’s dementia. PLoS One. 11(2):e0149566. doi:10.1371/journal.pone.0149566.
- Ravera S, van Rein N, de Gier JJ, de Jong-van den Berg LT. 2011. Road traffic accidents and psychotropic medication use in the Netherlands: a case-control study. Br J Clin Pharmacol. 72(3):505–513. doi:10.1111/j.1365-2125.2011.03994.x.
- Roth T, Eklov S, Drake C, Verster J. 2014. Meta-analysis of on-the-road experimental studies of hypnotics: effects of time after intake, dose, and half-life. Traffic Inj Prev. 15(5):439–445. doi:10.1080/15389588.2013.830211.
- Sackett DL. 2004. Superiority trials, noninferiority trials, and prisoners of the 2-sided null hypothesis. ACP J. Club. 140(2):A11.
- SAMHSA. 2017. Results from the 2016 National Survey on Drug Use and Health: Detailed Tables. Rockville (MD): Center for Behavioral Health Statistics and Quality, Substance Abuse and Mental Health Services Administration. [accessed 2023 Aug 3]. https://www.samhsa.gov/data/sites/default/files/NSDUH-DetTabs-2016/NSDUH-DetTabs-2016.pdf
- SAMHSA. 2022. Results from the 2020 National Survey on Drug Use and Health: Detailed Tables. Rockville (MD): Center for Behavioral Health Statistics and Quality, Substance Abuse and Mental Health Services Administration. [accessed 2023 Aug 3]. https://www.samhsa.gov/data/sites/default/files/reports/rpt35323/NSDUHDetailedTabs2020v25/NSDUHDetailedTabs2020v25/NSDUHDetailedTabs2020.pdf
- Taylor B, Irving HM, Kanteres F, Room R, Borges G, Cherpitel C, Greenfield T, Rehm J. 2010. The more you drink, the harder you fall: a systematic review and meta-analysis of how acute alcohol consumption and injury or collision risk increase together. Drug Alcohol Depend. 110(1–2):108–116. doi:10.1016/j.drugalcdep.2010.02.011.
- Van der Sluiszen N, Urbanus B, Lammers GJ, Overeem S, Ramaekers JG, Vermeeren A. 2021. On-the-road driving performance of patients with central disorders of hypersomnolence. Traffic Inj Prev. 22(2):120–126. doi:10.1080/15389588.2020.1862804.
- Van der Sluiszen N, Vermeeren A, Jongen S, Vinckenbosch F, Ramaekers JG. 2017. Influence of long-term benzodiazepine use on neurocognitive skills related to driving performance in patient populations: a review. Pharmacopsychiatry. 50(5):189–196. doi:10.1055/s-0043-112755.
- van der Sluiszen NN, Vermeeren A, van Dijken JH, J.a.e. van de Loo A, Veldstra JL, de Waard D, C. Verster J, A. Brookhuis K, Ramaekers JG. 2021. Driving performance and neurocognitive skills of long-term users of sedating antidepressants. Human Psychopharmacol. 36(1):e2762–12. doi:10.1002/hup.2762.
- van der Sluiszen NN, Vermeeren A, Verster JC, van de Loo AJ, van Dijken JH, Veldstra JL, Brookhuis KA, de Waard D, Ramaekers JG. 2019. Driving performance and neurocognitive skills of long-term users of benzodiazepine anxiolytics and hypnotics. Human Psychopharmacol. 34(6):e2715. doi:10.1002/hup.2715.
- van Dijken JH, Veldstra JL, van de Loo AJAE, Verster JC, van der Sluiszen N, Vermeeren A, Ramaekers JG, Brookhuis KA, de Waard D. 2020. The influence of alcohol (0.5‰) on the control and manoeuvring level of driving behaviour, finding measures to assess driving impairment: A simulator study. Transp Res Part F Traffic Psychol Behav. 73:119–127. doi:10.1016/j.trf.2020.06.017.
- Van Winsum W, Van Wolffelaar P. 1993. GIDS small world simulation. In: Michon J, editor. Generic intelligent driver support. London: Taylor & Francis. p. 175–191.
- Walker E, Nowacki A. 2010. Understanding equivalence and noninferiority testing. J Gen Intern Med. 26(2):192–196. doi:10.1007/s11606-010-1513-8.
- Wingen M, Ramaekers JG, Schmitt JA. 2006. Driving impairment in depressed patients receiving long-term antidepressant treatment. Psychopharmacology (Berl). 188(1):84–91. doi:10.1007/s00213-006-0471-7.