
Abstract
Surveys estimating chronic obstructive pulmonary disease (COPD) prevalence are unevenly distributed in the Americas, which make it difficult to estimate accurately its geographical distribution. The geographic information system inverse distance weighted (IDW) interpolation technique has proved to be an effective tool in spatial distribution estimation of epidemiological variables, even when real data are few or widely spread. We aimed to represent cartographically the COPD prevalence in the Americas by means of a blue to red scale representation of the prevalence data, where different values are represented as different colours, and a population density filtered IDW interpolation mapping, where areas with a population density <0.1 inhabitants/km2 are hidden. We systematically searched for prevalence rates from population surveys of individuals 40 years and older, and a COPD diagnosis confirmed by spirometry. Interpolation maps were obtained for the whole Americas, even from extensive areas lacking real data. Maps showed high prevalence values in the Southeast and Southwest regions of Canada bordering the United States; in several states of the Great Lakes region, and in the lower Missouri, Ohio and Mississippi basins of the United States; in the coastal regions of south-eastern and southern Brazil; Uruguay, and the Argentine Pampas. In general, most of the remaining American regions showed intermediate values of COPD prevalence. IDW interpolation seems to be a suitable tool to visually display estimates of COPD prevalence, and it may be a valuable help to draw attention about the worrying prevalence of this preventable and treatable disease.
Introduction
Up-to-date information on the distribution and determinants of chronic obstructive pulmonary disease (COPD) is important to fostering policies aimed at improving existing intervention strategies to reduce its burden with affordable interventions (Citation1). However, despite being a major health problem, existing data on COPD prevalence in the American continent are very irregularly distributed, with great differences among the 35 sovereign countries that compose it, in many of which data are scarce or out-dated, and in some unavailable or non-existent. This reality deprives patients and health authorities of the implementation of adequate preventive and therapeutic interventions, in order to reduce its burden and high costs (Citation2).
Interpolation maps, where each category of prevalence is represented by different colours or shades, and the countries are shaded depending on their classification into the different categories, are an effective complementary alternative to the listings and numerical tables to display the geographic distribution of data. Specifically, the geographic information system (GIS) inverse distance weighted (IDW) interpolation technique is a computerised mathematical approach to manipulating spatial information, capable to extract new information and meaning from raw data, using points with known values to estimate values at other unknown points. This method is based on the assumption that the attribute value of an unsampled point is the weighted average of known values within the four nearest data points, assuming that each measured point has a local influence that diminishes with distance, weighting the points closer to the prediction location greater than those located farther away (Citation3).
The history of the ‘medical GIS’ started when the British physician John Snow (1813–1858), ‘the father of epidemiology’, demonstrated the water-borne origin of cholera by plotting cholera-related deaths in London during the 1854 epidemic on maps. Removing the contaminated pump led to the almost immediate end to new cases in the area, proving that drinking water from this pump was the causative agent of the epidemic (Citation4). Since then, continuing innovations in GIS has made it an invaluable approach, which identifies and maps medically vulnerable populations, and from the 1990s to today it is becoming a valued system in analysing medical and epidemiological phenomena of all types (COPD included), ranging, paraphrasing Musa et al., ‘from cholera to cancer’ (Citation5).
Therefore, since GIS has proved to be an effective tool in spatial distribution estimation of epidemiological variables, when real data are few and widely separated (Citation6–9), as might be the case with the COPD prevalence in most regions of the Americas (with the remarkable exception of the United States), in the present study a systematic review was carried out for prevalence rates from population surveys of individuals 40 years and older, and a COPD diagnosis confirmed by spirometry. With the prevalence data obtained, an IDW interpolation mapping has been applied with the objective of integrating the existing data from the different regions of the Americas, taking into account the population density (i.e. the number of people living per unit of an area per square kilometre), in order to represent cartographically the mean percentage of the population affected by COPD in each geographical region of the Americas, both in areas with known data as well as in other in which no surveys have been conducted.
Methods
Search strategy
We conducted a systematic literature search of Medline, Excerpta Medica database (EMBASE; via Ovid) and Google Scholar to identify original, population-based studies providing spirometry-based prevalence rates of COPD in the Americas, from January 2000 to December 2017, in order to estimate the crude prevalence rates of COPD in people aged 40 years or more. Each search was conducted with the term ‘COPD’ as the main search concept, in combination with ‘prevalence’; ‘burden’; ‘North America’; ‘Central America’; ‘South America’; and the names of the countries of North America, Central America, the Caribbean and South America.
Studies selection
The criteria for inclusion of articles were: (a) study design: cross-sectional and longitudinal prevalence surveys; (b) samples representative of the target population (i.e. adult subjects of both sexes selected by simple random or stratified sampling); (c) mean age of the sample equal to or greater than 40 years old; (d) COPD diagnosis based on validated spirometry criteria.
The criteria for exclusion of articles were: (a) randomised control trials or intervention studies; (b) samples not selected by random or stratified sampling; (c) samples of subjects with multiple diseases such as pulmonary tuberculosis, obstructive sleep apnoea syndrome, HIV, metabolic disorders, cardiovascular disorders, gastrointestinal diseases, malignant tumours, etc.; (d) mean age of the samples below 40 years; (d) COPD diagnosis not confirmed by spirometry.
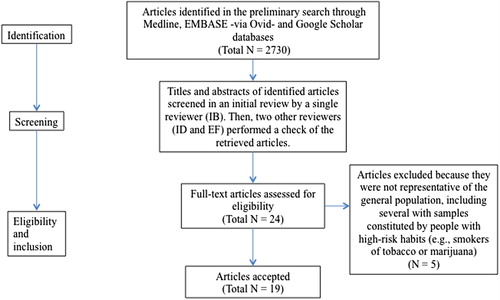
The titles and abstracts of identified articles were screened in an initial review by a single reviewer (IB). Then, two other reviewers (ID and EF) performed a check of the retrieved articles. Articles identified as potentially relevant containing the minimum information necessary to estimate the place where the survey was carried out, the approximate date of the beginning and the end of the survey, the number of subjects and their distribution by sex and ages, as well as some basic methodological details with mention of sampling strategy, study design, approach of diagnosis, spirometric criteria used for COPD diagnosis, and COPD prevalence, were obtained in full text for further evaluation. Articles with discrepancies were resolved by consensus among the three initial reviewers. Then, the rest of authors reviewed the articles selection, which was approved by consensus.
After this initial stage, prevalence data were extracted from 24 articles (Citation10–33). Some of them were multi-centric or international, with samples from multiple regions of the same country or from different countries. Of these 24 retrieved articles, five were discarded because they were not representative of the general population, including several with samples constituted by people with high-risk habits (e.g. smokers of tobacco or marijuana) or with symptoms of COPD (Citation13–17,Citation27). Although nine studies from the United States were selected, given that practically all provided results of the National Health and Nutrition Examination Surveys (NHANES), a cross-sectional survey of the civilian, non-institutionalized U.S. population, designed to identify an unbiased sample that can be extrapolated to the entire population, the data used for this study are mainly from the updated NANHES 2007–2010 report (Citation26). Since NHANES only provides the overall COPD prevalence, but not the individual prevalence of each state, the specific data of each state were obtained from the Behavioural Risk Factor Surveillance System (BRFSS), an epidemiological system which receives technical and methodologic assistance from the Centers for Disease Control and Prevention (CDC), and collects data in all U.S. 50 states as well as the District of Columbia and three U.S. territories. The state-specific COPD prevalence data and other state-specific COPD indicators are available and can be downloaded at URL: https://nccd.cdc.gov/cdi, 2016, accessed February 18, 2018.
Finally, the prevalence data were extracted from nine articles () (Citation10–12,Citation26,Citation28–33).
Figure 1. Simplified PRISMA flowchart of study selection.
IDW multivariate interpolation method
To elaborate coloured maps of COPD prevalence, an IDW interpolation process was started via the freely available software QGIS 18.9 (http://www.qgis.org/es/site/) in order to link from it with to the 7.3 64bit wxPython 3 (https://grass.osgeo.org/) geographic resources analysis support system (GRASS).
Next, the geographical longitude and latitude coordinates of the different places were automatically obtained for each point by translating the location of the place of origin of the samples included. The translation was made through the Google Maps Application Programming Interface (API) using the web page GPSVisualizer (http://www.gpsvisualizer.com/). Then, these geographical coordinates were imported into the database and then exported to a ‘csv’ (‘comma separated value’) text file, which was opened and visualised in quantum GIS (QGIS). A shape file containing the contours of all world countries was also loaded.
Then, the interpolation process was carried out by applying the v.surf.idw library included in the GRASS GIS 7 version (https://grass.osgeo.org/grass72/manuals/v.surf.idw.html), another free and open source GIS software suite used for geospatial data management and analysis, spatial modelling, image processing, graphics and maps production and visualisation. The v.surf.idw library provided surface interpolation from vector point data by filling out a raster matrix with interpolated values generated from a set of irregularly spaced data points, using numerical approximation (weighted averaging) techniques. The interpolated value of a cell was determined by the values of the nearby data points and the distance of the cell from those input points. In our study, the usual N value of 4 (N = 4) was chosen. This means that a sample point takes the four closest pixel centres and linearly interpolates their colour values according to their distance from the sample point. A power parameter (p) of 2, and a 0.01-Degree resolution were the values used for this study.
For the first time, in order to eliminate from visualisation areas with very low or no human presence, a raster file (that is a bitmap image with a dot matrix data structure, representing a generally rectangular grid of pixels, or points of colour, viewable via a monitor, paper or other display medium) containing population density was obtained from the National Aeronautics and Space Administration (NASA) Socioeconomic Data and Applications Center (http://dx.doi.org/10.7927/H4F47M2C), and loaded onto QGIS. This information was combined with the IDW interpolation file using the raster calculator tool. Areas where population density was below 0.1 inhabitants per square kilometre were excluded from visualisation.
To classify the prevalence values, and in order to include the minimum and maximum values reported by the selected surveys (i.e. 2.8% and 19.6%), a numerical scale ranging from 0 to 20 was used. This 0–20-numerical scale was distributed in 10 intervals of 2 units each, namely: 0-1.9; 2-3.9; 4-5.9; 6-7.9; 8-9.9; 10-11.9; 12-13.9; 14-15.9; 16-17.9; and 18-20.
To represent these values in the maps, a progressive low-high range scale of 10 colours, creating a diverging low–mid–high colour gradient with blue and green shades representing the lowest values (equivalent, approximately, to 0–5), yellow the intermediate (>5–11), brown the high s (>11–15) and red the highest ones (>15–20) was used. Since uninhabited or sparsely populated areas with <0.1 inhabitants/km2 of land area were not coloured, they appeared blank, shaded in white colour.
Results
A total of 41 surveys from 9 countries (7 from Canada, 9 from the United States, 1 from Mexico, 8 from Argentina, 2 from Brazil, 5 from Colombia, 2 from Chile, 4 from Peru, 2 from Uruguay and 1 from Venezuela) were selected. As said before, the U.S. state-specific COPD prevalence data were downloaded from the CDC/BRFSS website (https://nccd.cdc.gov/cdi).
No data were available for Central America, nor for any of the following South American countries: Bolivia, Ecuador, Guyana, Paraguay and Suriname, and nor for any Caribbean islands, except the U.S. organised incorporated territories of Puerto Rico and Virgin Islands. The surveys selected for the present study and their results are shown in .
Table 1. List of studies used to compile the database of the Americas interpolation maps.
North America
Canada
A cross-sectional survey conducted in rural primary care of Eastern Ontario in 2006, using American Thoracic Society (ATS) spirometric diagnostic criteria (Citation10); another one of the international population-based Burden of Obstructive Lung Disease (BOLD) initiative performed in Vancouver in 2007 using global initiative for chronic obstructive lung disease (GOLD) spirometric criteria (Citation11), and a later population survey conducted in Montreal, Toronto, Halifax and Calgary in 2011 using GOLD/lower limit of normal (LLN) diagnostic criteria (Citation12) reported COPD prevalences of 17.4%, 19.3%, 19.1%, 14.6%, 12.9% and 16.8%, respectively.
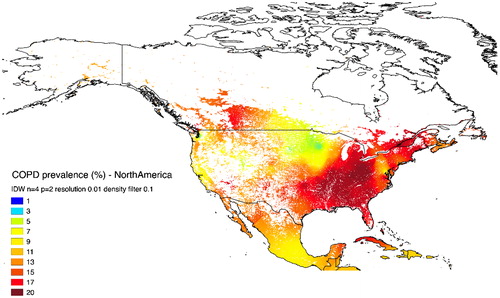
The IDW interpolation map () showed very high prevalences, represented by intense reddish colours, in the south of Quebec, Ontario and Alberta provinces, as well as in scattered areas of British Columbia. Yellowish and greenish colours, indicative of intermediate prevalence, appeared in the central regions of Southern Canada where the provinces of Saskatchewan and Manitoba are located. Notably, blank (white colour) areas predominated in the sparsely populated territories of northern Canada.
Figure 2. IDW interpolation map of COPD prevalence in North America. There is a high prevalence in the Southeast and Southwest regions of Canada, in the Great Lakes region, and in the lower Missouri, Ohio and Mississippi basins; the remaining regions, including Mexico, show intermediate prevalence, except for the sparsely populated areas of the Canadian and Alaska tundra, the southwestern United States and Northern Mexico desert.
United States
According to a recent cross-sectional survey based on data from NHANES 2007–2010, using GOLD/LLN criteria, the overall mean prevalence of COPD in the United States is 14.5% (Citation26), with marked differences between the 50 states that make up the American nation (http://www.cdc.gov/cdi).
The IDW interpolation map () showed very high prevalences (expressed by dark red shades) in West Virginia and Kentucky. High prevalences (brown and red shades) were shown in several states bordering the Great Lakes region, and the lower Missouri, Ohio and Mississippi basins, including (in alphabetic order): Alabama, Arkansas, Georgia, Indiana, Louisiana, Michigan, Mississippi, Missouri, Ohio, Oklahoma and Tennessee. Most of the remaining regions appeared shaded in yellows (i.e. intermediate prevalence). Of note, there were extensive regions of the West and the Southwest of the country in which blank areas predominated.
Mexico
A single cross-sectional survey conducted in Mexico City at the beginning of the 2000s, based on the GOLD post-bronchodilator FEV1/FVC <0.70 criteria, reported a COPD prevalence of 7.8% (Citation28).
According to this data and with the distribution of the Mexican population, the map () shows an intermediate prevalence in practically the whole country, except in the Northern sector (a continuation of the U.S. Desert Southwest with very low population density) where white predominates.
Central America and the Caribbean
No published data are available for Central America and the Caribbean Islands, with the exception of Puerto Rico and the Virgin Islands, whose respective prevalences are 6.6% and 2.8%, according to the CDC-BRFSS 2016 data (http://www.cdc.gov/cdi).
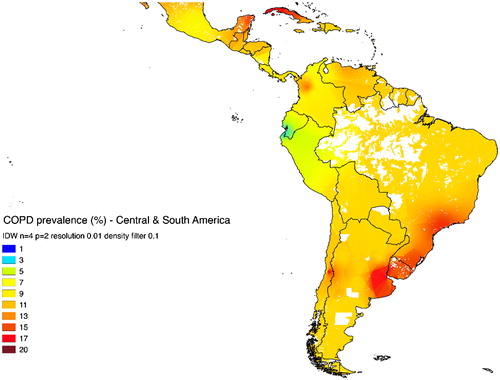
The lack of data in these regions has determined that the interpolation map has been generated automatically from the available data of Puerto Rico, Virgin Islands, and the neighbouring continental countries of North and South America. As shown in , practically all geographical areas of these regions are shaded in yellow tones, indicative of intermediate prevalence.
Figure 3. IDW interpolation map of COPD prevalence in Central America, Caribbean and South America. A very high prevalence appears in the Atlantic Ocean coastal regions of southeast Brazil, Uruguay and the Argentine Pampas. In general, most of the remaining regions of Central America, Caribbean and South America show intermediate/high COPD prevalence, except for the sparsely populated areas of the American basin and southern Patagonia.
South America
Argentina
Two recent cross-sectional surveys conducted in Cordoba, Gran Buenos Aires, Ciudad Autónoma de Buenos Aires, Rosario, La Plata and Mendoza, and in Marcos Paz and Bariloche during the 2014–2016 period, using spirometric criteria of the GOLD, reported values of COPD prevalence of 17.2%, 16.6%, 14.6%, 14.6%, 12.8%, 10.4%, 17.1% and 9.9%, respectively (Citation30,Citation31).
According to this data and the distribution of the Argentine population, the map () shows reddish colours (i.e. high prevalence) in the North-Eastern region of the Pampas, and brownish colours (of intermediate prevalence) in the rest of the country. Large areas of the Andean Altiplano and Patagonia appear white.
Brazil
A cross-sectional survey conducted in Pelotas in 2001 and another one in Sao Paulo in 2003, both cities located in the southeast of the country, provided a COPD crude prevalence, confirmed with GOLD criteria, of 15.8% and 15.2%, respectively (Citation28,Citation29).
The IDW map () shows reddish shades (indicative of high prevalences) in the southeast and south regions of the country. Extensive blank areas are in the Amazon Basin.
Colombia
A cross-sectional survey conducted in Barranquilla, Bogotá, Bucaramanga, Cali and Medellin (five Colombian cities located at low, medium and high altitude) in 2004 reported crude prevalences, confirmed by GOLD criteria, of 6.2%, 8.5%, 7.9%, 8.5%, and 13.5%, respectively (Citation32).
The interpolation map () shows a diffuse clear brownish-yellow shade, except for a relatively small area around the populous city of Medellin, shaded brownish-reddish, together indicative of intermediate/low COPD prevalence in the global country.
Chile
Two different cross-sectional surveys conducted in the cities of Temuco (southern Chile) in 2011–2013, and in Santiago de Chile (central valley) in 2003 found COPD prevalences, confirmed with GOLD criteria, of 6.4% and 16.9%, respectively (Citation28,Citation31).
The IDW map () shows brownish colours (intermediate prevalence) in practically the entire Chilean territory.
Peru
A longitudinal, population-based study conducted in 2010 to determine the prevalence of COPD, according to the GOLD criteria, across four disparate Peruvian regions, that included subjects from the populous city of Lima, the small metropolises of Tumbes and Puno, and a sample of a rural population of the Puno province found prevalences of 6.2%, 3.6%, 6.1%, and 9.9%, respectively (Citation33).
In the map (), the whole surface of the country appeared shaded by greenish and yellow shades, indicative of low prevalence.
Uruguay
Two different cross-sectional surveys conducted in the great metropolis of Montevideo in 2003, and in the small town of Barros Blancos in 2011–2012, reported prevalences, based on GOLD spirometric criteria, of 19.7% and 11%, respectively (Citation28,Citation31).
In the map (), a diffuse reddish colour, indicative of high prevalence, shaded the practical totality of the Uruguayan country.
Venezuela
A single cross-sectional survey carried out in Caracas (north of the country) in 2003, provided a crude rate of COPD, according to the GOLD spirometric criteria, of 12.1% (Citation28).
Mapping () showed brownish colours, indicative of intermediate/high prevalence, in practically the entire territory.
Other South American countries
As previously stated, there is no available data from Bolivia, Ecuador, Guyana, Paraguay and Suriname. Nevertheless, despite this lack these countries have taken values from the four closest points of the surrounding countries. So, Bolivia, Guyana, Suriname and most of the Paraguay surfaces appear shaded in yellow and brown tones, suggesting the existence of intermediate/high prevalences. The Ecuador surface shaded in greenish and yellowish tones that suggest the existence of a low prevalence of COPD in this country ().
Discussion
To graphically display the COPD prevalence throughout the Americas, an efficient method of proven utility, known as IDW multivariate interpolation, usually applied to various disciplines concerned with the Earth’s surface, such as cartography, geography, hydrology, climatology, agriculture, epidemiology, etc., but rarely used in Medicine, was used in order to generate coloured maps in which geographical areas are shaded in proportion to the COPD prevalence. IDW interpolation uses data points with known values to estimate other values at unknown locations, in order to create a raster surface consisting of an array of cells (pixels) arranged in rows and columns (or a grid) in which each cell contains a value representing some prevalence information, finally covering a whole area.
With this methodology, a visual perspective of the prevalence of COPD in the American continent, even in regions without real data, has been achieved for the first time. To make interpolation more ‘intelligent’ the prevalence data were filtered taken into account the population density distribution (calculated as the ratio of resident population divided by total land area) using a filtered area approach. The present methodology conducted the filtering and mapping in a single step, so that uninhabited or sparsely populated areas were excluded of visualisation, thus preventing visual biases related to the creation of continuous surfaces. In contrast to the abundance of surveys conducted in the United States, a striking shortage of them was found in South America, and there was a practically absolute lack of them in Central America and the Caribbean. For this reason, extensive regions of the American continent have been shaded by interpolation of values from neighbouring regions or countries.
Our mapping showed the existence of an intermediate or high prevalence in most of the inhabited regions, with only a few small scattered areas showing a low prevalence of the disease. The high prevalence of COPD found in the North-Eastern regions of North America and in several South American areas bordering the South Atlantic Ocean is similar to that existing in Central Europe, Denmark, and southeast of the Scandinavian Peninsula, Great Britain, and South-western Europe; as well as in South Africa, Northern and Central Asia, and Southeast Asian islands (author’s unpublished data). The rest of the American regions appeared shaded in yellowish tones indicative of intermediate prevalence. Finally, the sparsely populated areas of Antarctica, Northwest Alaska, Labrador Peninsula, the great North of Canada, the Amazon basins and their tributary rivers, some areas of the Andean Altiplano and Patagonia, and the North and South America deserts, appeared white.
Advances in statistical computation and graphic display have provided useful tools for visualisation of data unthinkable only a half century ago, and over the years advances in GIS have grown in parallel with those of other major technologies, such as computer mapping, programming, remote sensing, computer aided design, computer science, etc. (Citation5), and these technical advances already have practical application in Medicine. For example, by systematically mapping diseases in geographic spaces, the American CDCs have been able to identify with reasonable precision the distribution and spread of diseases, COPD included, across geographic regions (i.e. where are they found, how are they related to the environment or where do people go to seek health care) in order to enable the implementation of health intervention plans, and monitor their effectiveness (Citation34,Citation35).
The present study has been intended to be only a descriptive study to provide some visual information about distribution patterns of COPD but not causal linkages, in order to generating hypothesis on which further research may be based.
The numerical data of prevalence rates entered in the computer programme were obtained with the best available evidence in publicly accessible databases. However, the authors are aware that their analysis may have some limitations due to a number of confounding factors, whose critical analysis goes beyond the scope of this manuscript. Among them would be the potential biases related to the subjects’ selection; the unequal composition of the samples; the non-uniformity of the subjects’ age; the lack of proportionality between urban and rural samples; the different exposure of the subjects to environmental, labour or domestic pollutants; the realisation, interpretation, collection and storage of spirometry measurements, etc. Another limitation may be related to the differences in case definitions. The definition based on post-bronchodilator FEV1/FVC <0.70 was used in the large majority of the selected surveys (i.e. 82%), but this still does not address all possible sources of variation in case definition, since this fixed ratio criterion may potentially over-diagnose COPD in the elderly and it may under-diagnose COPD in younger patients (Citation2,Citation36,Citation37). In a Canadian study performed in primary care setting (Citation10), the ATS criteria were used for COPD diagnosis, and this may have produced some over-diagnosis biases in elderly subjects, especially of mild disease, since the ratio FEV1/FVC ratio falls with age. Besides, in another survey conducted in five Canadian cities (Citation12), both the ATS and the LLN criteria were used, and in the NHANES 2007–2010 survey (Citation26), the ATS/European Respiratory Society (ERS) diagnosis criteria were used; and while the ATS criteria may have produced COPD over-diagnose, the LLN may have produced under-diagnose biases in elderly patients.
On the other hand, apart from these possible methodological biases, several types of errors inherent in the GIS technique itself may have occurred. For example, IDW interpolation does not take into account the political boundaries that separate countries with different human societies, who may have different social customs, habits, languages, inbreeding, smoking, occupational and environmental pollutants exposure, different quality of public health services and unequal accessibility to care providers, and likely these peculiarities can modify the number and weight of risk factors, and finally the prevalence rate estimated for countries without available real data.
In addition, IDW interpolation has a mathematical precision that makes it exact, but this advantage can be a disadvantage if the actual data are erroneous or questionable. Therefore, since it works automatically creating new points from other supposedly accurate, it is crucial to obtain reliable data in the database and to carefully choose the size of the intervals of the numerical scales, so as not to distort the shades and provide erroneous results.
Of note, the abundance of data in the United States and Southern Canada has allowed to achieve a high-quality interpolation, producing a more expressive and accurate colouration than that of the remaining regions of the Americas. Nevertheless, although there is not an exact equivalence between the qualitative data provided by the colour scale and the numerical values obtained from selected studies, there is an approximate correlation between them that can allow interpreting mapping findings with reasonable certainty.
Therefore, in conclusion in spite of these possible biases it should be emphasised that GIS unquestionably offers a useful visual tool, which can help to call the attention of citizens and those responsible for public health about the high prevalence of this preventable and treatable disease, with the ultimate goal of decreasing the high global COPD burden in coming years.
Declaration of interest
Marc Miravitlles has received speaker fees from Boehringer Ingelheim, Chiesi, Cipla, Menarini, Rovi, Bial, CSL Behring, Grifols and Novartis, consulting fees from Boehringer Ingelheim, Chiesi, GlaxoSmithKline, Bial, Gebro Pharma, CSL Behring, Laboratorios Esteve, Mereo Biopharma, Verona Pharma, pH Pharma, Novartis and Grifols and research grants from GlaxoSmithKline and Grifols, all outside the submitted work
Additional information
Notes on contributors
Ignacio Blanco
All authors have contributed to the original idea, design of the study, selection of studies, analysis of data, drafting of the manuscript and reviewing, and approved the final version of the manuscript. IB, ID and MM are the guarantors of the paper.
Isidro Diego
All authors have contributed to the original idea, design of the study, selection of studies, analysis of data, drafting of the manuscript and reviewing, and approved the final version of the manuscript. IB, ID and MM are the guarantors of the paper.
Patricia Bueno
All authors have contributed to the original idea, design of the study, selection of studies, analysis of data, drafting of the manuscript and reviewing, and approved the final version of the manuscript. IB, ID and MM are the guarantors of the paper.
Eloy Fernández
All authors have contributed to the original idea, design of the study, selection of studies, analysis of data, drafting of the manuscript and reviewing, and approved the final version of the manuscript. IB, ID and MM are the guarantors of the paper.
Francisco Casas-Maldonado
All authors have contributed to the original idea, design of the study, selection of studies, analysis of data, drafting of the manuscript and reviewing, and approved the final version of the manuscript. IB, ID and MM are the guarantors of the paper.
Cristina Esquinas
All authors have contributed to the original idea, design of the study, selection of studies, analysis of data, drafting of the manuscript and reviewing, and approved the final version of the manuscript. IB, ID and MM are the guarantors of the paper.
Joan B. Soriano
All authors have contributed to the original idea, design of the study, selection of studies, analysis of data, drafting of the manuscript and reviewing, and approved the final version of the manuscript. IB, ID and MM are the guarantors of the paper.
Marc Miravitlles
All authors have contributed to the original idea, design of the study, selection of studies, analysis of data, drafting of the manuscript and reviewing, and approved the final version of the manuscript. IB, ID and MM are the guarantors of the paper.
References
- GBD 2015 Chronic Respiratory Disease Collaborators. Global, regional, and national deaths, prevalence, disability-adjusted life years, and years lived with disability for chronic obstructive pulmonary disease and asthma, 1990-2015: a systematic analysis for the Global Burden of Disease Study 2015. Lancet Respir Med. 2017;5:691–706.
- Adeloye D, Chua S, Lee C, Basquill C, Papana A, Theodoratou E, Nair H, Gasevic D, Sridhar D, Campbell H, et al. Global and regional estimates of COPD prevalence: Systematic review and meta-analysis. J Glob Health. 2015;5:020415.
- Shepard D. A two-dimensional interpolation functions for irregularly-spaced data. In: Proceedings of the 1968 23rd ACM national conference. ACM’68, 1968; 517–24. ACM, New York, NY, USA.
- Friendly M, Denis DJ. 2001. Milestones in the history of thematic cartography, statistical graphics, and data visualization. Web document, http://www.datavis.ca/milestones/. Accessed: September 22, 2018.
- Musa GJ, Chiang P-H, Sylk T, Bavley R, Keating W, Lakew B, Tsou H-Ch, Hoven CW. Use of GIS Mapping as a Public Health Tool—From Cholera to Cancer. Health Serv Insights. 2013:6 111–6.
- Blanco I, de Serres FJ, Cárcaba V, Lara B, Fernández-Bustillo E. Alpha-1 antitrypsin deficiency PI*Z and PI*S gene frequency distribution using on maps of the world by an Inverse Distance Weighting (IDW) multivariate interpolation method. Hepat Mon. 2012;12(10 HCC):e7434.
- Blanco I, Diego I, Bueno P, Fernández E, Casas-Maldonado F, Esquinas C, Soriano JB, Miravitlles M. Geographical distribution of COPD prevalence in Europe, estimated by an inverse distance weighting interpolation technique. Int J Chron Obstruct Pulmon Dis. 2017;13:57–67
- Blanco I, Bueno P, Diego I, Pérez-Holanda S, Lara B, Casas-Maldonado F, Esquinas C, Miravitlles M. Alpha-1 antitrypsin Pi*SZ genotype: estimated prevalence and number of SZ subjects worldwide. Int J Chron Obstruct Pulmon Dis. 2017;12:1683–1694.
- Blanco I, Bueno P, Diego I, Pérez-Holanda S, Casas-Maldonado F, Esquinas C, Miravitlles M. Alpha-1 antitrypsin Pi*Z gene frequency and Pi*ZZ genotype numbers worldwide: an update. Int J Chron Obstruct Pulmon Dis. 2017;12:561.
- Dales RE, Aaron SD, Vandemheen KL, Mehdizadeh A, Clinch J. The prevalence of airflow obstruction in rural primary care. Respir Med. 2006;100:754–9.
- Buist AS, McBurnie MA, Vollmer WM, Gillespie S, Burney P, Mannino DM, Menezes AM, Sullivan SD, Lee TA, Weiss KB, et al. International variation in the prevalence of COPD (The BOLD Study): a population–based prevalence study. Lancet. 2007;370:741–50.
- Tan WC, Bourbeau J, FitzGerald JM, Cowie R, Chapman K, Hernandez P, Buist SA, Sin DD. Can age and sex explain the variation in COPD rates across large urban cities? A population study in Canada. Int J Tuberc Lung Dis. 2011;15:1691–8.
- Al-Hazmi M, Wooldrage K, Anthonisen NR, Becklake MR, Bowie D, Chan-Yeung M, Dimich-Ward H, Ernst P, Manfreda J, Sears MR, et al.. Airflow obstruction in young adults in Canada. Can Respir J. 2007;14:221–7.
- Tan WC, Lo C, Jong A, Xing L, Fitzgerald MJ, Vollmer WM, Buist SA, Sin DD; Vancouver Burden of Obstructive Lung Disease (BOLD) Research Group. Marijuana and chronic obstructive lung disease: a population–based study. CMAJ. 2009;180:814–20.
- Hill K, Goldstein RS, Guyatt GH, Blouin M, Tan WC, Davis LL, Heels-Ansdell DM, Erak M, Bragaglia PJ, Tamari IE, et al. Prevalence and underdiagnosis of chronic obstructive pulmonary disease among patients at risk in primary care. CMAJ. 2010;182:673–8.
- Saad N, Sedeno M, Metz K, Bourbeau J. Early COPD Diagnosis in Family Medicine Practice: How to Implement Spirometry? Int J Family Med. 2014;2014:962901.
- Evans J, Chen Y, Camp PG, Bowie DM, McRae L. Estimating the prevalence of COPD in Canada: Reported diagnosis versus measured airflow obstruction. Health Rep. 2014;25:3–11.
- Mannino DM, Gagnon RC, Petty TL, Lydick E. Obstructive lung disease and low lung function in adults in the United States: data from the National Health and Nutrition Examination Survey, 1988-1994. Arch Intern Med. 2000;160:1683–9.
- Hnizdo E, Sullivan PA, Bang KM, Wagner G. Association between chronic obstructive pulmonary disease and employment by industry and occupation in the US population: a study of data from the Third National Health and Nutrition Examination Survey. Am J Epidemiol 2002;156:738–46.
- Celli BR, Halbert RJ, Isonaka S, Schau B. Population impact of different definitions of airway obstruction. Eur Respir J. 2003;22:268–73.
- Methvin JN, Mannino DM, Casey BR. COPD prevalence in southeastern Kentucky: the burden of lung disease study. Chest. 2009;135:102–107.
- Vaz Fragoso CA, Concato J, McAvay G, Van Ness PH, Rochester CL, Yaggi HK, Gill TM. The Ratio of FEV1 to FVC as a basis for establishing Chronic Obstructive Pulmonary Disease. Am J Respir Crit Care Med. 2010;181:446–51.
- Ford ES, Mannino DM, Wheaton AG, Giles WH, Presley–Cantrell L, Croft JB. Trends in the prevalence of obstructive and restrictive lung function among adults in the United States: findings from the national health and nutrition examination surveys from 1988–1994 to 2007–2010. Chest. 2013;143:1395–406.
- Tilert T, Dillon C, Paulose-Ram R, Hnizdo E, Doney B. Estimating the U.S. prevalence of chronic obstructive pulmonary disease using pre- and post-bronchodilator spirometry: the National Health and Nutrition Examination Survey (NHANES) 2007-2010. Respir Res. 2013;14:103.
- Diaz-Guzman E, Mannino DM. Epidemiology and prevalence of chronic obstructive pulmonary disease. Clin Chest Med. 2014;35:7–16.
- Doney B, Hnizdo E, Dillon CF, Paulose-Ram R, Tilert T, Wolz M, Beeckman-Wagner LA. Prevalence of Airflow Obstruction in U.S. Adults Aged 40-79 Years: NHANES Data 1988-1994 and 2007-2010. COPD. 2015;12:355–65.
- Laniado-Laborin R, Rendon A, Bauerle O. Chronic obstructive pulmonary disease case finding in Mexico in an at risk population. Int J Tuberc Lung Dis. 2011;15:818–23.
- Menezes AM, Perez-Padilla R, Jardim JR, Muiño A, Lopez MV, Valdivia G, Montes de Oca M, Talamo C, Hallal PC, Victora CG, et al. Chronic obstructive pulmonary disease in five Latin American cities (the PLATINO study): a prevalence study. Lancet. 2005;366:1875–81.
- Menezes A, Macedo SC, Gigante DP, da Costa JD, Olinto MT, Fiss E, Chatkin M, Hallal PC, Victora CG. Prevalence and risk factors for chronic obstructive pulmonary disease according to symptoms and spirometry. COPD. 2004;1:173–9.
- Echazarreta AL, Arias SJ, Del Olmo R, Giugno ER, Colodenco FD, Arce SC, Bossio JC, Armando G, Soriano JB; Grupo de estudio EPOC.AR. Prevalence of COPD in 6 Urban Clusters in Argentina: The EPOC.AR Study. [Article in English, Spanish] Arch Bronconeumol. 2018;54:260–9.
- Sobrino E, Irazola VE, Gutierrez L, Chen CS, Lanas F, Calandrelli M, Ponzo J, Mores N, Serón P, Lee A, et al. Estimating prevalence of chronic obstructive pulmonary disease in the Southern Cone of Latin America: how different spirometric criteria may affect disease burden and health policies. BMC Pulm Med. 2017;17:187.
- Caballero A, Torres-Duque CA, Jaramillo C, Bolívar F, Sanabria F, Osorio P, Orduz C, Guevara DP, Maldonado D. Prevalence of COPD in five Colombian cities situated at low, medium, and high altitude (PREPOCOL study). Chest. 2008;133:343–9.
- Jaganath D, Miranda JJ, Gilman RH, Wise RA, Diette GB, Miele CH, Bernabe-Ortiz A, Checkley W; CRONICAS Cohort Study Group. Prevalence of chronic obstructive pulmonary disease and variation in risk factors across four geographically diverse resource-limited settings in Peru. Respir Res. 2015;16:40.
- Croft JB, Lu H, Zhang X, Holt JB. Geographic Accessibility of Pulmonologists for Adults with COPD: United States, 2013. Chest. 2016;150:544–53.
- Croft JB, Wheaton AG, Liu Y, Xu F, Lu H, Matthews KA, Cunningham TJ, Wang Y, Holt JB. Urban-rural county and state differences in chronic obstructive pulmonary disease - United States, 2015. MMWR Morb Mortal Wkly Rep. 2018;67:205–11.
- Bakke PS, Rönmark E, Eagan T, Pistelli F, Annesi-Maesano I, Maly M, Meren M, Vermeire Dagger P, Vestbo J, Viegi G, et al. Recommendations for epidemiological studies on COPD. Eur Respir J. 2011;38:1261–77.
- García-Río F, Soriano JB, Miravitlles M, Muñoz L, Duran-Tauleria E, Sánchez G, Sobradillo V, Ancochea J. Overdiagnosing subjects with COPD using the 0.7 fixed ratio: correlation with a poor health-related quality of life. Chest 2011; 139: 1072–1080.