
 ?Mathematical formulae have been encoded as MathML and are displayed in this HTML version using MathJax in order to improve their display. Uncheck the box to turn MathJax off. This feature requires Javascript. Click on a formula to zoom.
ABSTRACT
To enhance the air-cooling process in geothermal power plants for economical utilization of the exhaust steam from expansion, a natural-draft thermal chimney design was proposed and studied here in this paper. In view of the necessity of accurate velocity field measurements which would provide further insight into the physics behind the evolving plumes above heated horizontal cylinders, Particle Image Velocimetry (PIV) was employed to experimentally investigate the buoyant flow in the thermal chimney system. Two configurations have been tested to understand the flow induced by the horizontally heated cylinders inside the thermal chimney. Firstly, flow field above a single row of cylinders was tested while they were isothermally heated to simulate of an air-cooled condenser. After that, a second row of cylindrical heaters (air-heater) was added above the first row to enhance the buoyant flow, aiming at enhancing the air side flow of the air-cooled condenser. Flow characteristics and velocity enhancement were studied for both configurations. The results show that significant flow unsteadiness occur near the cylindrical heaters because of the non-steady crossing flows between adjacent cylinders, and the unsteadiness attenuates in the downstream. The effects of cylinder row distance, surface temperature as well as downstream distance on the flow field were then analyzed. Flow velocity is increased by the air-heater as the buoyancy force is enhanced, proving the idea of flow enhancement of the thermal chimney configuration. It is also observed that the velocity fluctuation, turbulent kinetic energy and vorticity change significantly after adding the second row of heaters. The present study provides further insight into natural convection flow theory of heated cylinders for a Rayleigh number range of 1.3E4 to 2.2E4, which is fundamental for the flow enhancement designing of the proposed natural-convection-driven cooling system.
1. Introduction
To utilize renewable energies to aid the air flow and enhance the natural draft air-cooling, the thermal chimney concept is verified to be an economic and environment-friendly cooling solution in many fields (Sun, Zhiqiang, and Kamel Citation2017; Zhai, Song, and Wang Citation2011; Zou et al. Citation2012). A typical thermal chimney application is solar chimney that utilizes solar energy for air draft enhancement, passive ventilation, air conditioning, power generation, and enhancement of cooling tower in thermal power plants (Abdallah et al. Citation2014; Lal, Kaushik, and Bhargav Citation2013; Park and Francine Citation2015). And some other thermal chimneys were applied to remove residual heat in thermal power systems (Zhao et al. Citation2015). The buoyancy-driven natural convection is the fundamental working principle shared by thermal chimneys.
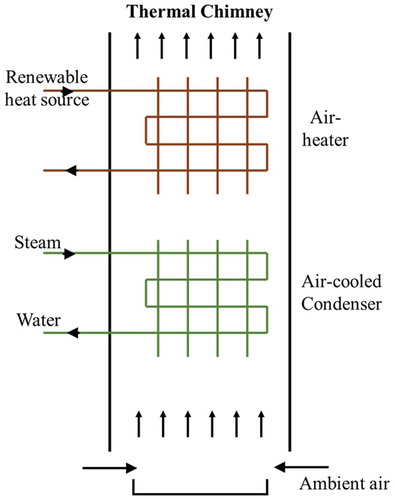
In this paper, the thermal chimney concept is introduced to develop a thermally driven air-cooled condenser for a geothermal power plant. In doing so, electrical fans can be eliminated from the condensers, which is very attractive for areas when the availability of electricity is limited (Chen et al. Citation2016). As shown in , a stream of hot geothermal water goes through air heater to create the thermal chimney effect (i.e., an upward buoyant flow) to enhance the air-cooled condensation of the steam of the power plant. Before building a real-size facility for a specific geothermal plant, the concept needs validation in lab scale by looking into the flow phenomenon and heat transfer performance.
Figure 1. Geothermal application of thermal chimney
Natural convection studies of horizontal cylinders have been conducted since the 1920s. Since Nusselt in 1915 proposed the Nusselt number concerning natural convection heat transfer from a single horizontal cylinder, numerous heat transfer studies of horizontal cylinders have been conducted experimentally, numerically and analytically. It can be concluded from the large amount of literature that in addition to the local heat transfer of the cylinders, researchers have recognized the necessity of accurate velocity field measurements which would provide further insight into the physics behind the evolving plumes above heated horizontal cylinders (Churchill and Humbert Citation1975; Morgan Citation1975).
Thermal plumes above a single horizontal-heated source have attracted a certain amount of attention in the past in order to clarify transitional and turbulent phenomena by measuring the onset and end of transition (Kimura and Adrian Citation1983; Noto Citation1989; Noto, Kenji, and Tsuyoshi Citation1999). Noto (Citation1989) conducted experiments on a line heat source in unstratified air by flow visualization and temperature measurement methods. They observed and provided the spectra and critical Grashof number for the turbulent transition. More recently, pairs and arrays of cylinders with different alignments have been more comprehensively discussed. Stafford and Vanessa (Citation2014) examined a pair of isothermal-heated cylinders in air with both horizontal and vertical alignments. Numerical and experimental approaches were used to assess cylinder interactions in the laminar flow regime . The optimal horizontally aligned configuration was found when the separation distance resulted in merging of the thermal boundary layers of adjacent cylinders. Kitamura et al. (Citation2016) investigated natural convective flow around a vertical row of heated horizontal cylinders through smoke visualization. Vertical gaps between cylinders were tested with results indicating that the plumes arising from the upstream cylinders remain laminar throughout the rows when the gaps between cylinders are small, while when the gaps are larger than a certain value, the plumes begin to sway and undergo turbulent transition on the halfway of the rows. As an advanced method for the buoyancy flow field measurements, use of particle image velocimetry (PIV) has attracted attention. Park, Jungsoo, and Sung (Citation2019) experimentally investigated natural convective flows in a water pool above a single horizontally inserted heater rod. The mean velocity fields obtained through PIV reveal the typical natural convective flows, large-scale circulation, and a vertical thermal plume. Kuehner, Hamed, and Mitchell (Citation2015) experimentally investigated free convection water flow around a heated horizontal cylinder for a Rayleigh number of 1.33 ×
and a Prandtl number of 5.98. It is reported that the time-series-averaged and ensemble-averaged velocity data obtained by PIV within the approach flow, boundary layer, and plume formation region of the free convection flow around the cylinder submerged in water provide new and important insights into the flow features that govern the heat transfer.
Grafsrønningen, Atle, and Anders (Citation2011), Grafsrønningen and Atle (Citation2012a) have conducted a series of experimental and numerical studies focusing on buoyant plumes forming above heated horizontal cylinders. Results from PIV investigation of the velocity fields above an evenly heated horizontal cylinder with a Rayleigh number ranging from 2.05 to 7.94
were presented (Grafsrønningen, Atle, and Anders Citation2011). The results indicated that the flow is initially laminar around the cylinder and then undergoes a transition to turbulent flow a distance above the cylinder. The point where transition from laminar to turbulent flow initiates travels upstream toward the cylinder for increasing Rayleigh number. Following the above, results from a simultaneous laser-induced fluorescence (LIF) and PIV investigation of the temperature and velocity fields above an evenly heated horizontal cylinder with a Rayleigh number of 9.4
was then presented (Grafsrønningen and Atle Citation2012b). Velocity distribution, velocity fluctuations, production of turbulent kinetic energy, temperature variance, and velocity-temperature correlations were computed and evaluated. In another experimental investigation conducted on two evenly heated vertically arranged horizontal cylinders (Grafsrønningen and Atle Citation2012a), the change in Nusselt number on the upper cylinder compared to a single cylinder was presented for different Rayleigh numbers. Comparison of the buoyant plume showed that the flow characteristics change considerably as the plume of the two-cylinder case is significantly wider and the velocity fluctuations and TKE above the second cylinder is larger than above a single cylinder. Far downstream the plume above the second cylinder approaches a Gaussian profile associated with turbulent planar plumes.
In the present work, the thermal chimney concept is introduced for air-cooled condensation. The thermal chimney consists of two levels of heat exchanging elements, the lower level is designed to simulate the condensation elements while the upper level, which simulates the elements heated by geothermal source water, is designed for air-draft enhancement. To evaluate the thermal chimney performance, investigations of flow field above cylindrical heating elements and in particular about how the buoyancy plumes develop above cylinders should be initially conducted. However, as summarized from the literature review, the number of relevant studies is still limited. By developing the lab-scaled model and conducting experimental analysis in this work, the designing feasibility, flow physics as well as the trade-off between the thermal chimney effect and the extra flow resistance caused by the upper row heating elements is expected to be implicated.
2. Experiment setup
A thermal chimney model with rectangular cross-section of constant area was designed and fabricated, as shown in . CFD modeling and simulation has been conducted (Wenguang et al Citation2020) to provide design instructions. The chimney is composed of four 5 mm thick transparent acrylic sheets and supported by frames made of aluminum. There are 2 sets of holes drilled in the front and back pair of sheets to install one/two rows of cylindrical cartridge heaters with 16 mm diameter (D) and 200 mm length. Each cartridge heater was manufactured with a built-in OMEGA type K thermocouple. The thermocouple is embedded at the inner surface of the cartridge sheath. The lower row and upper row of heaters are connected to two sets of OMEGATM PID (proportional integral derivative) controllers with solid state relays. The lower PID set controls the lower row with the constant surface temperature of 100°C to simulate the outside surface of steam condensation tubes. The upper PID set adjusts the upper row surface temperature to the set-point during experiment. The Rayleigh number range of the experiments is from 1.3E4 to 2.2E4 under these configurations. The horizontal heaters of two rows are both evenly distributed with the optimal center-to-center distance 1.75D, which was determined based on 2D CFD heat transfer simulations in (Ma, Li, and Sham Citation2019). The other dimensions of the test rig are indicated in the figure.
Figure 2. Diagram of PIV experiment setup
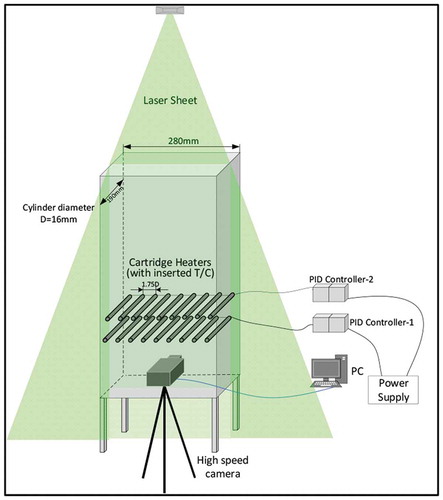
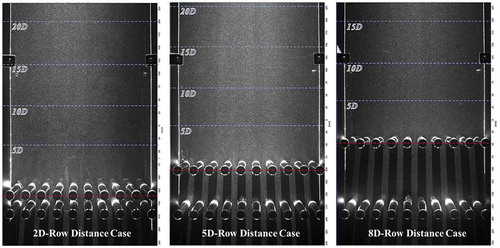
The lab-scaled thermal chimney is tested in an isolated test section equipped with a PIV system. PIV measurements are taken in the mid-span plane across the heaters in the chimney as shown in . The flow field inside the chimney is illuminated by the PIV laser and the field of view is captured by a high-speed camera. The seeding was provided by a smoke generator that provided a fine mist with nominal particle diameter of 0.2 µm. Three photographs with seeding and laser illumination of three arrangements of cylinders are displayed in . The PIV laser light sheet was directed from above to cover the mid-span plane of the chimney using a Litron dual cavity, Nd: YAG laser capable of 100 mJ pulses of 8 ns duration at a maximum repetition rate of 200 Hz. The time delay between image pairs was set to 0.5 ~ 2.2 ms according to different heater temperatures and velocity magnitudes within the chimney to appropriate resolve the velocity. The relationship between the chimney model coordinate system and camera coordinate system was obtained through calibration before experiments. A 4 M pixel Phantom v341 camera digital video camera was used for PIV image recording, and 600 image pairs at a rate of 200 Hz over 3 seconds were taken for each experimental configuration. Post processing of the raw PIV images was completed using LaVision Davis 8 and MATLAB. A multi-pass image correlation algorithm with sub-pixel interpolation was used to compute the velocity vectors, with a final interrogation window of 16 × 16 pixels and a 50% overlap factor.
Figure 3. PIV laser illuminating and seeding photos
Given the above facilities and conditions, the experiment operation began with the laser sheet setup including the sheet width and thickness adjustment. The second step is the position adjustment of the laser sheet in order to guide the sheet plane to the middle span of the thermal chimney model. As the laser sheet is set, set up the cartridge heaters and PID controllers to required testing conditions. As the heaters’ temperature is stable, seed the whole isolated testing space where the thermal chimney is located. Correctly align and focus the high-speed camera and then set the laser inter-pulse time delay. Before recording, capture sample images and then place calibration graticule into same position as the laser sheet to do the image calibration. The formal experimental recording thus began with the above illustrated image capturing amount and frequency.
The uncertainty of this experimental work is mainly decided by the PIV accuracy. As shown above, two configurations have been tested including a single-row case and a double-row case where the upper row is set as air heater to enhance the air flow. In the first case, the uncertainty of the velocity measurement was estimated to be ϵ = 0.1/M/∆t = 0.008 m/s where M (=5.5 pixels/mm) represents the image magnification factor and ∆t (=2.2 s) denotes the laser pulse delay. The uncertainty of the velocity measurement in double-row cases was estimated to be ϵ = 0.011 ~ 0.014 m/s where the image magnification factor M is 5.2 pixels/mm and the laser pulse delay ∆t was set to be 1.8s~1.4s.
3. Results and discussions
3.1. Single-row configuration
To set a baseline, the single-row cylinder configuration is firstly investigated to simulate the air-side flow of a natural draft condenser. To validate the velocity profile, 3D CFD research was conducted and it was confirmed that the errors in the mean velocity between PIV and CFD at targeted nominal temperatures are in a range of (−15-+20)% (Li et al. Citation2020). The averaged local velocity with a cylinder temperature of 100°C is shown as . In order to investigate the flow characteristics along the downstream distance, four evenly distributed distances from near to far from the cylinder center line 5D, 10D, 15D and 20D are studied and velocity magnitude is extracted at those locations as shown in ).
Figure 4. Averaged local velocity magnitude above single-row cylinders of 100°C including (a) PIV map – velocity magnitude contours and velocity vectors (b) data of |V| extracted at several distances from the heaters
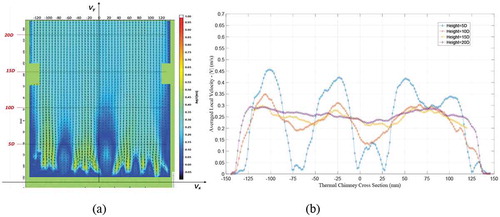
As the buoyancy-driven air flows across the cylinder bank, jet flows are formed with higher velocity and local Re number between cylinders due to sudden cross-section change. Recirculation regions are formed above each cylinder due to the shear motion between the jet flows and cylinder-top regions. However, the cylinder-top recirculation is not formed homogeneously across the heater rack. As the jet flows cluster in different patterns near the cylinders, larger recirculation is formed between clusters while smaller scale circulation is formed above the remaining cylinders. The jet flows and the recirculation regions characterize the flow regime near the cylinders with large undulations and high unsteadiness. ) shows the local velocity magnitude (|V|) profiles above the heated cylinders at various individual heights. The local velocity at the downstream distance of 5D varies between 0 m/s and 0.45 m/s. The large undulation is mainly caused by the vertical velocity (Vy) component, which varies between −0.10 m/s and 0.45 m/s as the velocity is extracted from both the plumes and the recirculation, while the horizontal velocity (Vx) component only varies between ±0.03 m/s. Reverse vertical velocities occur at the sidewall and the two large recirculation regions, resulting in sharp turns of local velocity within −75 to -65 mm, 0 to 25 mm and 125 to 140 mm regions of the cross section, as shown in ). Velocity peaks occur above the clustered flows where the flow is enhanced. However, the mechanism of the clustering and recirculation phenomenon in terms of its periodicity and development is not fully obtained here under the current PIV laser frequency setting. The current PIV settings enable it to capture 600 image pairs every 3s, while it’s observed that the natural convection flow motion in this configuration has a much slower varying pattern and longer shifting period, which is also observed by ongoing CFD transient simulations. Though similar researches can also be referred to (Grafsrønningen, Atle, and Anders Citation2011; Kuehner et al. Citation2012; Lin, Yashraj, and Cun-Y Citation2017), there’s no research found yet regarding the current configuration to make an estimation about the clustering and recirculation frequency. Therefore, the current work is mainly focusing on the average velocity field in the downstream to reveal the flow enhancement of the whole structure instead of focusing on the transient recirculation in the near cylinder area.
To further support the above consideration, the undulation is observed to decrease greatly downstream the flow, as the effect of flow clustering and recirculation is weakened. At the distance of 10D above the cylinders, the undulation decreases to a range of 0.02 m/s ~ 0.35 m/s, though the undulation pattern is still similar to that of 5D since they are caused by the same recirculation and clusters. As the flow develops further downstream, the velocity becomes more evenly distributed. It should be noted that the average velocity of each cross-section doesn’t change much with downstream distance. The maximum velocity variation from 5D to 20D height is only 0.025 m/s, which reflects the slight variation of the air density caused by temperature difference. It’s more clearly revealed by the velocity comparison of 15D and 20D height that instead of dissipating, the velocity stays at a relative stable and even slightly increased level, indicating that the buoyancy force works continuously in the field. It should also be noted that the boundary layer thickness along both sidewalls becomes thinner further downstream, as the unsteady flows mix and develop further.
As the sum of the variance of the horizontal and vertical velocity, the turbulent kinetic energy (where
and
are the RMS of the horizontal and vertical velocity components respectively) is an indicator of the fluctuation of both velocity components. TKE of four downstream heights under the same cylinder temperature (100°C) condition is shown as .
Figure 5. Turbulent kinetic energy at different downstream distance above single-row cylinders of 100°C
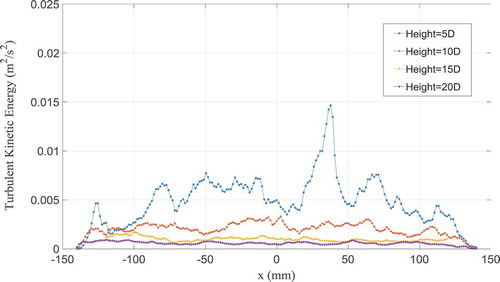
Similar to the velocity trend shown in , the near cylinder flow shows much larger velocity fluctuation and TKE due to stronger unsteadiness than the further region. The TKE decreases remarkably from 5D to 20D height above the cylinder center and also the undulation of each height becomes less severe. Velocity fluctuations at 15D and 20D heights nearly decrease to zero, meaning that the flow is nearly laminar. As it comes closer to the distance of 5D above the heated cylinders, both x- and y- fluctuation components show great undulations across the cross-section, thus so does the TKE. The TKE shown in is mostly between 0 and 0.075 m2/s2 except in the fairly high fluctuation region where it reaches up to 0.015 m2/s2. By referring to the velocity map in , the highest fluctuation is observed to occur at the edge of the biggest recirculation where the velocity is understood to be the least steady.
3.2. Double-row configuration
The flow enhancement was studied by adding the upper-row cylinders above the original single-row to build the thermal chimney effect. In order to fully investigate the competing result of the two effects- the air draft enhancement and extra flow resistance (pressure drop) added by the upper-row heaters, three row distances were considered-2D, 5D and 8D for parametric sensitivity analysis. The temperature of the upper row (Tuc) is adjusted from 60°C to 140°C while the lower row (Tlc) is kept at 100°C. comprehensively covers the averaged air velocity information above the double-row cylinders with different upper row heating, row distances as well as downstream distances.
Figure 6. Averaged air velocity (|V|) above double-row cylinders as the upper row heated to (a)~(c)60°C~140°C with row distance of 2D (d)~(f) 60°C~140°C with row distance of 5D (g)~(i) 140°Cwith row distance of 8D
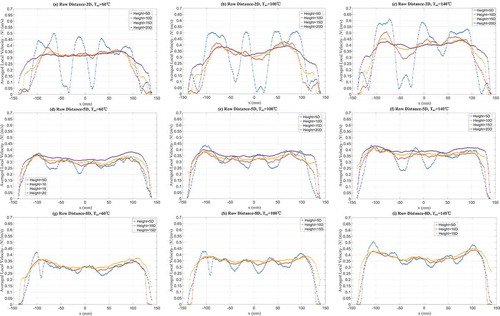
Firstly, the velocity fields of the 2D case (–c)) resemble closely the velocity fields of the single-row configuration shown in . The shear motion between jet flows and cylinder-top regions is still strong enough to form large recirculation between flow clusters, leading to large undulation and unsteadiness of the flow near the upper-row cylinders. At the downstream distance of 5D, the local velocity magnitude (|V|) changes drastically between 0 ~ 0.50 m/s, 0 ~ 0.51 m/s and 0 ~ 0.61 m/s, respectively, for the three upper-row temperature – 60°C, 100°C and 140°C. Comparing the results with single-row data in , the undulation is intensified by 11.1%~35.6%. As the flow develops further downstream to 10D, 15D, and 20D, the velocity becomes gradually more evenly distributed. It should also be noted that, the average velocity of downstream keeps increasing from the height of 10D to 20D as the buoyancy force continuously works on the field and acceleration is thus caused. However, the air flow shows a reduced average velocity from 5D height to 10D since the jet flow effects is stronger.
Velocity comparison under three upper-row temperature conditions is revealed by –c) combined with data listed in . Generally, higher upper-row temperature leads to stronger undulation and bigger velocity since the buoyancy force is enhanced by bigger temperature difference between cylinders and ambient air. As the upper-row cylinders were heated from 60°C to 100°C, the averaged velocity of each individual height can be increased by up to 10.2%, and Ra number is increased from to
A further maximal increment of 26.2% can be reached if the upper-row cylinders were further heated to 140°C while the Ra number reaches
Table 1. Averaged air velocity above double-row cylinders (m/s)
Secondly, as the row separation distance of cylinders was increased to 5D, as shown in –f), the overall undulation of flow field above the upper-row cylinders is significantly weakened at each temperature. As the PIV velocity map shows, the air flow that passes the lower row of cylinders is further distributed by the upper row to a more even pattern. Maximum undulations at the 5D height are ~0.37 m/s, ~0.43 m/s and ~0.44 m/s, respectively, under three upper-row temperatures – 60°C, 100°C and 140°C, indicating a much steadier cross-section flow. In comparison with corresponding 2D case results shown in , the increased row separation distance causes average velocity increment of varied extent from 0.2% to 16.0%. Looking at the configuration with row distance of 5D only, on the one hand, the downstream velocity keeps increasing from the height of 5D to 20D under each temperature condition as the buoyance force continuously works. On the other hand, higher upper-row temperature also leads to bigger velocity since the buoyancy force is enhanced by bigger temperature difference.
Thirdly, as the row distance of cylinders was further enlarged to 8D, as shown in (g–i), the overall unsteadiness of flow field is further weakened slightly, meaning that the inlet air flow is further distributed by the upper row to a more even pattern than that in the 5D row-distance case. It should be pointed out that only three downstream distances from 5D to 15D are studied here since the 20D is out of the range of the thermal chimney height. Comparing to corresponding results of the 5D case shown in , the increased row distance causes further average velocity increment of varied extent from 0.1% to 11.80%. Similar to the 2D and 5D row-distance cases described above, the average velocity gets bigger with higher upper-row temperature as well as further downstream distances.
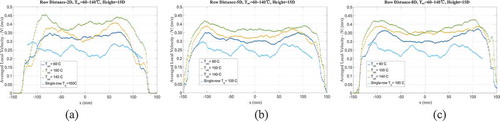
To better illustrate the velocity variation of three double-row configurations compared to the single-row cylinders case, is plotted and data of a fixed downstream distance, 15D, is picked out from all cases. As is clearly shown, all three double-row configurations can improve the local air velocity (|V|) by varied extent. The phenomenon that higher upper-row temperature leads to bigger velocity is obviously displayed in the three sub-figures. It should be noted that, though there exists a slightly increasing trend of the average velocity at each specific height when the row distance increasing from 2D to 8D as listed in , it is not easily observed from (a–c) as the undulation resembles each other.
Figure 7. Comparison of averaged air velocity above double-row and single-row cylinders
comprehensively covers the TKE information above the double-row cylinders with different upper row heating, row distances as well as downstream distances through nine sub-figures. Moreover, lists out the average TKE of each individual height above the upper row under corresponding conditions in .
Table 2. TKE above double-row cylinders (1e-3) (m2/s2)
Figure 8. Turbulent kinetic energy (TKE) above double-row cylinders as the upper row heated to (a)~(c)60°C~140°C with row distance of 2D (d)~(f) 60°C~140°C with row distance of 5D (g)~(i) 140°Cwith row distance of 8D
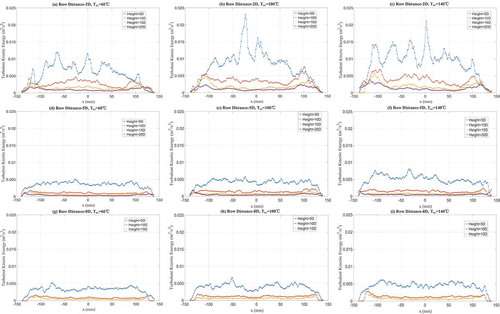
The TKE fields of the 2D row-distance case of (a–c) resemble closer the TKE of the single-row configuration shown in . The clustered jet flow and recirculation near cylinders characterize the area with big velocity fluctuation. By referring to the velocity maps in , the high fluctuation peaks of each case are observed to occur in the edges of the big recirculation. As the flow develops further downstream of 10D, the average TKE is reduced more than half. More laminar flow features occur as it develops further downstream to 15D and 20D with lower TKE. Besides, it’s also observed that higher cylinder temperature leads to bigger TKE by looking at each individual downstream distance. As the upper-row cylinders were heated from 60°C to 100°C, the averaged TKE at each distance can be increased by up to 40.4%, and a further maximal increment of 27.2% can be reached if the upper-row cylinders were further heated to 140°C. It’s easy to be understood that as the flow velocity keeps increasing and the Ra increases from 1.27to 2.2
, the natural convection flow only becomes less steady.
For the 5D row-distance case in (d–f) and the 8D case in (g–i), the overall TKE of flow field above the upper-row cylinders is obviously reduced under each temperature since the flow unsteadiness is significantly weakened, especially in the region close to the cylinders. As the PIV velocity maps in reveal, the inlet air flow behind the lower row cylinders is further distributed by the upper row to a more even pattern. Looking at the 5D height above the upper cylinders only, maximum TKE undulation of the 5D row-distance case are ~5E-3 m2/s2, ~6E-3 m2/s2and ~8E-3 m2/s2 respectively for the three upper-row temperature – 60°C, 100°C and 140°C, and ~5E-3 m2/s2, ~7E-3 m2/s2and ~7E-3 m2/s2 respectively for the 8D row-distance case. Comparing to corresponding results of row distance of 2D shown in , the enlarged row distance causes average TKE decrement of varied extent of 38.6%~63.9% for the 5D row-distance case and a further decrement of 0.5%~17.4% for the 8D row-distance case.
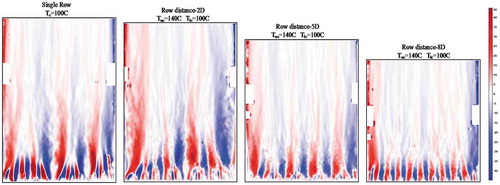
The two-dimensional vorticity in xy-plane of four typical cases are displayed in , including the single-row case with Tc = 100°C, and three double-row cases with same cylinder temperature (Tuc = 140°C, Tlc = 100°C). The 2D-row distance case shows similar vorticity distribution to the single-row case, i.e. higher positive and negative vorticity pairs are observed in the big swirling areas. Besides, it’s observed that the wall-side regions with intense vorticity of the 2D-row distance case are thicker than those of the single-row case. It’s understood that more shear motion is taking place in the former case. The vorticity distribution gets more even as the row distance increases. A common observation is that the absolute vorticity mainly exists in near cylinder areas and attenuates along the downstream flow.
Figure 9. Vorticity field above double-row and single-row cylinders
4. Conclusions
A natural-draft thermal chimney design was proposed to enhance the air-cooling process in geothermal power plants for better utilization of the exhaust steam from expansion. In order to gain insight into the mechanism of the buoyant flow field, a lab-scale thermal chimney model was built by inserting rows of horizontal-heated cylinders to simulate both the air-cooled condenser a field boost air-heater. Particle Image Velocimetry (PIV) was employed in the experiments and characteristics of the velocity and its fluctuation caused by buoyant force are discussed.
The buoyancy enhancement caused by added air-heater enhances the averaged flow velocity, indicating that the extra draft force outweighs the added flow resistance, which proves the proposed concept is feasible.
The effect of cylinder surface temperature on the natural draft performance and the flow field was also studied. Higher velocity is achieved as the buoyancy force is enhanced by bigger temperature difference. The turbulent kinetic energy is increased remarkably and different undulation pattern is revealed under each temperature.
Significant flow unsteadiness is observed downstream near the cylinders because of the non-steady crossing flows between adjacent cylinders in the single-row case and the double row case with distance of 2D. The jet flows and recirculation characterize the flow regime near the cylinder with large undulation. The unsteadiness decreases greatly further downstream in the flow and more laminar feature is observed as the turbulent kinetic energy decreases markedly to near zero.
As the row distance of cylinders was enlarged, the average velocity increased by varied extent. The overall unsteadiness of flow field above the upper-row cylinders is significantly weakened since the inlet air flow after the lower row cylinders is further distributed by the upper row to a more even pattern. Therefore, the enlarged row distance leads to higher average velocity, lower TKE as well as weaker vorticity.
Nomenclatures
Table
Conflicts of interest/competing interests
No conflicts of interest/competing interests.
Acknowledgments
This research work is funded by EPSRC (EP/P028829/1) in United Kingdom. This work was conducted with equipment provided by the EPSRC National Wind Tunnel Facility, grant number EP/L024888/1. We also thank our former and present project partners Dr Weihong Li from The Hong Kong University of Science and Technology, Dr Haiteng Ma from the Shanghai Jiao Tong University, Dr Wenguang Li from the University of Glasgow, and Prof. Li He from the University of Oxford for providing insight and expertise that greatly assisted the research.
Additional information
Funding
References
- Abdallah, A., H. Yoshino, G. Tomonobu, E. Napoleon, M. Magdy, and M. Abdelsamei. 2014. Parametric investigation of solar chimney with new cooling tower integrated in a single room for New Assiut city, Egypt climate. International Journal of Energy and Environmental Engineering 5 (2):92. doi:10.1007/s40095-014-0092-6.
- Chen, L., Y. Lijun, D. Xiaoze, and Y. Yongping. 2016. A novel layout of air-cooled condensers to improve thermo-flow performances. Applied Energy 165:244–59. doi:10.1016/j.apenergy.2015.11.062.
- Churchill, S. W., and H. Humbert. 1975. Correlating equations for laminar and turbulent free convection from a horizontal cylinder. International Journal of Heat and Mass Transfer 18 (9):1049–53. doi:10.1016/0017-9310(75)90222-7.
- Grafsrønningen, S., and J. Atle. 2012a. Natural convection heat transfer from two horizontal cylinders at high Rayleigh numbers. International Journal of Heat and Mass Transfer 55 (21):5552–64. doi:10.1016/j.ijheatmasstransfer.2012.05.033.
- Grafsrønningen, S., and J. Atle. 2012b. Simultaneous PIV/LIF measurements of a transitional buoyant plume above a horizontal cylinder. International Journal of Heat and Mass Transfer 55 (15):4195–206. doi:10.1016/j.ijheatmasstransfer.2012.03.060.
- Grafsrønningen, S., J. Atle, and B. Anders. 2011. PIV investigation of buoyant plume from natural convection heat transfer above a horizontal heated cylinder. International Journal of Heat and Mass Transfer 54 (23):4975–87. doi:10.1016/j.ijheatmasstransfer.2011.07.011.
- Kimura, S., and B. Adrian. 1983. Mechanism for transition to turbulence in buoyant plume flow. International Journal of Heat and Mass Transfer 26 (10):1515–32. doi:10.1016/S0017-9310(83)80051-9.
- Kitamura, K., A. Mitsuishi, T. Suzuki, and F. Kimura. 2016. Fluid flow and heat transfer of natural convection induced around a vertical row of heated horizontal cylinders. International Journal of Heat and Mass Transfer 92:414–29. doi:10.1016/j.ijheatmasstransfer.2015.08.086.
- Kuehner, J. P., A. M. Hamed, and J. D. Mitchell. 2015. Experimental investigation of the free convection velocity boundary layer and plume formation region for a heated horizontal cylinder. International Journal of Heat and Mass Transfer 82:78–97. doi:10.1016/j.ijheatmasstransfer.2014.10.055.
- Kuehner, J. P., R. John, F. Andrew Tessier, A. M. Hamed, J. Franco, and M. Moiso. 2012. Velocity measurements in the free csonvection flow above a heated horizontal cylinder. International Journal of Heat and Mass Transfer 55 (17):4711–23. doi:10.1016/j.ijheatmasstransfer.2012.04.031.
- Lal, S., S. C. Kaushik, and P. K. Bhargav. 2013. Solar chimney: A sustainable approach for ventilation and building apace conditioning. International Journal of Development and Sustainability 2 (1):277–97.
- Li, W., G. Yu, D. Zagaglia, R. Green, and Z. Yu. 2020. CFD modelling of a thermal chimney for air-cooled condenser. Geothermics 88:101908. doi:10.1016/j.geothermics.2020.101908.
- Lin, K. C., B. Yashraj, and Z. H. Cun-Y. 2017. “3D-CFD investigation into free convection flow above a heated horizontal cylinder. Comparisons with Experimental Data.” Applied Thermal Engineering 120:277–88. doi:10.1016/j.applthermaleng.2017.03.039.
- Ma, H., H. Li, and R. Sham. 2019. Heat Transfer-fluid flow interaction in natural convection around heated cylinder and its thermal chimney effect. United Kingdom: Oxford. Vol. ISBN: 978-1-912532-05-6, IAPE 2019.
- Morgan, V.T. 1975. The Overall Convective Heat Transfer from Smooth Circular Cylinders. Advances in Heat Transfer, 11:99–264 doi:10.1016/S0065-2717(08)70075-3
- Noto, K. 1989. Swaying motion in thermal plume above a horizontal line heat source. Journal of Thermophysics and Heat Transfer 3 (4):428–34. doi:10.2514/3.28768.
- Noto, K., T. Kenji, and N. Tsuyoshi. 1999. Spectra and critical grashof numbers for turbulent transition in a thermal plume. Journal of Thermophysics and Heat Transfer 13 (1):82–90. doi:10.2514/2.6404.
- Park, D., and B. Francine. 2015. Application of a wall-solar chimney for passive ventilation of dwellings. Journal of Solar Energy Engineering 137:6. doi:10.1115/1.4031537.
- Park, H., P. Jungsoo, and Y. J. Sung. 2019. Measurements of velocity and temperature fields in natural convective flows. International Journal of Heat and Mass Transfer 139:293–302. doi:10.1016/j.ijheatmasstransfer.2019.05.022.
- Stafford, J., and E. Vanessa. 2014. Configurations for single-scale cylinder pairs in natural convection. International Journal of Thermal Sciences 84:62–74. doi:10.1016/j.ijthermalsci.2014.05.001.
- Sun, Y., G. Zhiqiang, and H. Kamel. 2017. A review on the performance evaluation of natural draft dry cooling towers and possible improvements via inlet air spray cooling. Renewable and Sustainable Energy Reviews 79:618–37. doi:10.1016/j.rser.2017.05.151.
- Wenguang Li, Guopeng Yu, Zhibin Yu*, et al. 2020. CFD Modelling of a Thermal Chimney for Air-Cooled Condenser. Geothermics. 88, 101908
- Zhai, X. Q., Z. P. Song, and R. Z. Wang. 2011. A review for the applications of solar chimneys in buildings. Renewable and Sustainable Energy Reviews 15 (8):3757–67. doi:10.1016/j.rser.2011.07.013.
- Zhao, H., Y. Changqi, S. Licheng, Z. Kaibin, and F. Dan. 2015. Design of a natural draft air-cooled condenser and its heat transfer characteristics in the passive residual heat removal system for 10 MW molten salt reactor experiment. Applied Thermal Engineering 76:423–34. doi:10.1016/j.applthermaleng.2014.11.051.
- Zou, Z., G. Zhiqiang, G. Hal, and L. Yuanshen. 2012. Solar enhanced natural draft dry cooling tower for geothermal power applications. Solar Energy 86 (9):2686–94. doi:10.1016/j.solener.2012.06.003.