
 ?Mathematical formulae have been encoded as MathML and are displayed in this HTML version using MathJax in order to improve their display. Uncheck the box to turn MathJax off. This feature requires Javascript. Click on a formula to zoom.
ABSTRACT
This paper thoroughly investigates achieving acoustic matching in loudspeaker-driven thermoacoustic refrigerators (LSDTARs), elucidating the coupling mechanism between the acoustic source and the resonator. A comprehensive model of the LSDTAR is developed to analyze the resonator’s acoustic characteristics and the loudspeaker’s electrical-mechanical-acoustic response. Two critical indices are identified for effective acoustic matching: utilizable acoustic power in the thermoacoustic core and electroacoustic efficiency. The results reveal that the system’s radial size and the loudspeaker’s electrical-mechanical parameters are crucial in determining acoustic matching. LSDTARs with smaller diameters show a higher potential for acoustic matching, whereas larger systems require balancing acoustic power and electroacoustic efficiency. Enhancing the loudspeaker’s force factor is critical to enhancing electroacoustic efficiency, particularly at acoustic resonance. Joint optimization of the loudspeaker’s stiffness and moving mass enhances acoustic power and electroacoustic efficiency, thereby facilitating acoustic matching. This study deepens the understanding of the coupling dynamics in LSDTARs and presents essential guidelines for their design.
1. Introduction
Refrigeration, an essential aspect of energy utilization, is integral to various industries such as food preservation, cold chain logistics, electronics, and aerospace. Traditional and typical refrigeration systems, consisting of compressors, evaporators, condensers, and expansion valves, employ compressed vapor cycles of refrigerant for heat transfer, achieving cooling effects (Miller and Miller Citation2011). Despite their widespread application, these systems are costly and spatially demanding and pose environmental risks in the case of refrigerant leakage, including ozone depletion and global warming. Thermoacoustic refrigeration (Chen et al. Citation2021; Jin et al. Citation2015; Swift Citation1988, Citation2017), in contrast, offers an economical and environmentally friendly alternative, drawing attention from the acoustics and thermodynamics community.
Thermoacoustic refrigeration utilizes the thermoacoustic effect, replacing mechanical compression with thermoacoustic resonance for cooling. The working fluid oscillates under the drive of acoustic waves, thermally and viscously interacting with solid boundaries within a specified distance in the thermoacoustic (TA) core, producing a directional time-averaged heat flow. Thermoacoustic refrigerators (TARs) are broadly categorized into electric-driven types (Alamir Citation2020) and heat-driven types (Alcock, Tartibu, and Jen Citation2018; Xiao et al. Citation2023) based on the nature of the driving source. Compared to the latter, electric-driven TAR generally employs loudspeakers, linear alternators, and piezoelectric actuators, eliminating the need for a large temperature gradient during operation. Commercial loudspeakers, known for low manufacturing cost, ease of procurement, and simple structure, are widely applied in acoustic drivers. Since Hofler created the first standing-wave loudspeaker-driven thermoacoustic refrigerator (LSDTAR) in 1986 (Hofler Citation1986), which achieved a cooling temperature as low as and a maximum relative Carnot coefficient of performance of 12%, a series of LSDTARs with more significant cooling efficiency and capacity have been manufactured, including the space thermoacoustic refrigerator (STAR) (Garrett, Adeff, and Hofler Citation1993), the shipboard electronics thermoacoustic chiller (SETAC) (Ballaster and McKelvey Citation1995) and Frankenfridge (Poese and Garrett Citation2000). Due to the reliance on acoustic wave driving, enhancing the cooling capacity of LSDTARs necessitates focused interests in designing advanced acoustic drivers (El-Rahman et al. Citation2020; Hail et al. Citation2015; Steiner et al. Citation2021) and employing dual acoustic drivers (Chen, Tang, and Yu Citation2022; Poignand et al. Citation2011, Citation2013; Ramadan et al. Citation2021) to increase the acoustic radiation power. Parallel developments in resonator system optimization, including geometry and structural design adjustments (Alamir Citation2019; Feng et al. Citation2018; Luo, Huang, and Nguyen Citation2007; Ning and Li Citation2013), along with the adjustment and selection of the working frequencies (Chen Citation2015; Lihoreau et al. Citation2002; Tu et al. Citation2005), are also crucial.
Although many studies have focused on cooling capacity and the temperature difference across the TA core of LSDTARs (Alamir Citation2020; Pan, Wang, and Shen Citation2012; Poese and Garrett Citation2000; Poignand et al. Citation2011; Ramadan et al. Citation2021; Tijani Citation2001), effective control of acoustic characteristics is more significant in improving the performance of the system as the heat transfer is determined by the acoustic field distribution in the TA core (Chen and Xu Citation2021; Sun et al. Citation2023; Wheatley et al. Citation1983). Effective acoustic control encompasses both the acoustic source and the load. Matching the loudspeaker to the resonator system in LSDTARs and optimizing acoustic load for impedance matching have been shown to enhance maximum acoustic power and electroacoustic efficiency (Wakeland Citation2000). Taking into account the structural characteristics inside the resonator, detailed electrical-mechanical-acoustic coupling models have been developed for LSDTAR systems to optimize the design of loudspeakers coupled with resonators (Bailliet, Pierrick Lotton, and Gusev Citation2000; Tijani Citation2001), offering valuable guidance to enhance the system’s electro-acoustic efficiency. Furthermore, the coupling behavior between the loudspeaker and the resonator induces nonlinear effects within the system (David, Mao, and Jaworski Citation2006), and some of them have been found to play a positive role in improving both the acoustic pressure of the fundamental wave and the electroacoustic efficiency of the system (Fan et al. Citation2015). These studies highlight the importance of investigating the acoustic matching between the loudspeaker and the resonator.
Despite these advancements, research focusing on maximizing usable acoustic power in the TA core while minimizing electroacoustic efficiency losses remains limited. Distinct from prior research that concentrated predominantly on either enhancing the maximum values of acoustic power or electroacoustic efficiency alone through individual resonator parameters (Wakeland Citation2000) or on the distribution of the acoustic field (Bailliet, Pierrick Lotton, and Gusev Citation2000), this study aims to deepen the understanding of the design methodologies for electric-driven TARs by investigating the coupling mechanism between the acoustic driver and the resonator system. The critical factors that affect acoustic matching between them are identified as they directly determine the amount of acoustic energy converted to thermal energy in the TA core, as well as the overall energy efficiency of the system, which is pivotal for enhancing the performance of LSDTAR. By analyzing the frequency response of the coupled system, this study guides the selection of driving frequency and structural parameters of the coupling system that maximize the usable acoustic power for the TA core while maintaining high electroacoustic efficiency of the driver, thereby achieving acoustic matching in the design and operation of LSDTAR. The following sections are organized as follows: Section 2 details the physical model of the baseline LSDTAR. Section 3 develops the system-level refrigerator model and provides indices for acoustic matching. Section 4 presents and discusses the coupling mechanisms and methods to achieve acoustic matching in the system. Finally, conclusions are drawn in Section 5.
2. Physical model description
presents the baseline LSDTAR investigated in this study with alphabetically labeled components from A to G. It incorporates an acoustic driver and a resonator system. The acoustic source employs a closed-box loudspeaker system, which comprises an electrodynamic loudspeaker housed within an enclosure. The resonator system comprises a thermoacoustic (TA) core, a pair of heat exchangers, two tubes of varying diameters, and a large cavity. In particular, tube F employs a reduced diameter to minimize the loss of acoustic power (Hofler Citation1986; Swift Citation1997). The axial positions at the junctions of each component are labeled from to
, respectively. lists the detailed parameters of the baseline LSDTAR.
Figure 1. (a) Schematic diagram and (b) experimental rig of the LSDTAR system. Labeled in the figure are the A-loudspeaker system, B-large diameter tube, C-ambient heat exchanger, D-TA core, E-cold heat exchanger, F-small diameter tube, and G-cavity.
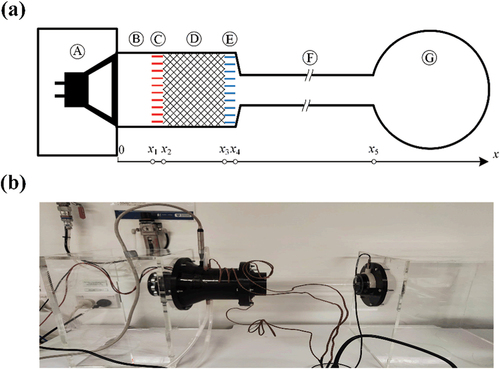
The TA core D, made of stacked ceramic plates, is tightly sandwiched between copper heat exchange materials, configured in parallel, acting as the ambient heat exchanger (AHE) C on one side and the cold heat exchanger (CHE) E on the other. Air is used as the working fluid, pressurized to a standard atmosphere, and the working environment is kept at a room temperature of . Once the system operates at the appropriate acoustic frequency, acoustic power is consumed within the TA core. This generates a time-averaged heat flow from the cold end (in contact with CHE) to the ambient temperature end (in contact with AHE), thereby establishing a temperature gradient in the TA core along the direction of sound propagation.
3. Methodologies
Considering only the plane acoustic wave propagating along the axis in the resonator, the driving frequency of the LSDTAR must conform to the constraint (Kinsler et al. Citation2000)
where denotes the velocity of sound, and
is the radius of the tube.
3.1. System-level model for refrigerator
3.1.1. Acoustic analysis of resonant tube
As the basis of LSDTAR lies in acoustics, we first set up an acoustic model to calculate the acoustic field distribution within the resonator from component B to F (). The starting point is the momentum and continuity equations of linear thermoacoustics, as deduced by Rott (Rott Citation1980)
where ,
and
represent acoustic pressure, volume flow rate, and temperature, respectively,
stands for the cross-section area of the fluid flow channel,
signifies specific heat ratio,
is Prandtl number, the subscripts “1” and “m” denote the first-order and mean values, and
and
are the thermal-viscous functions.
This paper focuses on the acoustic characteristics of LSDTAR, therefore setting as a necessary condition. To still treat
and
as lumped parameters, the resonator system is discretized into infinitesimal segments of length
(Ueda and Kato Citation2008). For any two adjacent segments (i.e., points
and
) with
,
,
,
,
, the conservation of mass and momentum equations in the form of a transfer matrix are written as
where the complex wave number is given by
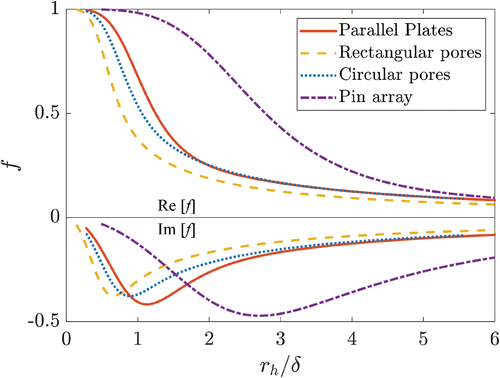
and
are two critical structural parameters that influence the acoustic characteristics of the resonator system. These two parameters correlate directly with the diameter of the tube, the HXs, and the TA core, along with the structural geometry of the TA core. The typical geometries of the TA core flow channels (Swift Citation2017) include parallel plates, rectangular pores, circular pores, and pin array, as illustrated in . This study focuses exclusively on comparing the differences between these geometrical configurations, necessitating a consistent
value across all comparisons. The distinct characteristics of each geometry are identifiable through the spatial-average function (see Appendix B), indicating that the primary effect of different geometries is on thermal viscous loss
within the TA core.
Figure 2. Typical geometries of TA core flow channels.
In particular, at where the diameter of the tube changes, the boundary conditions are determined by the continuity of
and
—or equivalently, the continuity of acoustic impedance, following the law of mass conservation. Let
denote the transfer matrix linking
and
at two
-axial positions, then
and
from
to
satisfy
where subscripts “B,” “C,” “D,” “E,” and “F” refer to the components of the LSDTAR (). Correspondingly, to
are
matrices linking
and
at both ends of each component. At
and
, we have
where ,
,
,
are the four elements of the matrix
. Here, we utilize acoustic impedance to characterize the acoustic properties of the working fluid.
Solving the Eqs. (7)-(8) yields
This indicates that is influenced by variations in
, primarily induced by changes in diameter
, along with
, which is mainly influenced by external loads. Finally, when
and
is determined,
and
at any position can be calculated using EquationEq.(4)
(4)
(4) . For more on the acoustic boundary conditions at
, see Appendix C.
Given that this study is based on linear thermoacoustic theory, it is crucial to confirm that the calculated acoustic pressure amplitude adheres to the conditions of linear acoustics, thereby avoiding turbulence in the gas flow. The verification metrics are the acoustic Mach number and the acoustic Reynolds number
(Swift Citation2017).
where is the average velocity and
represents the dynamic viscosity of the fluid.
3.1.2. Frequency response analysis of loudspeaker
We proceed to analyze the electro-mechano-acoustic behavior of the loudspeaker coupled with the resonator system. The vibratory system of the loudspeaker can be equivalently modeled as a damped spring-piston system when the perimeter of the diaphragm is significantly smaller than the acoustic wavelength. By using equivalent mechanical symbols to represent the acoustic boundary condition at , the equivalent model of the LSDTAR is obtained, as illustrated in . Additionally, by representing the resonator system’s characteristics using the acoustic impedance at
,
, the equivalent circuit diagram of the LSDTAR is derived, as depicted in . It consists of three parts from left to right: the electrical, mechanical, and acoustic domains (Borwick Citation2012).
Figure 3. Schematic diagram of the system with acoustic boundary conditions.
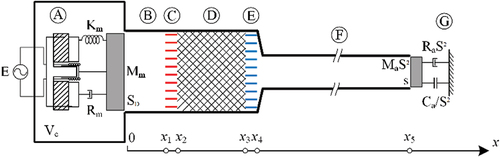
Figure 4. The equivalent circuit diagram for the loudspeaker system (a) incorporates electrical, mechanical, and acoustic domains. Simplified diagram in equivalent (b) electrical and (c) mechanical impedance domains.
For the electrical domain, ,
,
, and
denote the driving voltage, the direct current resistance, the inductance of the voice coil, and the force-electric coupling factor of the loudspeaker, respectively. Within the mechanical domain,
is the equivalent mass of the loudspeaker vibratory system, while
and
(=
) are the equivalent mechanical resistance and compliance (the reciprocal of stiffness) of the loudspeaker’s suspension system, respectively. Regarding the acoustic domain,
denotes the diaphragm’s effective acoustic radiation area, and
represents the acoustic compliance contributed by the air elasticity within the closed box.
signifies the acoustic impedance of the resonator at
, incorporating the impedance contributions from the components B to G. For a more straightforward calculation of the system’s frequency response, the electrical gyrator is removed. This leads to the equivalent mechanical and electrical analog circuit diagrams of the system, represented in , respectively.
stands for the ampere force acting on the voice coil.
represents the total equivalent mechanical impedance of the whole system, comprising the series combination of the mechanical impedance inherent to the loudspeaker and the equivalent one of the resonator system, as expressed:
where refers to the volume of air in the closed box. Consequently, the current
that the voice coil carries and the vibration speed of the diaphragm,
, can be expressed as (Borwick Citation2012)
where is employed to represent the total equivalent electrical impedance of the TAR system and
At , the air’s volume flow rate
can be represented by the volume of the gas column displaced
by the diaphragm over the cross-section, within the time duration
Acoustic pressure at
can be calculated by
The dynamic response of the LSDTAR is influenced by its driving frequency, which requires the calculation of the resonance frequency. Resonance occurs when the reactance part of the system’s equivalent mechanical impedance equals zero, as indicated by
where signifies the imaginary part of a complex quantity. Note that the natural frequencies of both the loudspeaker and the resonator system determine the system’s resonance frequency. The natural frequency of the loudspeaker vibratory system is calculated by
For the resonator system, resonance is attained when the reactance of acoustic impedance at equals zero, denoted by
3.2. Power and electroacoustic efficiency
The available acoustic power in the TA core is crucial for electric-driven TAR systems as it determines whether sufficient acoustic energy can be converted into thermal energy. The time-averaged acoustic power flowing along the -axis is written as
where denotes the phase difference between
and
, and the subscript “2” represents the product of two first-order quantities. Therefore, the acoustic power that can be utilized in the TA core is represented as
=
at
-
at
.
Electroacoustic efficiency is also a significant metric in assessing system performance. The time-averaged electrical power consumed by the system, , can be represented as
where and
are the input voltage and current amplitude. Electroacoustic efficiency is calculated by
Both and
are used as indices to evaluate the effectiveness of acoustic matching in LSDTAR. The former determines the maximum power used for acoustic-to-heat energy conversion in the TA core, whereas the latter indicates the efficiency for electric-to-acoustic energy conversion in the loudspeaker. A LSDTAR system is considered to have achieved acoustic matching when
and
reach a significantly high value, for example, exceeding
of their respective peak values.
4. Results and discussions
4.1. Baseline LSDTAR
First, the electrical and acoustic characteristics of the baseline LSDTAR are analyzed. Boundary condition at is obtained by Eq. (C3). The loudspeaker employs a 5MR450-NDY series driver manufactured by PRV Audio. Its natural frequency (with a closed box), calculated using EquationEq. (18)
(18)
(18) , is
. The fundamental natural frequency of the resonator system, determined by EquationEq. (19)
(19)
(19) , is also equal to
. Moreover, the operating frequency, as calculated by EquationEq. (1)
(1)
(1) , should not exceed
and therefore is set within the range of
.
Following the analysis in Section 3.1, the frequency response for the following parameters is calculated. Electrical characteristics involve the system’s total equivalent electrical impedance , the current in the voice coil
, the electrical power consumed
, and the electroacoustic efficiency
. Acoustic characteristics include the acoustic pressure amplitude
and the volume flow rate amplitude
at
, the phase difference
between
and
, and the available acoustic power
in the TA core, as shown in .
Figure 5. Dependence of electrical and acoustic parameters of LSDTAR on .
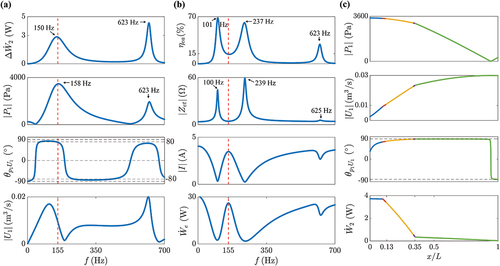
Focusing initially on the acoustic characteristics within the acoustic matching index, it is observed that both and
reach their peak values singularly near
and at
, indicative of an acoustic resonance condition.
typically ranges from
to
, signifying that the acoustic field inside the TA core is dominated by standing waves. illustrates the acoustic field distribution in the resonant tube at
, with the orange area representing the location of the TA core. At
,
reaches the only antinode, while
reaches the only node. Near the end of the resonant tube,
reaches the only node, and
reaches the only antinode. This visualization confirms that the baseline LSDTAR essentially functions as a quarter-wavelength standing-wave acoustic system. Acoustic power is consumed in the TA core, and the variation in
and
at
is attributed to the acoustic impedance of the resonant cavity.
Turning to the other index, the electroacoustic efficiency , demonstrates that
achieves minimal values within
, with peaks emerging on either side of
. This “inverse relationship” between
and
suggests that acoustic matching between the source and resonator has not been achieved, implying a lower energy utilization efficiency of the system at
. This result arises from the coupling effect between the driver and the resonator system, which share the same natural frequency. According to vibration theory, the LSDTAR system can be conceptualized as a two-degree-of-freedom (2DOF) system. Its frequency response characteristics are determined by the properties of individual components and their interactions and mutual coupling. Compared to an isolated loudspeaker, a resonator’s presence influences the vibration system’s dynamic state, altering its impedance (reflected in the “dual-peak” feature of
). Combined with the induced electromotive force in the voice coil, it correspondingly leads to variations in
and
. Considering the frequency response of
,
is found to be minimal near
and exhibits a “dual peak” characteristic on both sides of
. For an alternative calculation method for mechanical behaviors of the LSDTAR and a comparable damped 2DOF spring-mass model, see Appendix C.
Based on the results obtained and in conjunction with the mathematical model of the refrigerator, a parametric analysis has been conducted to thoroughly investigate the effect of variations in key parameters, including the system size and loudspeaker parameters, on and
. This investigation is pivotal for exploring methods to achieve acoustic matching in the LSDTAR. Note that the following analysis is conducted primarily around the first acoustic resonance frequency, which is of more excellent practical utility for operating the LSDTAR.
4.2. Effect of diameter of resonator system
We initially focus on examining the influence of the radial dimension, specifically the cross-sectional area controlled by that encompasses the resonator tube (including the HXs and the TA core) and the sound radiation area of the loudspeaker, on the acoustic matching in the LSDTAR. Typically, the demand for a large cooling capacity implies the employment of a larger diameter for the TA core (Tijani Citation2001). Here,
. Maintaining the natural frequency of the loudspeaker and the resonator system consistent (ranging between
, which can be achieved by slightly adjusting the length of tube F) and using
under baseline conditions as the reference, illustrates the frequency response of
and
within the
range, as
varies.
Figure 6. Frequency response of and
with different
.
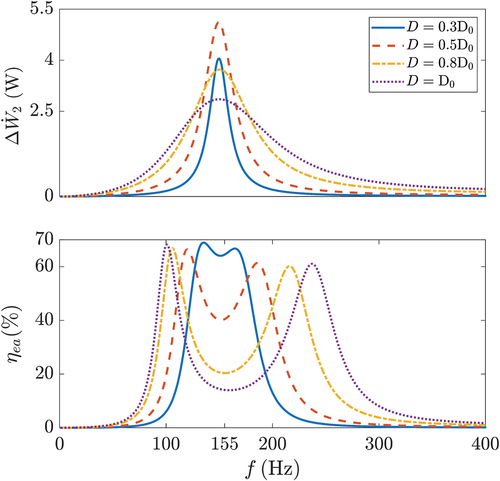
As observed, a decrease in results in a sharper and higher resonance peak in the frequency response curve of
, but an excessively small
decreases the peak value. This phenomenon can be explained by two factors: acoustic impedance and thermal-viscous losses. When
is reduced, the cross-sectional area
decreases, leading to an increase in acoustic impedance (given by
). This increase restricts and reflects sound waves more effectively, enhancing the resonance effect. At specific frequencies
, a smaller
in the resonant tube system reduces thermal-viscous losses within the tube. The consequent reduction in damping enhances the quality factor
, resulting in sharper resonance peaks. An excessively small
leads to a significantly reduced
, which subsequently causes a rapid decrease in
.
maintains its “dual-peak” characteristic, with both peak frequencies converging toward
as
decreases and the minimal value at this frequency notably increases. This is mainly because
determines the coupling strength between the loudspeaker and the resonator system. When
is sufficiently small, the resonator dominates the acoustic characteristics, while the loudspeaker governs the electrical parts. Since their natural frequencies are aligned, LSDTAR operates optimally at the acoustic resonance frequency
. This elucidates the fundamental reason behind the frequency selection for smaller diameter LSDTARs (Bailliet, Pierrick Lotton, and Gusev Citation2000; Tijani Citation2001). However, for devices requiring large refrigeration capacities, the operating frequency should not be set to
, but rather a balance between
and
must be considered, and the achievement of acoustic matching may require exploration of other approaches. Overall, reducing the diameter of the tube to a certain extent can facilitate acoustic matching in LSDTAR, thereby achieving a higher
while maintaining a reasonably large
.
4.3. Effect of TA core geometry
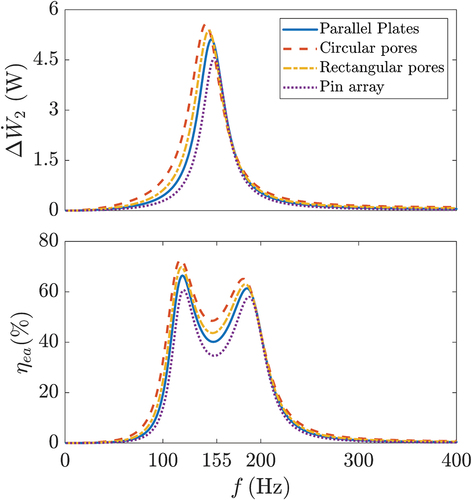
TA core is a key component in thermoacoustic devices, significantly influencing the system’s heat transfer. This section analyzes the impact of the TA core’s structural geometry on the acoustic matching in LSDTAR. To exclusively compare the differences between various geometries, the porosity is set to a constant value, ensuring a consistent . The different geometries of the TA core mainly influence its internal thermal viscous losses. illustrates the frequency response of
and
within the
range as the geometry of the TA core varies. For the TAR with
, the impact of different TA core geometries on acoustic matching is not significant. Compared to other geometric structures, the system’s
and
are highest when the circular pores are employed, especially under acoustic resonance conditions where the minimum value of
is also the largest. In contrast, the pin array, which is the most challenging to manufacture, yields the lowest values for these parameters. Overall, the use of circular pores in the TA core is beneficial for achieving higher
and
at the resonance frequency, thus fulfilling acoustic matching requirements.
Figure 7. Frequency response of and
with different TA core geometry.
4.4. Effect of loudspeaker
In this subsection, we examine the effect of the loudspeaker, including the product, the stiffness
, and the moving mass
, on the acoustic matching in the LSDTAR.
4.4.1. factor
The effect of the product, which influences the driving force of the speaker’s vibrational system, is first studied. Using
as a reference under baseline conditions, depicts the frequency response of
and
within the
range as
varies. Note that the variation of
product does not affect the natural frequency of the loudspeaker vibration system.
Figure 8. Frequency response of and
with different
.
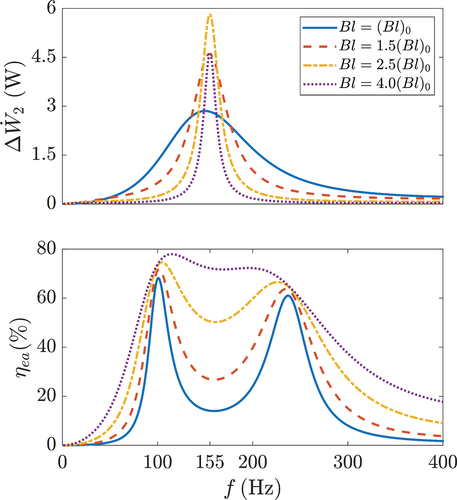
As increases, the frequency response curve of
gradually sharpens, achieving a higher resonance peak at
. The
increases throughout the frequency range, particularly at
, where the minimum value obtained is significantly enhanced, leading to a smoother transition between the two peak values. This is mainly due to the increasing dominance of
in altering the system’s total equivalent electrical impedance
. An excessively large
increases the size and manufacturing cost of the loudspeaker (Borwick Citation2012) but does not effectively contribute to the increase of
. Overall, increasing
not only favors the enhancement of acoustic power available to the TA core but also significantly improves the electroacoustic efficiency of the system at the acoustic resonance frequency, thereby facilitating acoustic matching in LSDTAR.
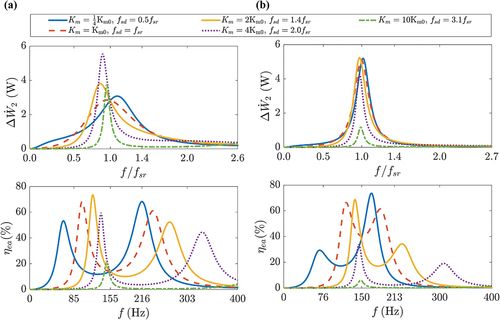
4.4.2. Stiffness 
Subsequently, the impact of variations in is investigated. With the resonator’s natural frequency
held constant, and using
in the baseline conditions as a reference, demonstrates the frequency response of
and
for two typical diameters (
and
) within the
range, as
varies.
Figure 9. Frequency response of and
with different
for:(a)
(b)
.
4.4.3. Moving mass
Next, the impact of variations in is analyzed. By maintaining
and referencing the baseline condition
, displays the frequency response of
and
within the range of
for two diameters, as
varies.
Figure 10. Frequency response of and
with different
for:(a)
(b)
.
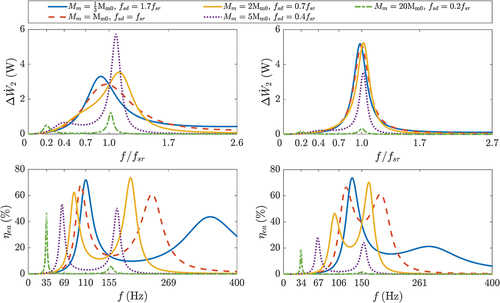
For the system with (), an increase in
results in a sharper and higher peak in
curve, while the peak and corresponding frequency of
progressively decrease. For the TAR with
(), a slight increase in
has a negligible impact on
but contributes to a particular enhancement in
at the same frequency. Additionally, when
, both
and
achieve an additional, smaller peak, with the frequency corresponding to the natural frequency of the loudspeaker. This is primarily because, at higher values of
, the loudspeaker’s behavior dominates that of the coupled system. In general, an increase in
causes one of the peak frequencies of
to gradually converge with that of
, thus facilitating the acoustic matching in the system.
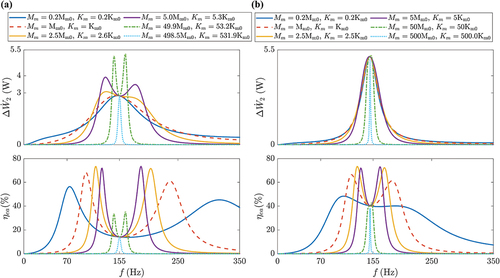
4.4.4. Stiffness and Moving mass
Based on the results presented in Sections 4.4.2 and 4.4.3, especially for refrigerators with larger diameters, acoustic matching is primarily achieved by adjusting the natural frequency of the loudspeaker to be different from that of the resonator. The implications of concurrent modifications in and
are discussed. According to EquationEq. (18)
(18)
(18) , maintaining a near-equivalent ratio of variation in
and
ensures that
.
illustrates the frequency response of and
within the range of
for two diameters under simultaneous variation in
and
. It is evident that all frequency response curves attain an extremum at
; the trend of
for TARs of both sizes is consistent, with both peaks gradually increasing and their frequencies approaching
. In particular, TAR with a smaller diameter exhibits a higher value at
, approximately twice that of the larger diameter. The most significant difference is manifested in
. For TAR devices with
(), as
and
increase concurrently, a “dual-peak” characteristic gradually emerges around
in
, with the peaks enlarging and the curve transitioning from a maximum at
to a minimum, and eventually back to a maximum. This occurs because the acoustic characteristics of the system evolve with the concurrent increase in
and
. Initially, the system’s acoustics are dominated by the characteristics of the resonator. As
and
increase, there is a transition to a state where the resonator and loudspeaker equally influence the acoustic behavior. Eventually, the system shifts to a state predominantly governed by the loudspeaker. In the case of the TAR device with a diameter of
(),
remains essentially unchanged. This is because when the system dimension
is smaller, the resonator primarily dictates the acoustic characteristics. Compared to independently adjusting
or
, modifying both parameters concurrently is advantageous for simultaneously enhancing both
and
. Moreover, this joint adjustment results in a greater alignment of their peak frequencies, thereby achieving acoustic matching in the LSDTAR.
Figure 11. Frequency response of and
with different
and
for:(a)
(b)
.
5. Conclusions
This paper investigates the determinants and strategies for achieving acoustic matching between the acoustic source and resonator in a loudspeaker-driven thermoacoustic refrigerator (LSDTAR). Initially, a detailed model of the refrigerator is established to calculate the acoustic field characteristics in the resonator and the frequency response of the loudspeaker’s electrical-mechanical-acoustic parameters. Following this, two critical indices for acoustic matching in LSDTAR are proposed: the utilizable acoustic power in the thermoacoustic (TA) core and the electroacoustic efficiency of the loudspeaker,
. Finally, a comprehensive analysis is conducted on the effects of variations in system size and the electrical-mechanical parameters of the loudspeaker. The main findings of this study are summarized as follows:
The coupling behavior between the loudspeaker and the resonator significantly reduces the
The system’s radial size
Enhancing the loudspeaker’s force factor
The analytical results of this study elucidate the coupling mechanism between the acoustic source and the resonator and provide guidelines for acoustic matching in the LSDTAR. Future work will focus on matching the acoustic and refrigeration performance in electric-driven TARs.
Disclosure statement
No potential conflict of interest was reported by the author(s).
Additional information
Funding
References
- Alamir, M. A. 2019. Experimental study of the stack geometric parameters effect on the resonance frequency of a standing wave thermoacoustic refrigerator. International Journal of Green Energy 16 (8):639–51. doi:10.1080/15435075.2019.1602533.
- Alamir, M. A. 2020. Experimental study of the temperature variations in a standing wave loudspeaker driven thermoacoustic refrigerator. Thermal Science and Engineering Progress 17:100361. doi:10.1016/j.tsep.2019.100361.
- Alcock, A. C., L. K. Tartibu, and T. C. Jen. 2018. Experimental investigation of an adjustable thermoacoustically-driven thermoacoustic refrigerator. International Journal of Refrigeration 94:71–86. doi:10.1016/j.ijrefrig.2018.07.015.
- Bailliet, H., M. B. Pierrick Lotton, and V. Gusev. 2000. Coupling between electrodynamic loudspeakers and thermoacoustic cavities. Acta Acustica United with Acustica 86:363–73.
- Ballaster, S. C., and D. J. McKelvey. 1995. Shipboard electronics thermoacoustic cooler. master of Science thesis, Monterey, CA: Physics Department, Naval Postgraduate School.
- Borwick, J. 2012. Loudspeaker and headphone handbook. New York: Taylor & Francis.
- Chen, L.-W. 2015. A theoretical and experimental study on flow characterisation in an acoustically excited chamber. Wave Motion 58:68–76. doi:10.1016/j.wavemoti.2015.07.003.
- Chen, Z., J. Li, T. Li, T. Fan, C. Meng, C. Li, J. Kang, L. Chai, Y. Hao, Y. Tang, et al. 2022. A CRISPR/Cas12a-empowered surface plasmon resonance platform for rapid and specific diagnosis of the omicron variant of SARS-CoV-2. National Science Review 9 (8):nwac104. doi:10.1093/nsr/nwac104.
- Chen, G., L. Tang, B. Mace, and Z. Yu. 2021. Multi-physics coupling in thermoacoustic devices: A review. Renewable and Sustainable Energy Reviews 146:111170. doi:10.1016/j.rser.2021.111170.
- Chen, G., L. Tang, and Z. Yu. 2022. Modeling and analysis of a dual-acoustic-driver thermoacoustic heat pump. Thermal Science and Engineering Progress 30:101270. doi:10.1016/j.tsep.2022.101270.
- Chen, G., and J. Xu. 2021. Acoustic characteristics of looped-tube thermoacoustic refrigerators with external and in-built acoustic drivers: A comparative study. The Journal of the Acoustical Society of America 150 (6):4406–16. doi:10.1121/10.0009034.
- David, M., X. Mao, and A. J. Jaworski. 2006. Acoustic coupling between the loudspeaker and the resonator in a standing-wave thermoacoustic device. Applied Acoustics 67 (5):402–19. doi:10.1016/j.apacoust.2005.08.001.
- El-Rahman, A., I. Ahmed, W. A. Abdelfattah, K. S. Abdelwahed, A. Salama, A. Rabie, and A. Hamdy. 2020. A compact standing-wave thermoacoustic refrigerator driven by a rotary drive mechanism. Case Studies in Thermal Engineering 21:100708. doi:10.1016/j.csite.2020.100708.
- Fan, L., Z. Chen, J.-J. Zhu, J. Ding, J. Xia, S.-Y. Zhang, H. Zhang, and H. Ge. 2015. Nonlinear effects in a model of a thermoacoustic refrigerator driven by a loudspeaker. Journal of Applied Physics 117 (12):124502. doi:10.1063/1.4916077.
- Feng, H., Y. Peng, X. Zhang, and X. Li. 2018. Influence of tube geometry on the performance of standing-wave acoustic resonators. The Journal of the Acoustical Society of America 144 (3):1443–53. doi:10.1121/1.5053578.
- Garrett, S. L., J. A. Adeff, and T. J. Hofler. 1993. Thermoacoustic refrigerator for space applications. Journal of Thermophysics and Heat Transfer 7 (4):595–99. doi:10.2514/3.466.
- Hail, C. U., P. C. Knodel, J. H. Lang, and J. G. Brisson. 2015. A linearly-acting variable-reluctance generator for thermoacoustic engines. Energy Conversion and Management 100:168–76. doi:10.1016/j.enconman.2015.04.073.
- Hofler, T. J. 1986. Thermoacoustic refrigerator design and performance. PhD diss., Physics Department, University of California at San Diego.
- Jin, T., J. Huang, Y. Feng, R. Yang, K. Tang, and R. Radebaugh. 2015. Thermoacoustic prime movers and refrigerators: Thermally powered engines without moving components. Energy 93:828–53. doi:10.1016/j.energy.2015.09.005.
- Kinsler, L. E., A. R. Frey, A. B. Coppens, and J. V. Sanders. 2000. Fundamentals of acoustics. New York: Wiley.
- Lihoreau, B., P. Lotton, M. Bruneau, and V. Gusev. 2002. Piezoelectric source exciting thermoacoustic resonator: Analytical modelling and experiment. Acta Acustica United with Acustica 88:986–97.
- Luo, C., X. Y. Huang, and N. T. Nguyen. 2007. Generation of shock-free pressure waves in shaped resonators by boundary driving. The Journal of the Acoustical Society of America 121 (5):2515–21. doi:10.1121/1.2713716.
- Miller, R., and M. R. Miller. 2011. Air conditioning and refrigeration, 2nd Edition ed. New York: McGraw Hill LLC.
- Ning, F., and X. Li. 2013. Numerical simulation of finite amplitude standing waves in acoustic resonators using finite volume method. Wave Motion 50 (2):135–45. doi:10.1016/j.wavemoti.2012.08.001.
- Pan, N., S. Wang, and C. Shen. 2012. Visualization investigation of the flow and heat transfer in thermoacoustic engine driven by loudspeaker. International Journal of Heat and Mass Transfer 55 (25):7737–46. doi:10.1016/j.ijheatmasstransfer.2012.07.083.
- Poese, M. E., and S. L. Garrett. 2000. Performance measurements on a thermoacoustic refrigerator driven at high amplitudes. The Journal of the Acoustical Society of America 107 (5):2480–86. doi:10.1121/1.428635.
- Poignand, G., P. Lotton, G. Penelet, and M. Bruneau. 2011. Thermoacoustic, small cavity excitation to achieve optimal performance. Acta acustica united with acustica 97 (6):926–32. doi:10.3813/AAA.918474.
- Poignand, G., A. Podkovskiy, G. Penelet, P. Lotton, and M. Bruneau. 2013. Analysis of a coaxial, compact thermoacoustic heat-pump. Acta acustica united with acustica 99 (6):898–904. doi:10.3813/AAA.918669.
- Ramadan, I. A., H. Bailliet, G. Poignand, and D. Gardner. 2021. Design, manufacturing and testing of a compact thermoacoustic refrigerator. Applied Thermal Engineering 189:116705. doi:10.1016/j.applthermaleng.2021.116705.
- Rott, N. 1980. Thermoacoustics. In Advances in applied mechanics, ed. C.-S. Yih, vol. 20, 135–75. Amsterdam: Elsevier.
- Steiner, T. W., K. B. Antonelli, G. D. S. Archibald, B. De Chardon, K. T. Gottfried, M. Malekian, and P. Kostka. 2021. A high frequency, power, and efficiency diaphragm acoustic-to-electric transducer for thermoacoustic engines and refrigerators. The Journal of the Acoustical Society of America 149 (2):948–59. doi:10.1121/10.0003495.
- Sun, W., G. Chen, L. Tang, and K. Chin Aw. 2023. Theoretical study on the performance of a standing-wave thermoacoustic refrigerator under various boundary conditions. In 15th International Green Energy Conference (IGEC-XV), ed. Z. Jian, K. Sambhaji, Y. Zhibin, and L. Xianguo, July 10–13, 2023, 53–64, Glasgow, UK. Glasgow, (UK): Springer Cham. doi:10.1007/978-3-031-48902-0_4.
- Swift, G. W. 1988. Thermoacoustic engines. The Journal of the Acoustical Society of America 84 (4):1145–80. doi:10.1121/1.396617.
- Swift, G. W. 1997. Thermoacoustic natural gas liquefier. In Report number: LA-UR-97-950; CONF-970367-3, 1–4. Research Org: Los Alamos National Lab. (LANL), Los Alamos, NM (United States), May.
- Swift, G. W. 2017. Thermoacoustics: A unifying perspective for some engines and refrigerators, 2nd edition ed. Switzerland: Springer Cham.
- Tijani, M. E. H. 2001. Loudspeaker-driven thermo-acoustic refrigeration. PhD diss. Department of Applied Physics, Eindhoven University of Technology.
- Tu, Q., V. Gusev, M. Bruneau, C. Zhang, L. Zhao, and F. Guo. 2005. Experimental and theoretical investigation on frequency characteristic of loudspeaker-driven thermoacoustic refrigerator. Cryogenics 45 (12):739–46. doi:10.1016/j.cryogenics.2005.09.004.
- Ueda, Y., and C. Kato. 2008. Stability analysis of thermally induced spontaneous gas oscillations in straight and looped tubes. The Journal of the Acoustical Society of America 124 (2):851–58. doi:10.1121/1.2939134.
- Wakeland, R. S. 2000. Use of electrodynamic drivers in thermoacoustic refrigerators. The Journal of the Acoustical Society of America 107 (2):827–32. doi:10.1121/1.428265.
- Wheatley, J., T. Hofler, G. W. Swift, and A. Migliori. 1983. An Intrinsically Irreversible Thermoacoustic Heat Engine. The Journal of the Acoustical Society of America 74 (1):153–70. doi:10.1121/1.389624.
- Xiao, L., K. Luo, J. Chi, G. Chen, Z. Wu, E. Luo, and J. Xu. 2023. Study on a direct-coupling thermoacoustic refrigerator using time-domain acoustic-electrical analogy method. Applied Energy 339:120972. doi:10.1016/j.apenergy.2023.120972.
Appendix A
Key parameters of the baseline LSDTAR
Table A1. Key parameters of the baseline LSDTAR.
Appendix B
Thermal-viscous functions
The thermal-viscous function and
is written as Swift (Citation2017)
where is the hydraulic radius,
and
represent the viscous and thermal penetration depth with
,
denoting the dynamic viscosity and thermal conductivity of the air,
, and
. The real and imaginary components of
as functions of
are illustrated in .
Figure B1. Thermal-viscous functions for different geometries of TA core.
Appendix C
Varying boundary conditions
Since the resonator is connected at to the loudspeaker system A and
to the cavity G, constraints are imposed on the boundary conditions for the tube. When an external acoustic load is connected at the end of the resonator,
, the acoustic field distribution within the TAR system undergoes alterations. If the linear dimensions of the load are substantially smaller than the acoustic wavelength (Chen et al. Citation2022), it can be modeled as a lumped parameter system. Here, we employ the acoustic impedance at
to serve as a clear and simplified representation of the characteristics of the acoustic load:
where signifies the angular frequency,
is the frequency, and
,
and
denote acoustic resistance, acoustic inertance, and acoustic compliance, respectively. Acoustic loads present various real-world analogies depending on their parameters. Generally, a load with high
and low
and
is equivalent to a long and narrow tube or a rigid wall with a small hole or gap. Therefore, in a tube with a length
and a cross-sectional area
,
,
and viscous resistance
can be calculated by Swift (Citation2017)
a
One with significantly higher and negligible
and
is likened to a large cavity filled with gas or comparable to a deformable membrane. Therefore, the cavity’s equivalent
due to the”air spring” contributes to the acoustic impedance, expressed as
where and
are the density and the speed of sound of the air, and
is the volume of the cavity. Furthermore, when the resonator terminates in an unflanged open end, it becomes necessary to incorporate the acoustic radiation impedance,
, into consideration (Kinsler et al. Citation2000)
where and
are the cross-section area and radius of the tube, and
.
Appendix D
D.2. D.1. Alternative calculation method for mechanical behaviors of the LSDTAR
The acoustic source utilized in this study is a commercial moving-coil loudspeaker. The loudspeaker vibration system, comprising the voice coil, diaphragm, and suspension system, features mechanical resistance , moving mass
, and stiffness
, with the vibrator acting as a piston with an effective area
. The vibration system is driven by the Ampere force produced by the voice coil, given by
. According to Newton’s second law, the equation of motion for the moving mass is represented as follows
where is the displacement. Using
and
, the input impedance of the loudspeaker can be derived as
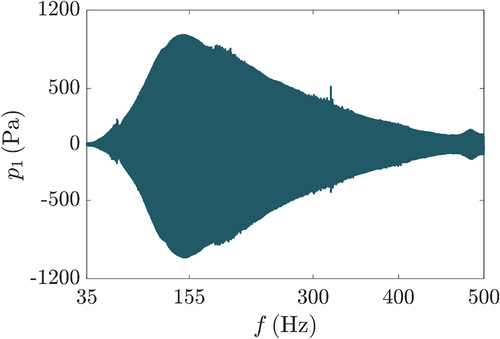
To verify the accuracy of this model, we conducted a frequency sweep experiment on the acoustic pressure amplitude at
, covering a frequency range of
with a speaker drive voltage peak-to-peak value of
. The results indicate a sound pressure peak of approximately
, with a peak frequency of
, which deviates slightly from the
observed in . This deviation is primarily due to the buffer section at the diameter change in the actual resonant tube system, resulting in a slightly longer tube length than the theoretical calculation, thus increasing the resonance frequency. The lower
is attributed to the relatively low drive voltage in the preliminary test and the nonlinear effects within the tube causing changes in acoustic impedance, which also limits the radiated acoustic pressure. Overall, the accuracy of the loudspeaker’s lumped element model in this study can be verified.
Figure D1. The frequency sweep profile of at
.
The volume flow rate of the air column it drives at is written as
By Using , and subsequently eliminating the time factor
from both sides, the following is derived
When air resonates, reaches its maximum, and the net external force exerted on the loudspeaker vibration system reaches a minimum, resulting in a minimal value for
. This suggests that at
, most of the acoustic energy radiated by the loudspeaker is absorbed by the resonator system, and the vibration of the loudspeaker diaphragm is partially suppressed.
D.2. Weakly coupled 2DOF model
Similarly, consider a two-degree-of-freedom (2DOF) spring-mass system with viscous damping, as illustrated in . Key parameters are listed in . Note that the natural frequencies of the two oscillators are identical. The governing differential equation for the system’s motion is
The steady-state frequency response of under the action of an excitation force is shown in . It can be observed that the dimensionless amplitude,
, of
exhibits two peaks, corresponding to resonances, as a function of frequency.
Figure D2. Schematic of the weakly coupled 2DOF model.
Figure D3. Normalized displacement-frequency response of and
.
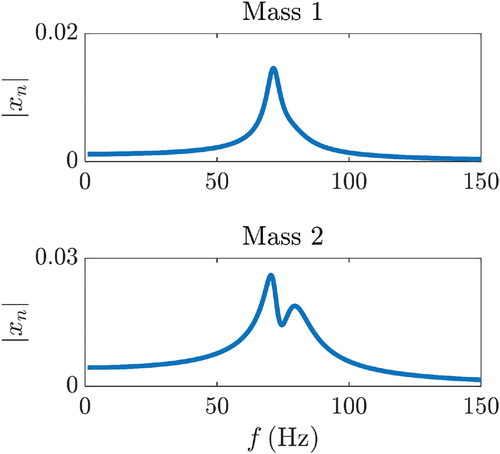
Table D1. Key parameters of the 2DOF system.