
Abstract
Sports event research has displayed gaps in the analysis of different stakeholders’ perspectives and satisfaction levels. Consequently, this study aims at laying bare real-time experiences of event stakeholders via a unique mixed method research approach for explaining stakeholder satisfaction. Data were gathered on occasion of the 2016 International Children’s Games in Innsbruck, Austria via mobile ethnography using an app (n = 103), semi-structured interviews (n = 24), and participatory observations. Stakeholders’ experiences were analyzed with the confirmation/disconfirmation paradigm, revealing that catering, transport, and organization can be classified as essential factors, whereas performance factors comprise competitions, daily work, and atmosphere. The findings contribute to the sports event and tourism literature (1) by analyzing the main stakeholders’ perceptions along the entire event journey during the 2016 ICG and (2) by aiming to gather a deeper comprehension of processes among sports event stakeholders with a mixed methodological approach (mobile ethnographical app, interviews and participatory oberservations).
Introduction
Generally, markets have changed from sellers’ markets to buyers’ market due to the internet revolution, multimedia-based networking, and marketing communications focusing on socially constructed experiences (Hayes, Filo, Riot, & Geurin, Citation2019; Orefice, Citation2018). As far as events are concerned, the volatility of sports events as products necessitates that the production and consumption of event products coincide (Prahalad & Ramaswamy, Citation2004); various stakeholders have an influence here and thus collaboration between them is required (Grohs, Wieser, & Pristach, Citation2020). This collaboration has been accelerated through the development of digital technology, and likewise consumer-company interactions will become an important part of sports events in the future. In this investigation, we presume a broad definition of co-creation as the enactment of creation through interactions (Ramaswamy & Ozcan, Citation2014). This entails touchpoints including relationships between consumers/users, companies, and organizations, which are provided by technological platforms, enhanced by digital technologies, and supported by authorities.
Furthermore, the ways of analyzing single stakeholders’ event experiences could be enriched by using research techniques that take up these developments and also focus on individual experiences, such as ethnography and the observation of participants (Jaimangal-Jones, Citation2014). Ethnography provides an on-site assessment of stakeholder satisfaction and experiences, focusing on subjective situational experiences as well as emotionally affected aspects (Stickdorn & Schneider, Citation2010).
In a scholarly research context, ethnographic content has attracted little attention when it comes to a mixed method approach focusing on event stakeholder satisfaction. Therefore, based on the case study of the Innsbruck 2016 International Children’s Games (2016 ICG), the goal of this research is to combine mixed methodological approaches (application for mobile ethnography, qualitative interviews, and participatory observations) in order to shed light on the subsequent research objectives: Firstly, the study aims at analyzing the main stakeholders’ perceptions along the entire event journey on occasion of the 2016 ICG; secondly, the study uses a mixed method approach to gather a deeper comprehension of processes among sports event stakeholders.
Literature review
Stakeholder experience and satisfaction at sports events
Stakeholder/customer experience has never been seen as a fixed construct (Schmitt, Citation1999); its perception has altered in recent decades. Accordingly, research has not yet given a common definition of customer experience. However, researchers are sure about its diversity (Chen & Chen, Citation2010; Zehrer, Citation2009) and agree on the fact that the success of enterprises is associated with creating personal added value for customers by providing authentic experiences (Pine & Gilmore, Citation1998) ultimately leading to satisfaction. The fundamentals of customer experience are built on touchpoints (Meyer & Schwager, Citation2007) with a product, service, brand, company, etc. leading to perceptions and experiences in negative, positive, or neutral ways. However, those experiences are additionally influenced by the customers themselves, the company, the situation, the interaction environment, or even marketing communication strategies (Bosio, Rainer, & Stickdorn, Citation2017). Moreover, these confrontations are not only restricted to the consumption process, but additionally occur in the search phase, the after-sales phase, and in the context of memories after the consumption phase, which constitute a journey of interactions called customer journey. The visualization of steps and touchpoints as well as a rather holistic understanding of the entire experience are major aspects of a customer journey map (Bosio et al., Citation2017). Establishing a detailed overview of various customer experiences through an aggregated journey map provides key facts about the quality and perception of different events or side events and offers important knowledge (Stickdorn, Hormess, Lawrence, & Schneider, Citation2018).
Indeed, stakeholder satisfaction looms large in the composition of stakeholder experience. Depending on how the notion of “customer” is defined in a sports event context (e.g., visitors, sponsors, media, athletes, accompanying staff, international federation), theories relating to customer satisfaction (e.g., the C/D-Paradigm) may be applied to any kind of event stakeholder. In the late 20th century, one of the most relevant methods for explaining stakeholder satisfaction was introduced: The confirmation/disconfirmation model or C/D-Paradigm (Hinterhuber, Handlbauer, & Matzler, Citation2003; Matzler, Citation2000; Oliver, Citation1980). The C/D-Paradigm is composed of a three-phased model, which explains the development of stakeholder satisfaction. The actual satisfaction levels are based on a variety of previous processes, such as expectations, actual perceptions, and the comparison of impressions. Satisfaction is of a multifarious nature (Matzler, Citation2000), which can be further aggregated into basal factors (responsible for dissatisfaction), performance factors (contingent on whether the customers’ requests can be fulfilled), and excitement factors (triggering satisfaction) (Matzler & Sauerwein, Citation2002). A high potential of satisfaction can be achieved only when all factors of satisfaction are fulfilled adequatly (Hinterhuber et al., Citation2003; Matzler, Citation2000). The concept of satisfaction applied to sports event visitors is quite common and has been widely discussed in scientific research. Accordingly, van Leeuwen, Quick, and Daniel (Citation2002) introduced the sport spectator satisfaction model, which uses the disconfirmation of expectations model (DEM) as its underlying concept. These event-related expectations are usually based on social contacts and individually desired experiences (Giannoulakis et al., Citation2007; Ralston, Buongiorno, & Fried, Citation2004).
Stakeholder theory and sports events
Sports event literature has underlined the importance of analyzing sports events in various ways and emphasized the need to shed more light upon the importance of such spectacles for all stakeholder groups (Tomlinson, Citation2002). The stakeholder theory (Mitchell, Agle, & Wood, Citation1997) — understanding stakeholders as the totality of all groups involved in and around an organization—has often been applied in the context of sports events. Parent (Citation2008) used four aspects of the stakeholder theory: Firstly, the relationships between an organization and its many stakeholders; secondly, the stakeholder theory’s concern with itself; thirdly, the intrinsic orientations of all stakeholders’ interests; and fourthly, the focus on managerial decision-making. Sports event literature has delivered a range of issues organizing committees have to deal with during the scheduling of an event, as shown by Parent and Deephouse (Citation2007). Other examples analyzing different stakeholders’ perspectives in the context of sports events were provided by Bazzanella, Peters, and Schnitzer (Citation2019) and Peters and Schnitzer (Citation2015), who assessed expectations, experiences, and (social) legacies as perceived by stakeholders (Reid, Citation2011). Literature on stakeholders in the context of international sports events has shown that scientific knowledge of perceived experiences is scarce, especially that considering co-creation activities of stakeholders in sports events and customer experience patterns of the respective stakeholders.
Mobile ethnography at sports events
The origins of ethnography as a qualitative research method are rooted in social and cultural anthropology (Hammersley & Atkinson, Citation1983; Stickdorn, Citation2014). Over the years, it has been influenced by other fields of research and their distinct methods. Hammersley and Atkinson (Citation1983) stated that its complex history makes it difficult to set a standard in ethnographic research; as it has been probed in different contexts, its original sense has been remodeled and reinterpreted to adapt the approach to certain circumstances. Stickdorn and Schneider (Citation2010) defined the meaning of ethnography as the “description of people”. It originated in the late 19th century as scholars observed social relationships, cultures, and human behavior. Ethnographic research patterns have found their way into economic research; however, they require more precise and crucial information through a more open and context-sensitive approach (Holloway, Brown, & Shipway, Citation2010). Traditional ethnographic research is often time- and cost-consuming when applied to projects with great spatial scope and temporal extension (Atkinson, Delamont, & Housley, Citation2008; Stickdorn, Frischhut, & Schmid, Citation2014). In contrast, mobile ethnography overcomes such issues by turning customers into researchers, who use mobile devices as self-reporting tools (Bosio et al., Citation2017). Several advantages, such as facilitating the examination of a higher number of persons at the same time, reducing costs, minimizing the influence of researchers, and recording real-time information about customers’ feelings and emotions, accompany mobile ethnographic research and set it apart from traditional qualitative research approaches gathering retrospective information (Hulkko, Mattelmki, Virtanen, & Keinonen, Citation2004; Stickdorn et al., Citation2014; Stickdorn & Frischhut, Citation2012). In general, many authors are of the opinion that examining experiences from a visitors’ or customer’s point of view necessitate a qualitative approach (Bosio & Prunthaller, Citation2018; Trischler & Zehrer, Citation2012), as customer experience cannot be measured with surveys or pre-defined categories. A more open approach is needed to analyze customer experience (Bosio et al., Citation2017). Therefore, mobile ethnography constitutes an ideal enhancement: By combining it with interviews, observations, and/or surveys, a mixed method approach can be established. Nevertheless, some challenges, such as the recruitment of participants or the time needed to instruct participants, arise (Hulkko et al., Citation2004). Even though mobile ethnography has increasingly been adopted in several industries, such as health, retail, tourism, and leisure (Bosio et al., Citation2017), a mixed method approach including mobile ethnography has not yet been applied to stakeholders of sports events.
Mixed methods in (sports events) literature
The initial purpose of introducing a mixed method approach was the mutual assurance and, above all, confirmation of results, which can be achieved by utilizing qualitative and quantitative research methods (Dunning, Williams, Abonyi, & Crooks, Citation2007). Research using mixed methods gained momentum in the late 1980s, but had been available since the 1950s (Dunning et al., Citation2007; McKim, Citation2017). The use of mixed methods to compare and validate data gathered with different methods has continuously been expanded in terms of scope so that today’s understanding of mixed methods goes much further. Furthermore, from today’s point of view, mixed method approaches serve to allow a better and deeper understanding of the results, to arrive at new approaches and perspectives in evaluation, and possibly to develop new survey instruments (Dunning et al., Citation2007; Tashakkori &Teddlie, Citation1998). The implementation of mixed method approaches is based on two principles: The confirmation and the deeper understanding of data. However, the confirmation of data might be difficult, as differing research methods and operationalizations are applied and the quantifiability of qualitative data is not given, which makes it difficult to draw conclusions. In order to overcome this problem, Mitchell (Citation1986) suggested searching for logical overlaps, regardless of the research method (qualitative or quantitative). This should help to better integrate the available data and foster a deeper understanding of the underlying data. Scientific literature has suggested that confirmation is linked to the second step of comprehension, indicating that they are not mutually exclusive (Dunning et al., Citation2007). Comprehension, however, accelerates a researcher’s understanding of a phenomenon investigated by using mixed method approaches (Morse, Citation2003).
The second goal of mixed methods is comprehension: It brings together qualitative and quantitative research approaches to provide a more comprehensive and detailed understanding of the phenomenon under review and/or explain certain anomalies in the data. Some interpret comprehension as actually accelerating a researcher’s understanding of a phenomenon (Morse, Citation2003). The explicit use of mixed methods in sports event research has been rare up to now, which in turn supports the present study’s objective to combine three fundamentally different methodological approaches.
Methods
Event research has predominantly carried out either quantitative or qualitative methodological approaches to gather information about consumer perceptions, experiences, or even satisfaction levels. Hence, the combination of research methods provides a more complete picture of experiences and satisfaction levels of event stakeholders. Indeed, quantitative or qualitative scientific surveys often fail to take into account highly subjective and emotional dimensions (Bosio et al., Citation2017; Meyer & Schwager, Citation2007; Schwarz, Citation2007) and are thus limited in allowing researchers to draw managerial implications from obtained data. The methodology used in this study will be outlined after a short description of the event context.
Contextual background
The International Children’s Games (ICG) are an international multi-sports event focusing on athletes aged between 12 and 15. The 7th winter edition was held in Innsbruck, Austria from January 12 to 15, 2016. The aim of the ICG is to facilitate peace and friendship among the world’s youth through sports. Thus, besides the sports competition program, a variety of cultural and educational projects involving athletes and local youths are organized. Apart from specific project-based initiatives, young people have the chance to attend live competitions, ceremonies, or other side events. Furthermore, young athletes are commonly accompanied by their parents and friends who support them when they are competing (Schnitzer, Schlemmer, & Kristiansen, Citation2017).
Study design
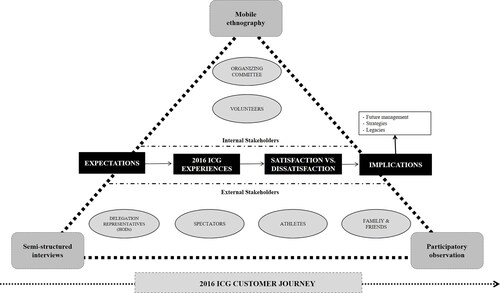
Initially, all relevant stakeholders (Parent & Deephouse, Citation2007) of the 2016 ICG that were present on-site and directly involved in the event were identified and divided into seven different groups: Members of the organizing committee (OC), volunteers, athletes, coaches, heads of delegation (HOD), family and friends (F&F), and spectators. These stakeholder groups were distinguished by the degree of organizational participation and assigned to an overarching “internal” group, consisting of volunteers and the OC, and a cumulated “external” group, consisting of athletes, coaches, HOD, F&F, as well as spectators.
Using the C/D-Paradigm, the second pillar of the study design differentiated between the stakeholders’ expectations prior to the event, experiences gained during the event, and finally, the outcome by matching expectations and gained experiences, which led either to satisfaction or dissatisfaction. illustrates the study design and integrates management implications, potential legacies, and strategic implications caused by satisfaction/dissatisfaction.
Figure 1. Study design and integration of the mixed method approach.
Research methods
A mixed method approach was chosen to provide a more complete view of the stakeholders’ experience at the 2016 ICG. The aim was to combine the strengths of both quantitative and qualitative data (McKim, Citation2017). Typical of a mixed method design is that one research method prominently informs the next (Teddlie & Tashakkori, Citation2009). The collection of mobile ethnography data started prior to the actual event in order to attract the attention of all stakeholders and give them the ability to express their expectations in advance of the 2016 ICG. The semi-structured interviews and participatory observations took place on site at the different event venues. Furthermore, basic demographic data and information on expectations were gathered on a quantitative level twice: First, when the stakeholders registered for the ExperienceFellow application; and second, at the beginning of the semi-structured interviews.
Mobile ethnography
The mobile ethnographic research was conducted with ExperienceFellow, a mobile ethnography app used for both data collection and analysis. This app allowed stakeholders to report on their expectations before the event as well as their experiences during and after the 2016 ICG by using their own mobile device. Research participants could download and install the app on their mobile devices anytime, anywhere. After downloading the app, the stakeholders had to enter socio-demographic data (gender, place of residence, stakeholder group). Afterwards, they were asked an open question about their expectations regarding the 2016 ICG; these had to be described in up to five words. Then, the user was unlocked for the project and started documenting his/her individual experiences as a sequence of touchpoints enriched by qualitative and quantitative data, such as text descriptions, photos, videos, and evaluations on a 5-point Likert scale. These ratings were made on a scale of −2 (very dissatisfied) to +2 (very satisfied) and could also be supplemented with individual comments, pictures, videos, or other files to document the experience. In addition, meta data, such as date, time, and geographical position (GPS), were recorded for each documented experience.
Semi-structured interviews
Semi-structured interviews with participants from each stakeholder group were used as an additional research method. The face-to-face semi-structured interviews () took between 15 and 30 minutes; potential interview partners were selected incidentally, using a convenience sample. As many people as possible, out of the different stakeholder groups, were approached directly during the certain events and at the Homebase on each day of the 2016 ICG, hence the willingness to participate was not as high as desired among the different stakeholder groups. The interview comprised four parts: Socio-demographic data and questions about expectations, experiences, and impressions. The interviews were conducted in German and/or English depending on the interviewees’ origin; the semi-structured interview guideline was tailored to the different types of stakeholders. The interviews ended with the open process-feedback question: “Do you have anything else to add?” Afterwards, the interviews were transcribed verbatim in their original language. In a next step, the interviews were translated by one of the bilingual authors; the translation was cross-checked to guarantee its accuracy.
Table 1. Characteristics of conducted interviews.
Participatory observations
As a third part of the mixed method approach, participatory observation was applied to this study. The OC officially accredited three researchers for the 2016 ICG as “University Staff”, granting them access to all event areas and elements (press conferences, VIP areas, competition sites, ceremony sites, etc.). This means that the observations provided insights into the daily operations and the hosting process. All event elements were observed from a spectator’s point of view with the observers paying strong attention to the physical elements (handshake etc.) of social actions and interactions between all stakeholders. Field notes were generated on a daily basis to observe and document practices and conspicuous features of all stakeholders. These notes were categorized into “daily highlights” and “daily lowlights”, which were discussed with the OC and helped them to respond immediately to any problems that had arisen. Due to the researchers’ continuous presence during the games, they gained extensive insights, which were beneficial for the evaluation and interpretation of the data.
A special feature of this work is that all three methods were applied prior to and during the event. Moreover, the feedback from the stakeholders obtained through mobile ethnography, interviews, and the scientists’ observations helped to improve the quality of the 2016 ICG; thus, these groups also acted as co-creators of the event.
Sample
Two teams of three researchers accompanied the whole event, attempting to gather as much data as possible and to address all stakeholder groups at all competition venues (Axamer Lizum, Ice Arena Götzens, Ice Arena Telfs, Muttereralmpark, Olympiaworld Innsbruck, and Seefeld Arena) as well as the Innsbruck Exhibition Center, where all cultural and side events took place. Various stakeholders were recruited to participate voluntarily in the research project. The researchers distributed information leaflets inviting all stakeholders to join the study. As an incentive for participation, respondents could enter a draw for prizes (e.g., merchandizing goods, shop vouchers).
In total, 199 people registered for the ExperienceFellow application; 103 (50.3%) of them (12 OC members; 55 volunteers; 19 athletes; 6 HODs/coaches; 8 F&F) actively took part in the mobile ethnographic research by synchronizing their data on individual experiences and perceptions with the app. The sample size may be considered as good for this application (Stickdorn et al., Citation2014). In total, 552 posts were uploaded, which reveals an average of 5.5 posts per person. Slightly more than half (51.5%) of the participants were female, and the mean age was 32.0 ± 15.3 years. Regarding the interviews, the scientists managed to gather 24 interviews featuring all stakeholder groups. While conducting these interviews, a sufficient level of saturation was achieved.
Analysis
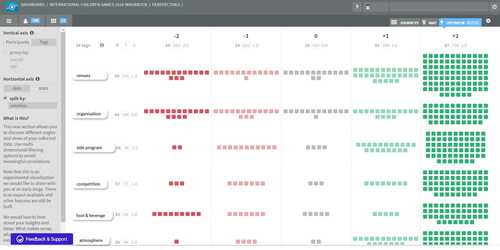
ExperienceFellow includes a mobile app, serving as a data collection tool for research project participants, as well as a web-based software for visualizing and analyzing the uploaded data. Researchers can create several sets of raw data to arrange and codify data according to different perspectives and apply deductive or inductive methods. Data are codified by adding tags to each uploaded touchpoint. This can be done either manually by the researchers after data collection (inductive) or during data collection by the participants with the help of tags predetermined by a researcher (deductive). The coding process is shown in . In general, the individual touchpoints are tagged to help locate them in the superordinate categories and also to compare them according to their number, individual ratings, and the resulting differences. The codification of experiences allows the researchers to condense the content of each single touchpoint and ascribe it to the most important subject areas.
Figure 2. Coding process of experiences, gathered prior to and during the 2016 ICG.
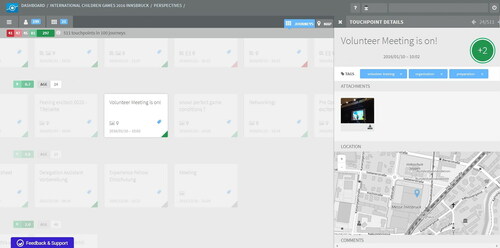
Besides the participants’ qualitative data (text, photos, videos) and quantitative evaluation (5-point Likert scale), researchers also used date, time, and geo-location for codification. gives an example of how participants expressed their experiences via ExperienceFellow.
Figure 3. Example of a coded touchpoint.
In this case, the data was codified in a multi-step inductive approach after data collection. Firstly, three researchers codified the data set separately to ensure researcher triangulation (Denzin, Citation2009). Secondly, the different tag sets were compared and synthesized to build one homogenous set. Thirdly, this inductively generated tag set was applied to codify one final data set. The codified data set was then visualized as sequential journey map and geographical heat map.
The evaluation of the interviews was based on content analysis, an approach that systematically analyzes all message types. A classification scheme was used to code the raw passages, allowing the researchers to explore large amounts of textual information, whilst ascertaining the analysis of trends and patterns within the words used in the interview, their relationships, and the structures and discourses of communication (Grbich, Citation2011). The researchers read and coded the raw material and assigned it to categories based on the data. The emerging findings were compared with the data again to verify correct understanding and finally discussed with colleagues.
Results
Internal stakeholders
Mobile ethnography data
The group of internal stakeholders (n = 67), comprising OC members and volunteers, shared 372 touchpoints via the app. First impressions showed the volunteers’ interest in the ICG’s supporting/social program with 73% positive experiences. A highlight of the opening ceremony was the “light man”; however, some stakeholders were disappointed with the lateness of the opening ceremony and the audience struggled to hear and understand the mayoral and state governor’s speeches, which boosted disinterest among visitors. Additional positive experiences were linked to the closing ceremony, the VIP journeys, and the appearance of the two 2016 ICG mascots. Only the live acts at the Homebase located at the Innsbruck Exhibition Center fell short of expectations and resulted in negative touchpoints.
Besides the supporting program at the Homebase, the catering found great approval and was rated with some negative touchpoints only. Overall, the volunteers shared many positive experiences (71%) regarding the venues—except for the Olympiaworld Innsbruck, which some rated negatively. The volunteers criticized the long waits and the transportation for the participants, whereas the transfers between the venues were problem-free. Another point of criticism was the shuttle between the venues in Seefeld and Innsbruck: “There should be a shuttle in the middle of the day from Seefeld back to the hotels. Some kids had finished their training already before lunch, and then waiting until 3.30 pm was too long.” (Volunteer, Austria, 22).
The atmosphere during the event was rated very positively (92% positive touchpoints) and was corroborated by the highly positive experiences with making new social contacts at the event; not even the bad weather on the first few days marred the mood. The competitions were also rated very positively (93%), and a high level of enthusiasm for the 2016 ICG awards ceremony was shown. The support of the delegations was indicative of great team spirit. Staying in Innsbruck was seen as a special experience with the wonderful surroundings as positive attributes; however, the organization of the accommodation received slight criticism. On the contrary, the internal stakeholders’ experiences with hosting the 2016 ICG as a certified “Green Event” were negative. The excessive consumption of drinking water, plastic, and food waste resulted in negative perceptions among the volunteers. Occasionally, there were internet connection problems at the venues, sparking heavy criticism. Finally, the volunteers saw the 2016 ICG as a unique experience and opportunity to generate new friendships; most volunteers reported personal benefits arising from their participation.
Like the volunteers, the members of the OC rated the venues and the catering positively; only the queues at certain venues and rotten fruit were deemed unpleasant. Most of the OC members’ touchpoints concerned the preparation phase (e.g., meetings, training, tasks) and were consistently rated positively. The lack of seats, forcing people to stand throughout the opening ceremony caused the only concrete negative perception. Overall, the members of the OC rated the 2016 ICG as a total success: “Amazing volunteers, amazing team, amazing people” (OC member, Austria, 28).
Semi-structured interviews
The majority of the internal stakeholders stated that their participation in the 2016 ICG was motivated by having fun, meeting new friends, gathering work experience, and learning about the culture of the host city: “I was part of the opening ceremony. The band and all the light effects, that was very spectacular” (OC member, Austria, 21). Their most exciting impressions were linked to the opening ceremony, the Homebase, and the teamwork among the volunteers, no matter which task they were given. Overall, the volunteers gained plenty of experiences and lasting perceptions of the culture and the domestic language of the host city.
The members of the OC were involved in organizing the ICG considerably earlier than the other stakeholder groups. Therefore, their experiences were mostly linked to tasks relating to event organization, followed by experiences with international visitors, the overall working experience, and being part of the OC. During the event, the OC members did not have much time to participate in the supporting programs or visit venues (with the exception of the venue managers). Summarizing, one OC member stated: “But we gave the best, and I think it went well” (OC member, Austria, 28). The OC members saw the atmosphere amongst them as professional; they were quite pleased with the work they had to perform on a daily basis and the opportunities arising from the ICG in Innsbruck.
Participatory observation
Observing the internal stakeholders allowed a different perspective. Overall, the volunteers seemed quite satisfied and managed to cope with their scope of duties, although they appeared to be slightly stressed at the beginning, when they had to organize and participate in the opening ceremony in addition to their actual tasks. Another issue was the lack of WiFi, which hindered the volunteers from sharing their experiences with their community and the researchers. Furthermore, the volunteers were sometimes upset about frequent transport delays. However, both volunteers and OC members seemed relieved and happy during the closing ceremony.
External stakeholders
Mobile ethnography data
The mobile ethnographic data of the external stakeholders (n = 33) showed 137 touchpoints (see ), including positive, neutral, and negative feedback. The athletes showed the most positive experiences (83.3% positive feedback), followed by the visitors (71.0% positive feedback) as well as the coaches and HODs (63.6% positive feedback). The highlight of the event was the opening ceremony, emerging as the experience with the most positive touchpoints; however, the late timing of the ceremony received negative comments: “The opening ceremony should have started and ended earlier because of the long bus ride back to the hotel and the competitions the next day” (Coach, Canada, 31). The coaches and HODs gave some negative feedback related to the venue. They especially criticized the chaotic implementation of the parallel slalom race at Axamer Lizum; they were impatient with the modus and questioned the fairness of the competition. The visitor as well as family members and friends confirmed these statements, emphasizing that bad luck in the team draw was a “chance killer”. Moreover, the coaches had many negative touchpoints regarding the lodgings and the unhealthy food (e.g., that no tap water, but only sugary drinks were provided at the distribution points); furthermore, breakfast and the absence of fruit were faulted. The athletes primarily rated three aspects positively: The lodgings (91%), the competitions (84%), and the Ice Arena Telfs (66%), which was a competition venue.
Semi-structured interviews
The ICG’s strict timetable and the short stay were an issue for many athletes that wanted to watch other competitions and have more time to experience as much as possible. The coaches did not know what to expect on their arrival in Innsbruck; eventually, their best-rated experience was the Homebase, a place created for the young athletes to spend time together and get to know children from other countries. Like the athletes, the coaches perceived the timetable as too tight as it prevented them from coordinating the schedule (e.g., to support other delegation mates).
The HODs had high expectations prior to the event in Innsbruck because of the professional registration process: “We had high expectations, because the whole registration process and the appearance of the website were very professional” (HOD, Switzerland, 54). Nevertheless, they had concerns about the social aspect and the overall fun factor. Again, the opening ceremony was one point of criticism: The HODs experienced the opening ceremony homogenously as slightly too long.
Family members and friends supporting their athletes also perceived the timetable as stressful as it did not allow them to watch different competitions: “As a father, I’d like to see my children compete and also see other competitions. However, the timetable often overlaps, and it is difficult to get from one venue to another” (F&F stakeholder, USA, 65). Furthermore, a more detailed and luxury offering for family members was requested; nevertheless, this stakeholder group accepted the focus on young athletes and the event’s social focus.
Participatory observation
Observing the external stakeholders revealed that the host city has proved its ability to organize major sports events. This may help Innsbruck in attracting new events. However, some negative impressions became apparent, such as the mode of the parallel slalom ski race, which led to displeased stakeholders since athletes of different levels were randomly put together in teams. Overall, differences in performance were visible in certain sports (e.g., ice hockey), implying different reasons for participating. For example, the ski team from Australia gained its first-ever racing experience during the ICG. Often, the tight time frame did not allow the athletes to watch and support delegation members competing in other sports. Additionally, the accompanying adults seemed to enjoy their trip, while their exuberant mood attracted attention.
Discussion
Event stakeholders experience and satisfaction
To answer the first research question, which relates to the main stakeholders’ perceptions along their event journey, the results were interpreted with the help of the C/D-Paradigm (Hinterhuber et al., Citation2003; Matzler, Citation2000; Oliver, Citation1980). The study revealed that the stakeholders experienced many positively rated touchpoints, indicating a high satisfaction level. Venues, the supporting program, competitions, and the atmosphere at the event were crucial categories that constituted high satisfaction levels; these factors also accounted for most of the touchpoints shared by all stakeholders.
Catering, transport, and organization can be seen as basal factors. The fact that they were missing or not satisfactory caused dissatisfaction among the stakeholders; however, these failings could not diminish the overall satisfaction with the event, which was irrespective of the stakeholder group. Nevertheless, individual experiences should be considered for further interpretation (Oliver, Citation1980). The competitions, daily work, and the atmosphere were identified as performance factors for the stakeholders’ experience. The excitement factors were limited to the event’s supporting program with the opening ceremony earning high satisfaction levels and positive feedback. Regarding catering and the supporting event program, the results did not reveal any statements; these factors constituted excitement factors with almost only positive feedback. The amount of work, the number of competitions, and the tasks involved were seen as stress factors, but did not influence the participants’ motivation. Although the amount of work did not impair motivation, it affected the participants’ experiences and perceptions. Generally, all stakeholders took away many subjective benefits from the 2016 ICG, which may have led to positive legacies.
This study confirms the findings of Ralston et al. (Citation2004) and Giannoulakis et al. (Citation2007) that the expectations for events mostly relate to social contacts and individual experiences. This underlines the importance of the posts showing that stakeholders were having fun and enjoying the atmosphere during the 2016 ICG. The atmosphere triggered many positive experiences, which chimes with the literature (Ralston et al., Citation2004). Nevertheless, the positive posts were mostly related to management patterns or social contacts, whereas experiences with the management were both negative and positive.
The results underline that all stakeholders had positive expectations for the event. If an event is able to fulfill exceed the expectations, this will lead to satisfaction; if not, it will lead to dissatisfaction (Oliver, Citation1980). However, satisfaction depends on multifarious factors, such as performance and excitement factors that come in addition to the basal factors (Matzler, Citation2000). Applying this premise to the event, satisfaction can be achieved only when the actual perceptions are better than the stakeholders’ individual expectations prior to the event. In the case of the 2016 ICG, the results show that the majority of the stakeholders’ expectations were fulfilled, leading to generally satisfied stakeholder groups.
Mixed method approach
The second research aim was to gather a deeper comprehension of processes among sports event stakeholders by applying a mixed method approach (mobile ethnographical application and interviews). provides an overview of data collected with the different methodological approaches. Moreover, it shows the most frequently mentioned positive (+) and negative (-) experiences of internal and external stakeholders and an overview of the most relevant categories.
Table 2. Overview of the results according to the respective survey method.
While all research methods yielded valuable and consistent data, mobile ethnography seems to have provided more detailed nuances regarding personal, technical, and organizational aspects. A possible explanation could be the in-situ data collection of mobile ethnography, which limits the effects of recall biases, consistency factors, or memory lapses, for which retrospective research methods such as the critical incident technique (Gremler, Citation2004) are often criticized. However, the interviews provided more data regarding interpersonal aspects such as teamwork. This might have been triggered by the interaction with the interviewer; finally, the interview outcome depends on the interviewing skills and interpersonal relationship between the interviewer and interviewee. Thus, the results might have been affected by interviewer bias or social desirability bias (Nederhof, Citation1985). Moreover, participants are unlikely to use mobile ethnography in stressful situations, as this would add more work to an already stressful situation.
As one single method may give only an isolated view of different stakeholders perceptions, mixed methods are useful to widen the perspectives and implications related to events (McKim, Citation2017). Previous research has stated that mobile ethnographic research is not affected by the subjects’ consideration of whether or not touchpoints are worthy of notification (Stickdorn et al., Citation2014). Due to the fact that the mobile application collects real-time information about experiences, the bias of possible changes of opinion could be reduced (Schwarz, Citation2007). Real-time data acquisition also allows an immediate reaction to certain issues crucially affecting (event-) touristic interests of the OC, the host city, and the destination by considering daily touchpoints. Consequently, this could change the way visitors report about the event (word of mouth, social media, etc.): As mistakes can be corrected immediately and inconveniences are unlikely to emerge, marketing-relevant event communication can be maintained more easily. This co-creation of the event helped as a control tool in the daily management. Moreover, stakeholders were given the opportunity to contribute to value creation (Horbel, Popp, Woratschek, & Wilson, Citation2016; Lusch & Vargo, Citation2006), report inconveniences, and thus enhance their experience by using the mobile application actively during the event.
Limitations
Even though the benefits of this study enrich the sports event literature, it has some limitations. First, mobile ethnography requires a mobile device and familiarity with it; in this context, several factors (age, education, income, etc.) can cause biased data. Stickdorn et al. (Citation2014) referred to the variety of influencing variables, which could falsify the evaluation of the touchpoints, linked to different types of stakeholders; e.g., millennials or high-income participants are more likely to own a smartphone. In this study, these influencing variables became evident by the number of participants in every stakeholder category and the quality of the touchpoints, which showed great differences. The second limitation is the high number of registered stakeholders who did not specify basic information such as age, nor share a touchpoint. In total, 103 out of 199 registered participants uploaded at least one experience. The third limitation comes with the detailed, but varied touchpoints, which sometimes made it impossible to interpret the participant’s perceptions. Even though every person with a mobile device can participate in the mobile ethnographic research, precise comprehension of the instructions is central to avoiding a high drop-out rate. The fourth and final limitation is that the selected stakeholders do not represent the whole picture; thus, future studies should consider more stakeholders.
Practical implications
An integral part of this research was the day-to-day intermediate analysis of the “daily highlights” and “daily lowlights” by briefly examining the collected data. These intermediate results were presented and discussed during the OC’s daily meetings. This was mutually beneficial as the OC could react to criticism during the event itself, while the researchers were able to collect more data from the external stakeholders on the aspects they perceived as important. The applicability and use of this approach is immense and should be fine-tuned in the future. Furthermore, the findings of this study underline the individuality and subjectivity of customer experience (Bosio et al., Citation2017; Meyer & Schwager, Citation2007). Moreover, the participants addressed direct touchpoints (satisfaction with competitions, etc.) as well as indirect touchpoints (problems with public transport, etc.), revealing influences on customer experience of both foci; the results supported findings of previous research (Bosio et al., Citation2017).
The practical relevance of the present study is that real-time evaluations of event participants can be monitored by appropriate bodies such as the OC; such bodies can react to this feedback immediately. Quick improvements can have a positive influence on stakeholders’ experiences and consequently on important factors such as the image of the destination. The adaptability and derivability of these real-time measurements and data also enable scientists to track people over an event cycle, to collect corresponding touchpoints, and thus to recognize the influences of certain actions.
Another implication refers to differences in the event perception of various stakeholder groups that are driven by different needs, past experiences, and thus differing expectations regarding the event. It is important to include these differences in both event planning and research.
Conclusion and further research
Surveying people with mobile ethnographic methods is a new approach in scientific research and has not yet found much attention in scholarly literature. The utilization of mobile devices combined with mobile ethnography research software allows greater insights into customer experiences and further provides real-time data. The importance of certain issues for destination management organizations is characterized by the number of independently uploaded touchpoints on the same subject.
Today’s communications tools, such as smartphones and designated research applications, allow researchers to employ promising and efficient methods when analyzing stakeholders’ perceptions during their event journey. As real-time feedback is crucial for event success, prompt reactions by the organizers not only increase service quality during the event, but also show stakeholders that their feedback leads to improvements in event delivery. Like many others, this specific aspect relating to event stakeholder feedback and increased service quality could be a promising research field in the future.
Declaration of conflicting interests
The author(s) declared no potential conflicts of interest with respect to the research, authorship, and/or publication of this article.
Acknowledgements
The authors thank Patrick Bauer, Philipp Müller, Lukas Nissen, and Felix Wöllner for their support in data collection and would like to thank the participants for their willingness to take part in the study.
Additional information
Funding
References
- Atkinson, P., Delamont, S., & Housley, W. (2008). Contours of culture: Complex ethnography and the ethnography of complexity. AltaMira Press.
- Bazzanella, F., Peters, M., & Schnitzer, M. (2019). The perceptions of stakeholders in small-scale sporting events. Journal of Convention & Event Tourism, 20(4), 261–286. doi:https://doi.org/10.1080/15470148.2019.1640819
- Bosio, B., & Prunthaller, S. (2018). Mobile ethnography as an innovative tool for customer experience research in tourism – A case of the tourism destination Upper Austria. ARA: Journal of Tourism Research/Revista de Investigación Turística, 8(2), 7–24.
- Bosio, B., Rainer, K., & Stickdorn, M. (2017). Customer experience research with mobile ethnography: A case study of the Alpine destination Serfaus-Fiss-Ladis. In: R.W. Belk (Ed.), Qualitative consumer research, Review of marketing research (pp. 11–137). Emerald Publishing.
- Chen, C.-F., & Chen, F.-S. (2010). Experience quality, perceived value, satisfaction and behavioral intentions for heritage tourists. Tourism Management, 31(1), 29–35. doi:https://doi.org/10.1016/j.tourman.2009.02.008
- Denzin, N.K. (2009). The research act: A theoretical introduction to sociological methods. Taylor and Francis.
- Dunning, H., Williams, A., Abonyi, S., & Crooks, V. (2007). A mixed method approach to quality of life research: A case study approach. Social Indicators Research, 85(1), 145–158. doi:https://doi.org/10.1007/s11205-007-9131-5
- Giannoulakis, C., Wang, C.-H., & Gray, D. (2007). Measuring volunteer motivation in mega-sporting events. Event Management, 11(4), 191–200. doi:https://doi.org/10.3727/152599508785899884
- Grbich, C. (2011). Qualitative data analysis: An introduction. Sage.
- Gremler, D.D. (2004). The critical incident technique in service research. Journal of Service Research, 7(1), 65–89. doi:https://doi.org/10.1177/1094670504266138
- Grohs, R., Wieser, V., & Pristach, M. (2020). Value cocreation at sport events. European Sport Management Quarterly, 20(1), 69–87. https://doi.org/10.1080/16184742.2019.1702708. doi:https://doi.org/10.1080/16184742.2019.1702708
- Hammersley, M., & Atkinson, P. (1983). Ethnography: Principles in practice. Tavistock.
- Hayes, M., Filo, K., Riot, C., & Geurin, A. (2019). Athlete perceptions of social media benefits and challenges during major sport events. International Journal of Sport Communication, 12(4), 449–433. doi:https://doi.org/10.1123/ijsc.2019-0026
- Hinterhuber, H. H., Handlbauer, G., & Matzler, K. (2003). Kundenzufriedenheit durch Kernkompetenzen: Eigene Potenziale erkennen, entwickeln, umsetzen. [Customer satisfaction through core competencies: Recognizing, developing, and implementing one’s potential]. Gabler Verlag.
- Holloway, I., Brown, L., & Shipway, R. (2010). Meaning not measurement: Using ethnography to bring a deeper understanding to the participant experience of festivals and events. International Journal of Event and Festival Management, 1(1), 74–85. doi:https://doi.org/10.1108/17852951011029315
- Horbel, C., Popp, B., Woratschek, H., & Wilson, B. (2016). How context shapes value co-creation: Spectator experience of sport events. The Service Industries Journal, 36(11-12), 510–531. https://. doi:https://doi.org/10.1080/02642069.2016.1255730
- Hulkko, S., Mattelmki, T., Virtanen, K., & Keinonen, T. (2004). Mobile probes. In: 3rd Nordic Conference on Human-Computer Interaction. New York: ACM, 43–51.
- Jaimangal-Jones, D. (2014). Utilising ethnography and participant observation in festival and event research. International Journal of Event and Festival Management, 5(1), 39–55. doi:https://doi.org/10.1108/IJEFM-09-2012-0030
- Lusch, R. P., & Vargo, S. L. (2006). The service dominant logic of marketing: Dialog, debate and directions. M.I. Sharpe.
- Matzler, K. (2000). Die Opponent-Prozess-Theorie als Erklärungsansatz einer Mehr-Faktor-Struktur der Kundenzufriedenheit. [The Opponent Process Theory as an Explanatory Approach for a Multi-Factor Structure of Customer Satisfaction]. Marketing ZFP, 22(1), 5–24. doi:https://doi.org/10.15358/0344-1369-2000-1-5
- Matzler, K., & Sauerwein, E. (2002). The factor structure of customer satisfaction: An empirical test of the importance grid and the penaltyreward-contrast analysis. International Journal of Service Industry Management, 13(4), 314–332. doi:https://doi.org/10.1108/09564230210445078
- McKim, C. A. (2017). The Value of Mixed Methods Research: A Mixed Methods Study. Journal of Mixed Methods Research, 11(2), 202–222. doi:https://doi.org/10.1177/1558689815607096
- Meyer, C., & Schwager, A. (2007). Customer experience. Harvard Business Review, 85(2), 116–126.
- Mitchell, E. S. (1986). Multiple triangulation: A methodology for nursing science. ANS. Advances in Nursing Science, 8(3), 18–26. doi:https://doi.org/10.1097/00012272-198604000-00004
- Mitchell, R.K., Agle, B.R., & Wood, D.J. (1997). Toward a theory of stakeholder identification and salience: Defining the principle of who and what really counts. Academy of Management Review, 22(4), 853–886. doi:https://doi.org/10.5465/amr.1997.9711022105
- Morse, J. M. (2003). Principles of mixed methods and multimethod research design. In A. Tashakkori & C. Teddlie (Eds.), Handbook of mixed methods in social and behavioral research (pp. 189–208). Sage Publications.
- Nederhof, A.J. (1985). Methods of coping with social desirability bias: A review. European Journal of Social Psychology, 15(3), 263–280. doi:https://doi.org/10.1002/ejsp.2420150303
- Oliver, R.L. (1980). A cognitive model of the antecedents and consequences of satisfaction decisions. Journal of Marketing Research, 17(4), 460–469. doi:https://doi.org/10.1177/002224378001700405
- Orefice, C. (2018). Designing for events – a new perspective on event design. International Journal of Event and Festival Management, 9(1), 20–33. doi:https://doi.org/10.1108/IJEFM-09-2017-0051
- Parent, M.M. (2008). Evolution and issue patterns for major-sport-event organizing committees and their stakeholders. Journal of Sport Management, 22(2), 135–164. doi:https://doi.org/10.1123/jsm.22.2.135
- Parent, M.M., & Deephouse, D.L. (2007). A case study of stakeholder identification and prioritization by managers. Journal of Business Ethics, 75(1), 1–23. doi:https://doi.org/10.1007/s10551-007-9533-y
- Peters, M., & Schnitzer, M. (2015). Athletes’ Expectations, Experiences, and Legacies of the Winter Youth Olympic Games Innsbruck 2012. Journal of Convention & Event Tourism, 16(2), 116–144. doi:https://doi.org/10.1080/15470148.2015.1018656
- Pine, B.J., & Gilmore, J.H. (1998). Welcome to the experience economy. Harvard Business Review, 76(4), 97–105.
- Prahalad, C.K., & Ramaswamy, V. (2004). Co-creation experiences: The next practice in value creation. Journal of Interactive Marketing, 18(3), 5–14. doi:https://doi.org/10.1002/dir.20015
- Ralston, R., Buongiorno, J., & Fried, J. (2004). Potential yield, return, and tree diversity of managed, uneven-aged Douglas-fir stand. Silva Fennica, 38(1), 55–70. doi:https://doi.org/10.14214/sf.435
- Ramaswamy, V., & Ozcan, K. (2014). The co-creation paradigm. Stanford University Press.
- Reid, S. (2011). Event stakeholder management: Developing sustainable rural event practices. International Journal of Event and Festival Management, 2(1), 20–36. doi:https://doi.org/10.1108/17582951111116597
- Schmitt, B. (1999). Experiential Marketing. Journal of Marketing Management, 15(1-3), 53–67. doi:https://doi.org/10.1362/026725799784870496
- Schnitzer, M., Schlemmer, P., & Kristiansen, E. (2017). Youth multi-sport events in Austria: Tourism strategy or just a coincidence? Journal of Sport & Tourism, 21(3), 179–199. doi:https://doi.org/10.1080/14775085.2017.1300102
- Schwarz, N. (2007). Retrospective and concurrent self-reports: The rationale for real-time data capture. In: S. Stone, S. Shiffman, S. Atienza, & L. Nebeling (Eds.), The science of real-time data capture: Self-reports in health research (pp. 11–26). Oxford University Press.
- Stickdorn, M. (2014). A review of ethnographic research in information systems. Academy of Management Proceedings, 2014(1), 13863. doi:https://doi.org/10.5465/ambpp.2014.13863abstract
- Stickdorn, M., & Frischhut, B. (2012). Service design and tourism: Case studies of applied research projects on mobile ethnography for tourism destinations. Books on Demand.
- Stickdorn, M., Frischhut, B., & Schmid, J.S. (2014). Mobile ethnography: A pioneering research approach for customer-centered destination management. Tourism Analysis, 19(4), 491–503. doi:https://doi.org/10.3727/108354214X14090817031198
- Stickdorn, M., Hormess, M., Lawrence, A., & Schneider, J. (2018). This is service design doing. O’Reilly.
- Stickdorn, M., & Schneider, J. (2010). This is service design thinking: Basics, tools, cases. BIS Publ.
- Tashakkori, A., & Teddlie, C. (1998). Mixed methodology: Combining qualitative and quantitative approaches. Sage Publications.
- Teddlie, C., & Tashakkori, A. (2009). Foundations of mixed methods research: Integrating quantitative and qualitative approaches in the social and behavioral sciences. Sage.
- Tomlinson, A. (2002). Theorising spectacle: Beyond Debord. In A. Tomlinson & J. P. Sugden (Eds.), Power games: A critical sociology of sport (pp. 44–60). Routledge.
- Trischler, J., & Zehrer, A. (2012). Service design: Suggesting a qualitative multistep approach for analyzing and examining theme park experiences. Journal of Vacation Marketing, 18(1), 57–71. doi:https://doi.org/10.1177/1356766711430944
- van Leeuwen, L., Quick, S., & Daniel, K. (2002). The sport spectator satisfaction model: A conceptual framework for understanding the satisfaction of spectators. Sport Management Review, 5(2), 99–128. doi:https://doi.org/10.1016/S1441-3523(02)70063-6
- Zehrer, A. (2009). Service experience and service design: Concepts and application in tourism SMEs. Managing Service Quality: An International Journal, 19(3), 332–349. doi:https://doi.org/10.1108/09604520910955339