
ABSTRACT
Deoxynivalenol (DON) is one of the most abundant mycotoxins and has adverse effects on several biological processes, posing risks of protein synthesis-disrupting effects and ribotoxic response. Therefore, chronic exposure to DON would fundamentally reshape the global expression pattern. Whether DON causes toxic effects on mRNA splicing, a fundamental biological process, remains unclear. In this study, we found that administration of the relative low dosage of DON dramatically changed the alternative splicing of pre-mRNA in HepG2 cells. The overall number of transcripts with aberrant selection of 3ʹ splice sites was significantly increased in DON-exposed HepG2 cells. This effect was further confirmed in two other human cell lines, HEK293 and Caco-2, suggesting that this DON-induced alteration in splicing patterns was universal in human cells. Among these DON-induced changes in alternative splicing, the expression levels of two related splicing factors, SF1 and U2AF1, which are essential for 3ʹ splice site recognitions, were strongly suppressed. Overexpression of either of the two splicing factors strongly alleviated the DON-induced aberrant selection of 3ʹ splice sites. Moreover, SF1 was required for human cell proliferation in DON exposure, and the restoration of SF1 expression partially reinstated the proliferation potential for DON-treated cells. In conclusion, our study suggests that DON, even at a low dosage, has great potential to change gene expression globally by affecting not only protein synthesis but also mRNA processing in human cells.
Introduction
The initial transcript is the mRNA precursor molecule (pre-mRNA), and the non-protein-coding introns must be removed and the exons spliced to form the mature mRNA. The process that transforms the mRNA precursor molecule to mature mRNA is pre-mRNA splicing [Citation1,Citation2]. Alternative splicing is the highly complex process in which regions of pre-mRNA molecules are joined or skipped in different ways, resulting in a variety of different mature mRNAs [Citation3]. Alternative splicing of pre-mRNA occurs in approximately 95% of human genes [Citation4,Citation5], and is an important mechanism leading to large differences in proteome diversity [Citation6,Citation7]. Indeed, differences in protein expression may be associated with different biological functions [Citation8]. Alternative splicing can also be associated with disease, such as Parkinson’s disease, schizophrenia and tumors [Citation9], because abnormal alternative splicing events may lead to disease states by interfering with normal cellular homoeostasis [Citation10].
mRNA splicing is mediated by the spliceosome. The spliceosome consists of five small nuclear ribonucleoproteins (U1, U2, U4, U5 and U6 snRNPs) and non-snRNP proteins [Citation11]. In general, three conserved sequences are necessary for splice site recognition by the spliceosome, namely, the 5ʹ splicing site, 3ʹ splicing site and branch point sequence (BPS) [Citation12]. It has been reported that U1 snRNP, U2AF (U2 snRNP auxiliary factor) and SF1 (splicing factor 1) are required for spliceosome assembly [Citation13]. U1 snRNP binds to the 5ʹ splicing site, U2AF is responsible for the recognition and binding of the 3′ splice site, and SF1 recognizes distinct sequences at the BPS, located 18 to 40 nucleotides upstream of the 3ʹ end [Citation14,Citation15]. In addition, accurately identified introns bound by SF1 and U2AF1 is implicated in alternative splicing decisions [Citation16]. Moreover, U2AF1 can interact with SF1, which is significant for early recognition and binding to the BPS. The SF3a complex is a crucial component of the spliceosome and is necessary for spliceosomal assembly. All of the SF3a components interact with a region upstream of the branch site [Citation17].
Deoxynivalenol (DON, also called vomitoxin) belongs to a group of type B trichothecenes and is the most frequent mycotoxin polluting grains such as wheat, barley and maize [Citation18]. DON has been shown to induce intestinal lesion formation, diarrhoea, vomiting, leukocytosis, and even death [Citation19,Citation20]. DON-contaminated food is harmful to human health [Citation21,Citation22]. Within several case reports, people could be exposed to these doses from polluted grains [Citation23,Citation24]. In China, DON and other trichothecene-infected cereals affecting 130,000 people during 1984–1991. In Kashmir Valley of India, several thousand individuals consuming rain-damaged mouldy wheat products suffered from severe gastroenteritis where DON was reported to be present in the range of 0.34–8.4 mg/kg [Citation25]. Some investigations showed that DON and its metabolites rapidly distributed in the kidney, heart, plasma. liver, thymus, spleen and brain at different concentration after exposure [Citation19,Citation26–Citation28]. The cytotoxic effects of DON have been studied in Caco-2, HepG2 and HEK293 cells, representing the intestine, liver and kidney, respectively [Citation29,Citation30]. At the molecular level, DON inhibits protein synthesis by binding to ribosomes, interfering with the peptidyl transferase function of the ribosomal subunit and consequently impairing translation initiation and elongation [Citation31]. DON has been shown to influence the transcription of genes encoding cytokines by inducing and activating transcription factors such as NF-kB, CREB and AP-1 [Citation32]. Meanwhile, mRNA splicing is thought to be an essential event in the transcriptional process of gene expression [Citation33,Citation34]. However, there is no further research on the alternative splicing of pre-mRNA for cells exposed to low dosage of DON, and the global impact on splicing needs to be explored in human cells.
In this study, Caco-2, HepG2 and HEK293 were chosen as model cell lines to address the occurrence of alternative splicing of pre-mRNA in DON exposure. RNA transcriptomic data were analysed to profile the gene expression patterns of HepG2 cells, showed that the administration of DON globally affected the utilizations or selections of 3ʹ splice sites in HepG2 cells. This was further confirmed by mRNA level analyses in HepG2, HEK293 and Caco-2 cells. Meanwhile, the protein levels of SF1 and U2AF1, associated with 3ʹ splice site recognitions, were apparently suppressed under DON exposure. Knockdown and overexpression of SF1 and U2AF1 demonstrated that they were involved in the recognition of 3ʹ splice site. Moreover, overexpression of SF1 and U2AF1 greatly weakened the selections of the alternative 3ʹ splice sites induced by DON exposure in human cells. Furthermore, the overexpression of SF1 restored the proliferation potential for HepG2 and HEK293 cells exposed to DON, whereas, SF1 knockdown resulted in severe impairment in HepG2 and HEK293 cells exposed to DON. In summary, DON globally affects the utilization of 3ʹ splice sites in human cells, and DON-induced aberrant selection of 3ʹ splice sites is speculated to be one of the potential mechanisms for the cytotoxicity of DON.
Results
DON globally reshapes RNA splicing in HepG2 cells
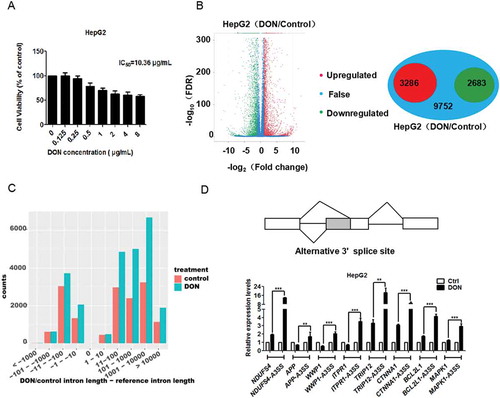
In this study, we employed RNA-seq to analyse the comprehensive modulation of gene expression in HepG2 cells with DON treatment. Before performing transcriptomics analysis, it was necessary to determine the concentration of DON in the administration of the cells. HepG2 cells were evaluated for cell viability by MTT assay after exposure to different concentrations of DON for 48 h. The relative cytotoxic effects were evaluated by calculating the concentration of DON that produced 50% inhibition of cellular proliferation (IC50), which was approximately 10 μg/mL (). The concentrations of DON were determined in which allowed about 80% of cell survival to minimize the effects of cells death and mimic the chronic exposure of the cells by DON. On the basis of MTT results, DON concentrations of 2 μg/mL were selected for subsequent experiments in HepG2 cells.
Figure 1. DON globally reshapes RNA splicing in HepG2 cells. (A) The cell viability of HepG2 cells after exposure to different concentrations of DON was measured using the MTT assay. The data (mean values ± standard deviations of five separate experiments) are presented as the fold-change with respect to the control group. (B) The mRNA expression profile was changed, and 5969 genes were differentially expressed in HepG2 cells in response to 2 μg/mL DON treatment. The green dots represent down-regulated genes, the red dots represent up-regulated genes, and the blue dots represent genes with no significance differences. (C) The length of the alternative splicing pre-mRNA has increased after DON exposure. The red column represents the length of the intron retained in the alternative variant, and the blue column represents the length of the intron retained in the alternative variant after DON treatment. (D) A schematic diagram of the alternative 3ʹ splice site. HepG2 cells were treated with DON or DMSO (as a control) for 48 h. The transcripts containing aberrant 3ʹ splice sites and normal mRNA transcripts were quantitated by reverse transcription quantitative PCR (RT-qPCR). The data (mean values ± standard deviations of three separate experiments) are presented as the fold-change with respect to the control group. Significant differences from the positive control and control groups are indicated by **P < 0.01 and ***P < 0.001.
HepG2 cells treated with DON and DMSO as the control sample were used for RNA-seq to analyse the DON-modulated gene expression. A total of approximately 119.5 and 111.5 million raw paired-end reads (150 x 2 base pair) were generated by the Illumina HighSeq 2500 platform for DON-treated and DMSO-treated control cells. After removal of adaptor, poly-N and low-quality reads, a final set of 114.7 and 106.1 million clean reads were obtained (supplementary Fig. 2). The sequencing depth of our study was double the amount of recommended depth for the transcript isoforms detection experiments from the ENCODE RNAseq Standards (https://genome.ucsc.edu/ENCODE/protocols/dataStandards/ENCODE_RNAseq_Standards_V1.0.pdf). Quality control analyses showed that the transcriptomic data had the high-quality score (Q20 > 97%), stable GC content and even distribution of reads (Supplementary Figure 1).
We previously reported DON caused G2/M cell cycle arrest by inducing the protein expression of ATF3ΔZip2a/2b, EGR1 and p21 [Citation35]. Also, DON induced the protein levels of P-glycoprotein (P-gp) by activating the mitogen-activated protein kinases (MAPK) pathways [Citation36]. Comparing with the control cells, the expressions of these genes in DON treated HepG2 cells also were up-regulated in RNA-seq data, suggesting that the RNA-seq data reflect genome-wide gene expression profiling in the tested samples. All the processed data were uploaded to Dryad with a DOI number, https://doi.org/10.5061/dryad.2rbnzs7hq.
To unravel the transcriptomic differences between DON-treated and control samples, differential gene expression analysis was conducted. We found that DON greatly changed the mRNA expression profile. DON exposure caused more than 2-fold increase in the mRNA expression levels of 3286 genes and more than 2-fold decrease in the mRNA expression levels of 2683 genes (). We examined the genes which were significantly affected in the mRNA levels by using the Gene Ontology database. GO annotation showed that these genes were involved in a variety of biological processes, such as the metabolic pathway, endocytosis, lipid acid metabolism and the p53 signalling pathway (Supplementary Figure 2), which were consistent with previous reports [Citation22].
Intensive alternative splicing for HepG2 cells was detected in DON treated cells, including 25,300 alternative 3ʹ splice site (A3SS), 18,569 alternative 5ʹ splice site (A5SS), 43,384 retained intron (RI) and 20,385 skipped exon (SE) events. For control group cells, we found 15,134 A3SS, 11,334 A5SS, 44,335 RI and 17,529 SE events, respectively. There were significantly more A3SS, A5SS and SE events for cells under DON treatment (Wilcoxon test, p < 2.2x10⁻¹⁶), whereas the number of RI was similar between DON and control samples (p = 0.07) (Supplementary Table 1). In this study, we focused on A3SS and explored the mechanisms and splicing factors associated with the recognition or selection of 3ʹ splice site.
Another interesting result from our RNA-seq analysis was that a considerable portion of the mRNA retained a large intron due to alternative splicing with the aberrant 3ʹ splice sites. The number of aberrant 3ʹ splice sites significantly increased under DON exposure (p < 0.001, Fisher’s exact test), and the aberrant splicing mainly produced large introns (). The functional pathway of these transcripts with introns > 10 kb were analysed using the Kyoto Encyclopaedia of Genes and Genomes (KEGG). We identified these genes that significantly participated in biological processes, such as the cGMP-PKG signalling pathway, cell cycle, pancreatic cancer, and endocrine resistance (all of the listed KEGG terms with p < 0.01) (Supplementary Table 2).
Furthermore, we selected genes with the abnormal 3ʹ splice sites and large introns to verify the alteration in the splicing pattern in HepG2 cells caused by DON exposure by real-time quantitative PCR. These genes are involved in several biological processes: TRIP12 (thyroid hormone receptor interactor 12) is involved in ubiquitin-mediated proteolysis; CTNNA1 (catenin alpha 1) is in the adherens junction; MAPK1 (mitogen-activated protein kinase) is in endocrine resistance; BCL2L1 (bcl2 like 1) is in pancreatic cancer; ITPR1 (inositol 1, 4, 5-trisphosphate receptor 1) is in the oestrogen signalling pathway; APP (amyloid beta precursor protein) and NDUFS4 (NADH: ubiquinone oxidoreductase core subunit S4) are in alzheimer’s disease, and WWP1 (WW domain containing E3 ubiquitin protein ligase 1) is in endocytosis. Our RNA-seq data showed that DON up-regulated the overall mRNA levels of TRIP12, CTNNA1, MAPK1, and BCL2L1, down-regulated the mRNA level of APP and had no significant effect on the mRNA levels of ITPR1, NDUFS4, and WWP1. But the levels of these alternative spliced transcripts of eight genes were all significantly up-regulated under DON treatment compared to normal transcripts in HepG2 cells (). Thus, irrespective of other effects of DON exposure on mRNA expression, these alternative spliced transcripts are up-regulated in HepG2 cells.
DON upregulates the alternative spliced transcripts with the aberrant 3ʹ splice sites in HEK293 and Caco-2 cells
The analysis of transcriptome data revealed that DON strongly induces alternative splicing with the aberrant 3ʹ splice sites in HepG2 cells. In addition, two extra human cell lines, Caco-2, and HEK293, were selected to confirm that this alteration in splicing in response to DON exposure was universal in human cells. The MTT assay was first conducted on HEK293 and Caco-2 cells after 48 h of exposure to DON. As shown in , the mean IC50 value of DON in HEK293 cells was approximately 900 ng/mL, while Caco-2 cells were more tolerant of DON. The administration of 400 ng/mL and 800 ng/mL DON to HEK293 and Caco-2 cells, respectively, had similar effects on cell viability. These transcript candidates harbouring aberrant 3ʹ splice sites in HepG2 cells were verified in these two additional cell lines (). All of them were confirmed to be significantly up-regulated in both cell lines, In conclusion, these results from three cell lines suggested that the number of aberrant 3ʹ splice sites were significantly increased under the exposure of DON.
Figure 2. DON upregulates the alternative spliced transcripts with the aberrant 3ʹ splice sites in HEK293 and Caco-2 cells. (A) The cell viability of HEK293 and Caco-2 cells after exposure to different concentrations of DON was measured using the MTT assay. The data (mean values ± standard deviations of five separate experiments) are presented as the fold-change with respect to the control group. (B) HEK293 and Caco-2 cells were treated with DON or DMSO (as a control) for 48 h, and the concentrations of DON were 400 ng/mL and 800 ng/mL, respectively. The alternative spliced transcripts with aberrant 3ʹ splice sites and normal mRNA were quantitated by RT-qPCR. The data (mean values ± standard deviations of three separate experiments) are presented as the fold-change with respect to the control group. Significant differences from the positive control and control groups are indicated by *P < 0.05, **P < 0.01 and ***P < 0.001.
DON inhibits the expression of splicing factors SF1 and U2AF1
Although DON induced the abnormal utilization of 3ʹ splice sites of pre-mRNA in human cells, the mechanism remains to be addressed. Transcriptomic and mRNA level analysis showed that many large introns were retained in different transcripts due to wrongly recognizing of the 3ʹ splice sites. This indicated that the process of alternative splicing, especially on such splicing factors related to the recognition of the 3ʹ splice site and BPS possibly was affected by DON administration. The expression of splicing factors positively or negatively regulates alternative splicing in eukaryotes [Citation37]. Therefore, we analysed whether these splicing factors such as U2AF complex, SF1 and SF3A1, were affected by DON treatment. The results showed that the protein expression of SF1 and U2AF1, which are essential for 3ʹ splice site recognition, was significantly decreased in HepG2, HEK293 and Caco-2 cells by DON exposure, but that of SF3A1 was not (). However, the mRNA levels of SF1 and U2AF1 were up-regulated 5–7 folds in DON treated cells by RT-qPCR (Supplementary Fig. 3F). The mRNA levels of U2AF and SF1 were increased as opposed to the down regulation at the protein level under DON exposure. This discrepancy requires to be further investigated, possibly due to the ribotoxic stress response caused by DON leading to the irrelevant correlations between mRNA levels and protein levels, or other regulatory promoting protein degradation. These results from three cell lines suggest that DON, possibly acting as a splicing inhibitor, suppresses the protein levels of SF1 and U2AF1, decreases the efficiency of intron recognition or splicing, and consequently, results in the abnormal recognitions of 3ʹ splice sites of pre-mRNA in human cells. To determine whether DON induced the utilization of the aberrant 3ʹ splice sites of pre-mRNA in human cells by suppressing the protein levels of both splicing factors, we knocked down the expression levels of SF1 in three human cells by either shRNA or siRNA. The knockdown efficiency of SF1 was confirmed by western blot () and RT-PCR (Supplementary Fig. 3A). sh-SF1 in HepG2 cells clearly increased the mRNA expression of alternative spliced transcripts harbouring the aberrant 3ʹ splice sites (). Similar findings have been obtained by stably knocking down U2AF1 in HepG2 cells by shRNA. The knockdown efficiency of U2AF1 was confirmed by western blot () and RT-PCR (Supplementary Fig. 3E). Furthermore, there was no cumulative effect of SF1- and U2AF1-knockdown cell lines exposed to DON (). These results indicated that suppressing the protein levels of SF1 and U2AF1 resulted in the preference of intron recognition at the abnormal 3ʹ splice site of pre-mRNA in cells exposed to DON.
Figure 3. DON inhibits the expression of splicing factors SF1 and U2AF1. (A) Western blotting assay of endogenous expression of SF1, U2AF1, SF3A1 in HepG2, HEK293 and Caco-2 cells treated with different concentrations of DON for 48 h. The concentrations of DON were 2 μg/mL, 400 ng/mL and 800 ng/mL, respectively. Cell lysates prepared from cell lines, as indicated, were subjected to SDS-PAGE and detected with antibodies against SF1, U2AF1, SF3A1 and GAPDH (as a control). (B) Western blotting assay of SF1 expression in HepG2 cells after stably knocking down SF1. HEK293 and Caco-2 cells were transfected with 20 nM negative control or SF1 siRNA for 48 h. Cell lysates prepared from cell lines, as indicated, were subjected to SDS-PAGE and detected with anti-SF1 and GAPDH (as a control). (C) Knocking down SF1 up-regulated the alternative spliced transcripts with the aberrant 3ʹ splice sites in HepG2, HEK293 and Caco-2 cells, and the mRNA levels of transcripts with aberrant 3ʹ splice sites were quantitated by RT-qPCR. (D) Western blotting assay of U2AF1 expression in HepG2 cells after stably knocking down U2AF1. Knocking down U2AF1 up-regulated the alternative transcripts with the aberrant 3ʹ splice sites in HepG2 cell lines, and the mRNA levels of transcripts with aberrant 3ʹ splice sites were quantitated by RT-qPCR. (E) HepG2 cells with stable knockdown of SF1 or LACZ were exposed to 2 μg/mL DON, and the mRNA levels of transcripts with aberrant 3ʹ splice sites were quantitated by RT-qPCR. (F). HepG2 cells with stable knockdown of U2AF1 or LACZ were exposed to 2 μg/mL DON, and the mRNA levels of transcripts with aberrant 3ʹ splice sites were quantitated by RT-qPCR. (G) Analysis of the SF1, CYP3A4, CYP1A1 and U2AF1 promoters in HepG2 cells treated with DON. HepG2 cells were transiently transfected with the luciferase reporter plasmids pGL3-Basic as the negative control, or transfected with the plasmids containing the various promoter DNA, such as 2.5 kb DNA fragment upstream of SF1 ORF, 4.3 kb DNA of CYP3A4, 2.8 kb of CYP1A1, or 2.5 kb of U2AF1 ORF, which all are upstream of the ORF and the start codon ATG is defined as +1 position as the promoter constructs, respectively. The Renilla luciferase reporter plasmid pRL-TK was cotransfected into cells as a normalization control. Each construct experiment was performed in triplicate, and the results of three independent experiments are presented. The data (mean values ± standard deviations of three separate experiments) are presented as the fold-change with respect to the control group. Significant differences from the positive control and control groups are indicated by *P < 0.05, **P < 0.01 and ***P < 0.001.
To study if the expression of these two splicing factors were suppressed related to transcription, we employed the dual luciferase assay to analyse the promoter activity of SF1 and U2AF1 in HepG2 cells treated with DON, with two cytochrome P450 (CYP) genes as the different types of control. Each promoter plasmid and a reference plasmid, pRL-CMV harbouring the Renilla luciferase gene, were cotransfected into HepG2 cells. The quantitative analysis showed the promoter strengths of SF1, CYP3A4, CYP1A1 and U2AF1 relative to that obtained with the empty vector. The promoter regions of 2.5 kb of SF1 and U2AF1 had very strong transactivation activity among all of the constructs. However, the relative luciferase activity was decreased approximately 50%-70% by DON treatment in comparison with the respective controls which were treated by DMSO. The relative luciferase activity of CYP1A1 was increased by 2-fold by DON treatment compared with the control, but the relative luciferase activity of CYP3A4 was stabilized. These results strongly suggest that DON inhibits the expression of splicing-related factors, SF1 and U2AF1 by repressing promoter activation at the transcriptional level.
Overexpression of SF1 and U2AF1 weakens the alternative selection of 3ʹ splice sites under DON exposure
To further analyse whether SF1 was involved in the abnormal 3ʹ splice sites of pre-mRNA after exposure to DON, we overexpressed SF1 in different cell lines. The expression of SF1 was verified by western blot and RT-PCR (Supplementary Fig. 3C and 3E). The results showed that the overexpression of SF1 strongly inhibited the selection of the aberrant 3ʹ splice sites which were elicited by DON administration in the cells (). Deeper analysis was required before we concluded that DON elicited the abnormal selection of 3ʹ splice sites of pre-mRNA in HepG2 cells by down regulating the protein level of SF1. We overexpressed SF1 in HepG2 and HEK293 cells, and 24 h post-transfection, DON was administrated into the cell culture for 48 h. Gradually increased amounts of SF1 dramatically weakened the induced mRNA expression of the transcripts with the aberrant 3ʹ splice sites in SF1 knockdown cell lines, and the expressed amount of SF1 was confirmed by western blot (). Subsequently, increased amounts of SF1 were expressed in HepG2 cells treated with DON. The gradually increased amounts of SF1 weakened the expression of transcripts harbouring the aberrant 3ʹ splice sites caused by the DON exposure (). These results indicate that DON induces the abnormal 3ʹ splice sites choices via suppressing the expression of SF1. The same pattern was observed in HepG2 cells when U2AF1 was overexpressed (). Accordingly, we concluded that the overexpression of SF1 and U2AF1 could rescue the selection of the aberrant 3ʹ splice sites induced by DON treatment.
Figure 4. Overexpression of SF1 and U2AF1 weakens the alternative selection of 3ʹ splice sites under DON exposure. (A) HepG2, HEK293 and Caco-2 cells were transfected with 2 μg of SF1 expression vectors using Effectene (Qiagen), and the mRNA levels of transcripts with aberrant 3ʹ splice sites were quantitated by RT-qPCR. (B) SF1-knockdown HepG2 cells were transfected with increasing amounts of SF1. Cell lysates prepared from cell lines, as indicated, were subjected to SDS-PAGE and detected with anti-SF1 and GAPDH (as a control). The mRNA levels of transcripts with aberrant 3ʹ splice sites were quantitated by RT-qPCR. (C) HepG2 cells were first transfected with increasing amounts of SF1 for 24 h and then treated with 2 μg/mL DON for 48 h. Cell lysates prepared from cell lines, as indicated, were subjected to SDS-PAGE and detected with anti-SF1 and GAPDH (as a control). the mRNA levels of transcripts harbouring aberrant 3ʹ splice sites were quantitated by RT-qPCR. (D) HepG2 cells were transfected with 3 μg U2AF1 for 24 h and then treated with 2 μg/mL DON for 48 h. Cell lysates prepared from cell lines, as indicated, were subjected to SDS-PAGE and detected with anti-U2AF1 and GAPDH (as a control). the mRNA levels of transcripts harbouring aberrant 3ʹ splice sites were quantitated by RT-qPCR. The data (mean values ± standard deviations of three separate experiments) are presented as the fold-change with respect to the control group. Significant differences from the positive control and control groups are indicated by *P < 0.05, **P < 0.01 and ***P < 0.001.
SF1 weakens the cytotoxic effect of DON in cell proliferation
Our study suggests that DON has great potential to change gene expression globally through 3ʹ splice site processing and that SF1 can alleviate the aberrant selection of 3ʹ splice sites induced by DON in human cells. Therefore, we further investigated whether SF1 participates in regulating DON-related pathways. Cell proliferation is involved in the underlying mechanism of the cytotoxicity of DON [Citation38]. SF1 knockdown in HeLa cells by siRNA transfection was shown to substantially reduce cell proliferation [Citation39,Citation40]. The importance of SF1 in the effect of DON exposure on cell proliferation was unknown. We leveraged this pathway as the basis for testing the importance of SF1 and the cytotoxicity of DON. We overexpressed SF1 in HepG2 and HEK293 cells, and 24 h post-transfection, DON was added to the medium at various concentrations for 48 h. Cell proliferation was measured by an MTT assay. SF1 overexpression could restore the proliferation potential of HepG2 and HEK293 cells exposed to DON. Our study demonstrated that introduced SF1 significantly promoted proliferation compared to that of the control cells exposed to DON (). To further investigate the relationship between DON and SF1 in cell proliferation, we selected siRNA to knock down the expression of SF1 and detected the proliferation of cells exposed to DON. The proliferation of SF1-knockdown HepG2 and HEK293 cells treated with DON was severely impaired, which was in agreement with the previous results (). Based on the observations of human cell proliferation, we correlated the rescue potential for SF1 proteins in DON-exposed cells. It might be speculated that DON-induced abnormal selection of 3ʹ splice sites is a potential mechanism for the cytotoxicity of DON in cell proliferation.
Figure 5. SF1 weakens the cytotoxic effect of DON in cell proliferation. (A) HepG2 and HEK293 cells were first transfected with 2 μg SF1 for 24 h and then treated with 2 μg/mL or 400 ng/mL DON for 48 h, respectively. Subsequently, the cell viability of both cells with the overexpression of SF1 was measured using the MTT assay. (B) SF1-knockdown HepG2 cells was treated with 2 μg/mL DON for 48 h. The HEK293 cells were first transfected with 20 nM negative control or SF1 siRNA for 24 h and then treated with 400 ng/mL DON for 48 h. The cell viability of HepG2 and HEK293 cells after exposure to different concentrations of DON was measured using the MTT assay. The data (mean values ± standard deviations of five separate experiments) are presented as the fold-change with respect to the control group. Significant differences from the positive control and control groups are indicated by *P < 0.05, **P < 0.01 and ***P < 0.001.
Similar aberrant splicing events between the cells with DON exposure or harbouring U2AF1 S34F mutation
Our study showed that DON induced the abnormal utilization of 3ʹ splice sites and affected cell proliferation by inhibiting the expression of splicing factors. It was reported that 3ʹ splice site selections may affect cell proliferation and survival [Citation41,Citation42], especially in the context of cancer or MDS. MDS are a heterogeneous group of haematopoietic stem cell disorders characterized by dysplastic blood cell formation and peripheral blood cytopenia. It was reported that MDS correlated highly with the mutations of splicing factor U2AF1, and led a higher number of aberrant splicing events in the myeloid cells [Citation43]. Indeed, each major splicing factor mutation has been demonstrated to alter a large number of splicing events in cellular [Citation44]. The U2AF1 S34F mutation induces lineage-specific splicing alterations in myelodysplastic syndromes [Citation45]. Expression data of the previous study was downloaded from Gene Expression Omnibus (accession GSE94153). We found both U2AF1 S34F and DON exposure induced aberrant splicing events in highly similar genes sets for A3SS (Chi-Square test, p < 2.2x10⁻¹⁶; ). Identification the connection between DON and splicing factors mutations will be helpful to understand how these transcripts contribute to cell proliferation or MDS pathogenesis. Furthermore, we found both U2AF1 S34F and DON exposure induced genes were significantly enriched in participation of several biological processes, such as the mRNA surveillance pathway, ubiquitin mediated proteolysis, cell cycle, and TNF signalling pathway (all of the listed KEGG terms with p < 0.001) (Supplementary Table 4).
Figure 6. Similar aberrant splicing events between DON exposure and U2AF1 S34F mutation. Venn diagram of genes with aberrant alternative 3ʹ splice sites for cells under DON exposure and U2AF1 S34F mutation.
Discussion
Pre-mRNA splicing is an essential event in the co-/post-transcriptional process of gene expression and thought to be one of the most versatile mechanisms to increase proteome diversity through alternative splice site choices [Citation34,Citation46]. Abnormal alternative splicing is associated with disease and biological processes [Citation47]. In this study, we employed RNA-seq to analyse biological processes under the influence of DON exposure to HepG2 cells. The RNA-seq data again confirmed that DON-affected genes were involved in the mitochondrial stress response, MAPK phosphorylation, cell proliferation, differentiation and excessive inflammatory reaction, which were in agreement with previous studies [Citation35,Citation36]. Moreover, we found that even conditioned in the low dosage exposure of DON, the alternative splicing of pre-mRNA in HepG2 cells were dramatically changed, especially in several alternative splicing patterns such as the alternative 3ʹ splice site, the alternative 5ʹ splice site and the skipped exon of pre-mRNA.
According to the RNA-seq data, the portion of the mRNA retained a large intron caused by the utilization of the aberrant 3ʹ splice site (Supplementary Table 1), was significantly increased in the cells with DON exposure. By choosing several specific A3SS targets and detecting the changes of these A3SS transcripts, we confirmed that the aberrant utilization of 3ʹ splice sites of pre-mRNA was significantly increased by DON (). In addition, the conclusion is supported by the analyses in HEK293 and Caco-2 cells (). It is well accepted that U2AF1 and SF1 initially recognize the 3ʹ splice sites and branch region respectively, and SF3A1 can also bind to a region of the branch site [Citation48,Citation49]. Intron misrecognition of the 3ʹ splice site or decreased splicing efficiency is recognized as the main cause of the retention of large introns during the process of pre-mRNA splicing. Our study aims to characterize SF1, U2AF1 and SF3A1, which were associated with the 3ʹ splice sites of introns and were involved in the 3ʹ splice sites of pre-mRNA exposed to DON. First, SF1 and U2AF1 protein expression levels in HepG2, HEK293 and Caco-2 cells all significantly decreased in response to DON exposure. Instead, there were no significant changes in SF3A1 (). It suggests that DON selectively affects expression of some splicing factors. It is generally accepted that the amount of a protein decreases when the transcription of its encoding gene is reduced. However, there are other mechanisms regulating the protein’s abundance. For instance, the protein’s half life could be regulated by post-translational modifications. Another possibility was that its mRNA process of translation was more inhibited from the cellular stresses [Citation50]. Therefore, the full scenario of splicing factor expression in DON administrated human cells requires further clarification in protein levels, although transcriptomic data suggested some of them are up-regulated. Previous studies have shown that the correlation between mycotoxin transcriptomics and proteomics is fairly weak [Citation47]. The regulation of transcription and translation could be differently regulated under trichothecene exposure [Citation51]. Therefore, the protein expressions of U2AF1 and SF1 rather of their mRNA levels were chosen to correlate with the functions in alternative splicing under DON exposure. Second, knocking down SF1 and U2AF1 in HepG2, HEK293 and Caco-2 cells significantly increased the levels of the targeted transcripts with the aberrant 3ʹ splice sites (,). This suggests that failed to maintain the leverage of these two key splicing factors, possibly causes the severe outcomes for the cells by reshaping the splicing pattern, especially in the selection of 3ʹ splicing sites and 5ʹ splicing sites. Third, the effects of gradually increasing amounts of SF1 proportionally minimized the expression of transcripts with the aberrant 3ʹ splice sites (). Also, overexpression of U2AF1 inhibited the aberrant selection of 3ʹ splice sites induced by DON. The specificity of the response indicates that the rebuild of homoeostasis of splicing factors like U2AF1 or SF1 may ameliorate DON-induced aberrant 3ʹ splice sites events through increasing the protein expression of splicing factors. These results support a role for SF1 and U2AF1 in the 3ʹ splice sites of pre-mRNAs that might provide novel and important insights regarding the molecular mechanisms involved in DON exposure. However, the expression of other splicing factors is required to address in DON exposure to human cells, and this possibly benefits us to better understand the changes in different alterative splicing patterns, if considering DON as a splicing inhibitor. There are many splicing factors that are altered in mRNA levels under DON treatment (Supplementary Table 3), and it has been reported that the expression or the modifications of some splicing factors can induce alternative splicing [Citation52,Citation53]. In this study, we are only able to conclude that, DON caused the abnormal utilization of 3ʹ splice sites of pre-mRNA by repressing the expression of SF1 and U2AF1. Whether DON could affect the expression of other splicing factors, being associated with SF1 or U2AF1, remains to be explored further in many respects.
In general, abnormal alternative splicing transcripts could interfere with normal cellular homoeostasis, leading to disease states [Citation10]. DON increased the aberrant selection of 3ʹ splice sites in human cells, and it might be speculated that DON-induced utilization of the aberrant 3ʹ splice sites is a potential mechanism for the cytotoxicity of DON. DON affects the utilization of 3ʹ splice sites by down regulation of SF1 protein amount, and the overexpression of SF1 could rescue the DON-induced the aberrant selection of 3ʹ splice sites in human cells. Here, we chose SF1 as the object of study to verify whether SF1 could ameliorate the cytotoxicity of DON in cell proliferation. SF1 overexpression restored the proliferation potential of HepG2 and HEK293 cells exposed to DON (). In contrast, SF1 knockdown severely impaired the proliferation of HepG2 and HEK293 cells treated with DON (). These results indicate that SF1 is required for cell proliferation after DON exposure. Furthermore, it has been suggested that MDS highly correlated to the mutation of U2AF1 S34F [Citation45]. It is interesting that both U2AF1 S34F and DON exposure induced aberrant splicing events in highly similar genes sets for A3SS. KEGG analysis showed that the sets of transcripts with the aberrant 3ʹ splice sites, influenced by U2AF1 S34F and DON exposure, were involved in various important biological processes (Supplementary Table 4). It might be speculated that the long term exposure of DON possibly has the risk of MDS development, likely caused by U2AF1 mutations, which remains to be further investigated in animal models.
In summary, transcriptomic analysis reveals that DON has great potential to change gene expression during mRNA processing. DON could induce the aberrant selection of 3ʹ splice sites of pre-mRNA by repressing the protein levels of SF1 and U2AF1, which are essential for 3ʹ splice site recognitions. Overexpression of SF1 and U2AF1 obviously antagonized the DON-induced aberrant selection of 3ʹ splice sites. Furthermore, SF1 overexpression rescues the proliferation of human cells treated continuously with DON. It could be speculated that 3ʹ splice sites selection is one of the potential mechanisms of the toxic effects of DON on cell proliferation. Our study provides the first insight into the use of DON as a selective inducer targeting 3ʹ splice sites in mRNA processing, and exposure to DON even at low dosage possibly strongly threatens the animal and human health.
Materials and Methods
Reagents, cells, and antibodies
Deoxynivalenol (DON) and dimethyl sulphoxide (DMSO) were purchased from Sigma Aldrich Company (St. Louis, MO, USA). Puromycin and TRIzol reagents were obtained from Life Technologies (Invitrogen, Carlsbad, CA). HepG2 cells (ATCC, HB-8065), HEK293 cells (ATCC, CRL-1573) and Caco-2 cells (ATCC, HTB-37) were grown in a basal medium consisting of Dulbecco’s modified Eagle medium (DMEM) (Invitrogen, Carlsbad, CA) supplemented with 10% foetal bovine serum (PAN, German). Transfections were performed with Lipofectamine 3000 reagent (Invitrogen). Primary antibodies against SF1 (Santa Cruz, sc-398,881), Myc (Cell Signalling, #2278), Flag (Sigma, F7425) and GAPDH (Santa Cruz, sc-32,233) as the secondary antibodies anti-rabbit IgG HRP-linked antibody (Cell Signalling, 7074V) and anti-mouse IgG HRP-linked antibody (Cell Signalling, 7076V) were used. All chemicals were of analytical grade.
Cytotoxicity assay
The MTT assay [Citation42] was performed to determine the cytotoxicity after exposure to DON in the aforementioned cell lines. Briefly, approximately 5 × 10³ cells in each well were seeded in 96-well plates. The cells were treated with various concentrations of DON for 48 h, and the medium was then replaced by fresh medium containing 20 μL of 5 mg/mL MTT solutions. After 3–4 h of incubation, 150 μL of DMSO was added to dissolve the formazan. The absorbance was measured with a microplate reader at 490 nm.
Construction of plasmids and transfection
The transcript cDNAs for SF1 and U2AF1 were amplified according to GenBank. The SF1 PCR fragments digested by BamH I (Takara, 1010A) and Hind Ⅲ (Takara, 1060A) were ligated into restriction enzyme-digested pcDNA3.1 (-) plasmid with a Myc epitope tag (Invitrogen). The U2AF1 PCR fragments digested by BamH I (Takara, 1010A) and Not I (Takara, 1166A) were inserted into pcDNA4.0 plasmid with a FLAG pepitope tag and mVenus tag (Invitrogen). The primers used for plasmid constructs were as follows: SF1-F: CGCGGATCCATGGCGACCGGAGCGAACGCC; SF1-R: CCCAAGCTTGTTCTGTGGTGGAGGCGGTGGG; U2AF1-F: CGCGGATCCATGGCGGAGTATCTGGCCTCCATC; U2AF1-R: ATAAGAATGCGGCCGCGAATCGCCCAGATCTTTCACGAT. Plasmids for transfection were prepared by the Endo-Free Plasmid Kit (Omega) according to the manufacturer’s instructions. Transfection experiments were performed on cells at 60-80% confluency. Different concentrations of plasmids and Lipofectamine 3000 reagent (Invitrogen) were cotransfected and maintained for 24 h according to the manufacturer’s instructions. After 24 h incubation for transfection, the cells were administrated by DON with the determined concentrations or DMSO as the control in different cell lines for 48 h.
Luciferase activity detection and RNA interference
The 5ʹ-flanking region from −2500 to −1 construct (the translational start site was designated +1) of human SF1 and U2AF1 were amplified by using human genomic DNA from HepG2 cells by PCR and cloned into pGL3 plasmids upstream of firefly luciferase gene. Similarly, we amplified human CYP3A4 (from −4300 to −1), human CYP1A1 (from −2800 to −1). HepG2 cells were seeded into 24-well plates and cultured in DMEM until 80% confluence. For transfection reporter constructs of SF1, CYP3A4, CYP1A1 and U2AF1, 0.6 μg of firefly luciferase reporter plasmids and 0.06 μg of Renilla luciferase reporter plasmid (PRL-TK) were incubated with 1.5 μL of Lipofectamine 3000 (Invitrogen). The transfected cells were lysed after 24 h of incubation, and the reporter luciferase activity was measured with the dual luciferase reporter assay system (Promega) according to the manufacturer’s instructions. All experiments were performed three times independently.
siRNAs targeting SF1 and U2AF1 were designed and synthesized by GenePharma (Suzhou) with sequences of 5ʹ-GCUCAGGAUAAAGCACGGAUGGAUA-3ʹ and 5ʹ-CUGCUAGAAAGUGUUGUAGUU-3ʹ, respectively, along with a negative control. siRNA at 40 pmol was transiently transfected into HepG2, HEK293, and Caco-2 cells using Lipofectamine 3000 (Invitrogen) according to the manufacturer’s instructions. Cells were lysed after 48 h of incubation and subsequently analysed by western blotting for the stable expression of short-hairpin RNA (shRNA), which were then processed in vitro to generate siRNA targeting SF1 mRNA. The pSuper.Retro.Puro vector encoding the SF1 shRNA sequence (5ʹ-CGTAGCATCGAGTGTCTTCTT-3ʹ) and U2AF1 shRNA sequence (5ʹ-GAAAGTGTTGTAGTTGATTGA-3ʹ) were transfected into HepG2 cells. The knockdown efficiency of SF1 and U2AF1 was validated by western blotting and RT-PCR.
RNA isolation and RT-PCR analysis
RT-PCR analysis was performed on cDNA derived from HepG2, HEK293, and Caco-2 cells to determine the expression of human SF1 and GAPDH and the transcript mRNAs with 3ʹ alternative splice sites. Cells were harvested for total RNA extraction using TRIzol Reagent (Invitrogen). After DNase I (New England Biolabs) treatment, 2 μg of total RNA for each sample was reverse-transcribed to complementary DNA (cDNA) using M-MLV Reverse Transcriptase (Promega). Real-time RT-PCR was performed on a Biorad Icycler. The standard reaction volume was 25 µL, which contained 12.5 µL of SYBER Green, 1 µl of 300 ng cDNA template, 1 µL of the forward/reverse primer and 9.5 µL of water. The initial step of RT-PCR was 3 min at 95°C. The cycles (n = 40) consisted of a 10 s melt at 95°C, followed by a 45 s annealing/extension at 53°C. The final step was incubation at 95°C for 1 min followed by 53°C for 1 min. All reactions were performed in triplicate. The cycle threshold (Ct) analysis of all targets gene expression was normalized to the level of GAPDH [Citation54]. All the primers used for RT-PCR are shown in supplemental Table 5.
RNA-seq Library Construction
For each sample, total RNA was extracted, then digesting the DNA with DNase I. The eukaryotic mRNA was enriched by magnetic beads with Oligo (dT). The interrupting reagent to break the mRNA into a short fragment at a suitable temperature in the Thermomixer. Next, the broken mRNA as a template to synthesize a stranded cDNA by using random hexamer primer and M-MulV Reverse Transcriptase, and the second strand was synthesized using DNA Polymerase I and RNase H (NEB, Beijing, China). Double-stranded cDNA was purified, adenylated at 3ʹ ends, and ligated with sequencing adaptor. The cDNA fragments with the length of 200-300 bp were verified by the Agilent 2100 Bioanalyzer (Agilent Technologies, U.S.A.) and the ABI StepOnePlus Real-Time PCR System.
Transcriptomic sequencing and data analyses
Two biological replicates for DON-treated and untreated control HepG2 cells were collected for RNA-seq. Transcriptomic sequencing was done by OneGene Ltd. Sequencing library was constructed by NEBNext Ultra RNA Library Prep Kit for Illumina, assessed by gilent 2100 Bioanalyzer and ABI StepOnePlus Real-Time PCR System, and sequenced by Illumina HiSeqTM 2500 platform. The adaptor, ploy-N and low quality reads were removed to obtain clean reads for further analyses. SOAPaligner/SOAP2 were used to assemble the clean reads [Citation55], and then the gene expression and alternative splicing analyses were conducted based on assembled sequences with homemade perl scripts. GO analysis was conducted on KOBAS 3.0 web server (http://kobas.cbi.pku.edu.cn/index.php). The quantitative analysis and statistics were conducted in R.
Western blotting
For western blotting analysis, whole cells were lysed in RIPA buffer (1% Nonidet P-40, 0.1% SDS, 1 mM EDTA, 1 mM DTT, 150 mM NaCl, 50 mM Tris-HCl, pH 7.5, 100 g/mL PMSF) containing a protease inhibitor for 30 mins followed by centrifugation at 15,000 rpm for 10 mins at 4°C. The protein concentration of the supernatants was determined using a Pierce BCA Protein Kit. Thirty micrograms of total protein were loaded onto 10% SDS/PAGE gels and then electroblotted onto an Immobilon-P transfer membrane (Millipore). After blocking for 1 h with TBS (0.9% NaCl, 0.1% Tween-20, 100 mM Tris-HCl, pH 7.5) containing 5% milk and 0.1% Tween at room temperature, the membrane was incubated with anti-SF1, anti-Myc and anti-GAPDH primary antibodies in blocking buffer overnight at 4°C. The secondary antibodies were anti-rabbit IgG HRP-linked antibody (CST) and anti-mouse IgG HRP-linked antibody (CST). The chemiluminescence signal was detected using Amersham Biosciences ECL plus.
Statistical analysis
Figures were plotted using GraphPad Prism 5.0 (USA) and R. For continuous variable data, the statistical significance was determined using one-way analysis of variance (ANOVA) followed by Dunnett’s test and the unpaired two-tailed Student’s t-test. Data are presented as the mean values ± standard deviations from at least three independent experiments, and statistical significance was defined as ***P < 0.001, **P < 0.01, or *P < 0.05.
Supplemental Material
Download Zip (4.1 MB)Disclosure statement
No potential conflict of interest was reported by the authors.
Additional information
Funding
References
- Sharp PA. The discovery of split genes and RNA splicing: trends in biochemical sciences. Trends Biochem Sci. 2005;30:279–281.
- Sharp PA. Split genes and RNA splicing (Nobel Lecture). Angew Chem. 2010;33:1229–1240.
- Kim E, Magen A, Ast G. Different levels of alternative splicing among eukaryotes. Nucleic Acids Res. 2007;35:125–131.
- Merkin J, Russell C, Chen P, et al. Evolutionary dynamics of gene and isoform regulation in mammalian tissues. Science. 2012;338:1593–1599.
- Barbosamorais NL, Irimia M, Pan Q, et al. The evolutionary landscape of alternative splicing in vertebrate species. Science. 2013;338:1587–1593.
- Nilsen TW, Graveley BR. Expansion of the eukaryotic proteome by alternative splicing. Nature. 2010;463:457–463.
- Irimia M, Blencowe BJ. Alternative splicing: decoding an expansive regulatory layer. Curr Opin Cell Biol. 2012;24:323–332.
- Modrek B, Resch A, Grasso C, et al. Genome-wide detection of alternative splicing in expressed sequences of human genes. Nucleic Acids Res. 2001;29:2850–2859.
- Garcia-Blanco MA, Baraniak AP, Lasda EL. Alternative splicing in disease and therapy. Nat Biotechnol. 2004;22:535–546.
- Aoki-Suzuki M, Yamada K, Meerabux J, et al. A family-based association study and gene expression analyses of netrin-G1 and -G2 genes in schizophrenia. Biol Psychiatry. 2005;57:382–393.
- Newman A. Specific accessory sequences in Saccharomyces cerevisiae introns control assembly of pre‐mRNAs into spliceosomes. Embo J. 1987;6:3833–3839.
- Ma L, Tan Z, Teng Y, et al. In vivo effects on intron retention and exon skipping by the U2AF large subunit and SF1/BBP in the nematode Caenorhabditis elegans. RNA. 2011;17:2201–2211.
- Wahl MC, Will CL, Lührmann R. The spliceosome: design principles of a dynamic RNP machine. Cell. 2009;136:701–718.
- Berglund JA, Chua K, Abovich N, et al. The splicing factor BBP interacts specifically with the pre-mRNA branchpoint sequence UACUAAC. Cell. 1997;89:781.
- Berglund JA, Abovich N, Rosbash M. A cooperative interaction between U2AF65 and mBBP/SF1 facilitates branchpoint region recognition. Genes Dev. 1998;12:858–867.
- Angela C, Flore R, Ivona B, et al. Mammalian splicing factor SF1 interacts with SURP domains of U2 snRNP-associated proteins. Nucleic Acids Res. 2015;43:10456–10473.
- Moore MJ. Intron recognition comes of AGe. Nat Struct Biol. 2000;7:14–16.
- Schothorst RC, Egmond HPV. Report from SCOOP task 3.2.10“collection of occurrence data of Fusarium toxins in food and assessment of dietary intake by the population of EU member states”: subtask: trichothecenes. Toxicol Lett. 2004;153:133–143.
- Pestka JJ, Smolinski AT. Deoxynivalenol: toxicology and Potential Effects on Humans. J Toxicol Environ Health B Crit Rev. 2005;8:39–69.
- Knutsen HK, Alexander J, Barregård L, et al. Risks to human and animal health related to the presence of deoxynivalenol and its acetylated and modified forms in food and feed. Efsa J. 2017;15:4718.
- Rotter BA, Prelusky DB, Pestka JJ. Toxicology of deoxynivalenol (vomitoxin). J Toxicol Environ Health. 1996;48:1–34.
- Wells L, Hardie L, Williams C, et al. Deoxynivalenol Biomarkers in the Urine of UK Vegetarians. Toxins (Basel). 2017;9:196.
- Berthiller F, Dall’Asta C, Schuhmacher R, et al. Masked mycotoxins: determination of a deoxynivalenol glucoside in artificially and naturally contaminated wheat by liquid chromatography−tandem mass spectrometry. J Agric Food Chem. 2005;53:3421–3425.
- Listed N. Evaluation of certain mycotoxins in food. Fifty-sixth report of the Joint FAO/WHO Expert Committee on Food Additives. World Health Organ Tech Rep. 2002;906:1–62.
- Bhat R, Ramakrishna Y, Beedu S, et al. Outbreak of trichothecene mycotoxicosis associated with consumption of mould-damaged wheat products in Kashmir Valley, India. Lancet. 1989;333:35–37.
- Mishra S, Dwivedi PD, Pandey HP, et al. Role of oxidative stress in Deoxynivalenol induced toxicity. Food Chem Toxicol. 2014;72:20–29.
- Friend DW, Thompson BK, Trenholm HL, et al. Effects of feeding deoxynivalenol (DON)-contaminated wheat diets to pregnant and lactating gilts and on their progeny. Can Vet J. 1986;66:229–236.
- Dänicke S, Valenta H, Spilke J. Effects of long-term storage on Fusarium toxin concentrations in wheat - sources of error of the analytical results. Arch Tierernahr. 2004;58:507–515.
- Pinton P, Tsybulskyy D, Lucioli J, et al. Toxicity of deoxynivalenol and its acetylated derivatives on the intestine: differential effects on morphology, barrier function, tight junction proteins, and mitogen-activated protein kinases. Toxicol Sci. 2012;130:180–190.
- Juan-García A, Juan C, König S, et al. Cytotoxic effects and degradation products of three mycotoxins: alternariol, 3-acetyl-deoxynivalenol and 15-acetyl-deoxynivalenol in liver hepatocellular carcinoma cells. Toxicol Lett. 2015;235:8–16.
- Shifrin VI, Anderson P. Trichothecene mycotoxins trigger a ribotoxic stress response that activates c-Jun N-terminal kinase and p38 mitogen-activated protein kinase and induces apoptosis. J Biol Chem. 1999;274:13985–13992.
- Pestka JJ. Deoxynivalenol-Induced Proinflammatory Gene Expression: mechanisms and Pathological Sequelae. Toxins (Basel). 2010;2:1300–1317.
- Zhu J, Krainer AR. Pre-mRNA splicing in the absence of an SR protein RS domain. Genes Dev. 2000;14:3166–3178.
- Nilsen TW. The spliceosome: the most complex macromolecular machine in the cell? Bioessays. 2003;25:1147–1149.
- Yuan L, Mu P, Huang B, et al. EGR1 is essential for deoxynivalenol-induced G2/M cell cycle arrest in HepG2 cells via the ATF3ΔZip2a/2b-EGR1-p21 pathway. Toxicol Lett. 2018;299:95–103.
- Xiaoming L, Peiqiang M, Han Q, et al. JNK-AKT-NF-κB controls P-glycoprotein expression to attenuate the cytotoxicity of Deoxynivalenol in mammalian cells. Biochem Pharmacol. 2018;156:120–134.
- Krämer A, Utans U. Three protein factors (SF1, SF3 and U2AF) function in pre‐splicing complex formation in addition to snRNPs. The EMBO Journal. 2010;2:1300–1317.
- Nielsen C, Casteel M, Didier A, et al. Trichothecene-induced cytotoxicity on human cell lines. Mycotoxin Res. 2009;25:77–84.
- Kanaar R, Roche SE, Beall EL, et al. The conserved pre-mRNA splicing factor U2AF from Drosophila: requirement for viability. Science. 1993;262:569–573.
- Golling G, Amsterdam A, Sun Z, et al. Insertional mutagenesis in zebrafish rapidly identifies genes essential for early vertebrate development. Nat Genet. 2002;31:135–140.
- Dvinge H, Kim E, Abdelwahab O, et al. RNA splicing factors as oncoproteins and tumour suppressors. Nat Rev Cancer. 2016;16:413–430.
- Yoshida K, Sanada M, Shiraishi Y, et al. Frequent pathway mutations of splicing machinery in myelodysplasia. Nature. 2011;478:64–69.
- Yip BH, Steeples V, Repapi E, et al. The U2AF1 S34F mutation induces lineage-specific splicing alterations in myelodysplastic syndromes. J Clin Investig. 2017;127:2206–2221.
- Wang L, Brooks AN, Fan J, et al. Transcriptomic Characterization of SF3B1 Mutation Reveals Its Pleiotropic Effects in Chronic Lymphocytic Leukemia. Cancer Cell. 2016;30:750–763.
- Graubert TA, Shen D, Ding L, et al. Recurrent mutations in the U2AF1 splicing factor in myelodysplastic syndromes. Nat Genet. 2012;44:53–57.
- Black DL, Grabowski PJ. Alternative pre-mRNA splicing and neuronal function. Prog Mol Subcell Biol. 2003;31:187–216.
- Sun Y, Wen J, Chen R, et al. Variable protein homeostasis in housekeeping and non-housekeeping pathways under mycotoxins stress. Sci Rep. 2019;9:7819.
- Reed R. Protein composition of mammalian spliceosomes assembled in vitro. Proc Natl Acad Sci U S A. 1990;87:8031–8035.
- Michaud S, Reed R. An ATP-independent complex commits pre-mRNA to the mammalian spliceosome assembly pathway. Genes Dev. 1991;5:2534–2546.
- Hinnebusch AG. Translational control of GCN4: an in vivo barometer of initiation-factor activity. Trends Biochem Sci. 1994;19:409–414.
- Shufeng S, Jun J, Yiqun D. Chicken cytochrome P450 1A5 is the key enzyme for metabolizing T-2 toxin to 3ʹOH-T-2. Int J Mol Sci. 2013;14:10809–10818.
- Chatrikhi R, Wang W, Gupta A, et al. SF1 Phosphorylation Enhances Specific Binding to U2AF65 and Reduces Binding to 3â2-Splice-Site RNA. Biophys J. 2016;111:2570–2586.
- Komeno Y, Huang YJ, Qiu J, et al. SRSF2 Is Essential for Hematopoiesis, and Its Myelodysplastic Syndrome-Related Mutations Dysregulate Alternative Pre-mRNA Splicing. Mol Cell Biol. 2015;35:3071–3082.
- Dvinge H, Bertone P. HTqPCR: high-throughput analysis and visualization of quantitative real-time PCR data in R. Bioinformatics. 2009;25:3325–3326.
- Hurgobin B. Short Read Alignment Using SOAP2. Methods Mol Biol. 2016;1374:241–252.