
ABSTRACT
MicroRNAs are regulators of gene expressionand may be key markers in liquid biopsy.Early diagnosis is an effective means to increase patients’ overall survival. We generated genome-wide miRNA profiles from serum of patients and controls from the population-based Janus Serum Bank (JSB) and analysed them by bioinformatics and artificial intelligence approaches. JSB contains sera from 318,628 originally healthy persons, more than 96,000 of whom developed cancer. We selected 210 serum samples from patients with lung, colon or breast cancer at three time points prior to diagnosis (up to 32 years prior to diagnosis with median 5 years interval between TPs), one time-point after diagnosis and from individually matched controls. The controls were matched on age and year of all pre-diagnostic sampling time-points for the corresponding case.
Using ANOVA we report 70 significantly deregulated markers (adjusted p-value<0.05). The driver for the significance was the diagnostic time point (miR-575, miR-6821-5p, miR-630 with adjusted p-values<10−10). Further, 91miRNAs were differently expressed in pre-diagnostic samples as compared to controls (nominal p < 0.05). Self-organized maps (SOMs)indicated larges effects in lung cancer samples while breast cancer samples showed the least pronounced changes. SOMsalsohighlighted cancer and time point specific miRNA dys-regulation. Intriguingly, a detailed breakdown of the results highlighted that 51% of all miRNAs were highly specific, either for a time-point or a cancer entity. Pathway analysis highlighted 12 pathways including Hipo signalling and ABC transporters.Our results indicate that tumours may be indicated by serum miRNAs decades prior the clinical manifestation.
Introduction
MicroRNAs – often abbreviated as miRs or miRNAs – are short non-coding RNAs. In basically all organisms, miRNAs regulate the gene expression on posttranscriptional level by binding to the 3ʹUTR of target genes [Citation1,Citation2]. MiRNAs control various cellular processes by targeting a broad number of different target genes and target pathways. Even non-canonical binding sites as short as 5-mers can have a deterministic influence on the targeting process [Citation3]. Many diseases including various cancer types as well as neurodegenerative diseases are associated with aberrant miRNA expression in affected tissues and body fluids [Citation4–Citation7]. One of the most promising applications of miRNAs is to facilitate early disease detection as liquid biopsies, especially in cancer.
Cancer is the second-most common cause of death worldwide and the most common cause of death in men and women under the age of 70 and has become a large public health problem. The challenges in cancer management are to succeed in early detection, to improve diagnostic precision, to offer an appropriate therapy and follow-up, all aimed at reducing suffering and prolonging survival.Early detection is especially important regarding reduced mortality as therapeutic intervention of advanced cancers often has low effect on survival.Early cancer detection is particularly promising if the tumour detection occurs prior to the clinical manifestation. There is, however, a paucity of studies thatpursue the latter idea due to the lack of prospectively collected biospecimens. We used samples of the Janus Serum Bank,a unique population-based biobank, which collected sera form 318,628 originally healthy persons, over 96,000 of whom developed cancer after the first samples were taken [Citation8–Citation11].One advantage of the Janus Serum bank is the multiple and regular sampling over time allowing to follow up pre-diagnostic changes of a biomarker.
In addition to miRNAs, the storedserumcontainsother molecules which canbe tested for their predictive potential to indicate tumour development at very early stages [Citation12].Examples in sum include proteins, DNA, metabolites, small non-coding RNAs and epigenetic changes [Citation13–Citation15]. Especially, their high degree of stability in bloodhas driven the search for miRNAs biomarkers.As for any biomarker the identification of confounding factors is essential to estimate the diagnostic value of blood-borne miRNAs [Citation6,Citation16]. Previously, we comprehensively evaluated the influence of storage time on the totality of blood-borne miRNAs by analysing consecutive samples of healthy individuals that have been stored in the Janus Serum Bank between 23 and 40 years at −25 °Celsius. We found that a substantial proportion of the miRNome was affected by the age of the blood donor but only few miRNAs showed variations in their abundance depending on their storage time (measurement) [Citation17]. Also other factors such as smoking influenced the miRNA expression significantly [Citation18]. Furthermore, we previouslyalso provided first and preliminaryindications forpre-diagnostic miRNA profiles [Citation19] in serum of individuals, who were later diagnosed with lung cancer [Citation20].
Because of theurgent clinical needs for screening markers, much research is dedicated to discover molecular pre-diagnostic cancer signatures. For example, DNA methylation changes measured in pre‐diagnostic peripheral blood samples were found to be associated with smoking and lung cancer risk [Citation21]. In a similar direction, hypomethylation of smoking-related genes was observed to be correlated to future lung cancer in four prospective cohorts [Citation22]. Further, pre-diagnostic leukocyte mitochondrial DNA copy number has been discussed in the context of lung cancer risk [Citation23]. Also autoantibodies against tumour-associated antigens seem to have a potential for positive results in pre-diagnostic samples [Citation24]. For colon cancer a meta-analysis investigated pre-diagnostic protein levels. The results of the study suggest an association of pre-diagnostic circulating CRP levels withan increased risk of colorectal cancer [Citation25]. Similarly, pre-diagnostic levels of adiponectin and soluble vascular cell adhesion molecule-1 (VCAM1) seem to be associated with colorectal cancer risk [Citation26]. For breast cancer, biomarker candidates have been likewise identified using serum protein profiling of pre-diagnostic serum [Citation27]. But also in other cancer types, such as ovarian cancer, pre-diagnostic signatures were identified [Citation28].The list of other studies on pre-diagnostic biomarkers is far from being complete, however, it show the potential of respective tests and the high research interest in pre-diagnostic cancer markers.
These previous studies often rely on one or few markers. There is however a clear trend towards more complex biomarker sets. Further, biomarker studies now often consider more than only one disease at a time [Citation14]. To analyse respective complex studies including multiple time points and multiple cancer types different bioinformatics, biostatistics, machine learning or artificial intelligence approaches can be applied. Given the nature of the study we avoided to use supervised learning but tested unsupervised competitive learning approaches. Respective approaches such as Self Organized Maps (SOMs), originally introduced in 1982 by Kohonen [Citation29] support the discovery of structures in the data. SOMs typically generate two-dimensional and well interpretable discretized representations of a high dimensional input space. Using SOMs and classical biostatistics methods we set to extend the knowledge on pre-diagnostic miRNA biomarkers in serumby including strictlymatched controls and by analyzingsamples frompatients with carcinoma of lung, colon andbreast. We address the questions if and how long prior to the diagnosis characteristic blood-bornemiRNA changes can be observedin these cases and whetherspecific pre-diagnosticmiRNA signaturescan be found forthese cancer types. We start our consideration with global aspects, i.e. we try to identify overall pre-diagnostic cancer markers before we address the topic of discovering pre-diagnostic markers that are specific for one cancer entity.
Results
Study set up and miRNA profiling
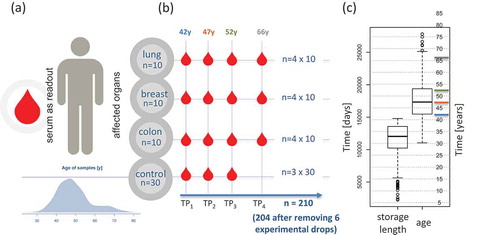
Weselected serum samples of individuals that later developed cancer out of 318,628 stored samples of the Janus Serum Bank. Theindividuals had samples at three time points, with five-six year intervals,prior to cancer diagnosis andone time point after diagnosisfor each patient.Stringentselected cancer-free controls with the following criteria: i) the matched controls stemmed from donors of the same sex as the cases, ii) the age difference between cases and matched controls was not more than two years, and iii) the difference between the blood collection time point of cases and controls was not more than two months ensured control for confounding factors. The cases had to develop either lung, breastor colon cancer but were not diagnosed with any other cancer type prior to diagnosis. The included matched controls were not diagnosed with cancer at any time ().Based on these criteria we were able to identify 90 case-control paired samples.The samples were stored for up to 40 years with a median storage time of 33 years and a median age of blood donors of 41 years at enrolment ().Most samples were collected at three time points prior to the cases diagnosis with the median time interval between TP1 and TP2 of 5 years and TP2 and TP3 of 5 years ().Inherent to the longitudinal character of the study design is a strong negative correlation of the age of donors and the storage length, i.e. the earliest samples stem necessarily from the youngest cases and controls (Supplemental Fig. 1).In total, we analysed the miRNomes of 210 samples including 120 samples from cases and 90 from controls. Six samples (2.9%) yielded miRNomes of low quality and were excluded from further analysis. Of 2,549 profiled miRNAs, 435 were expressed above the background in the serum samples.Basic characteristics of the study subjects and samples are available in Supplemental Table 1. In the following we first present a global analysis of changes before we consider specific cancer types and finally carry out a pathway analysis for the relevant miRNAs.
Figure 1. Study set-up and characteristicsof theparticipants.(A) Age distribution and read out. (B) Sampling bycancer type and time point (TP). TP1, 2 and 3 refer to pre-diagnostic sampling time points, TP4 is a sampling time-point after cancer diagnosis. Numbers above each TP represent the median age of all samples included in this TP.(C) Distribution of storage length and age of blood donors(in days and years)for all samples.Horizontal coloured lines represent the median of the four time points.
General patterns between controls, cancer patients prior to and post diagnosis
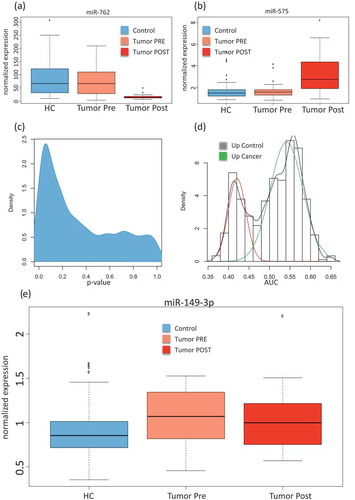
First, we assessed differences between the control samples, the pre-diagnostic and the post-diagnostic sampleswithout considering neither the cancer type nor the longitudinal aspect, i.e. the three collection time points. An analysis of variance (ANOVA) for all cancer types together and with the three groups (controls, pre-diagnostic and post-diagnostic)identified 134 significantly deregulated miRNAs (unadjusted p < 0.05). Following adjustment using the Benjaimin-Hochberg approach still 70 markers remained significant at an alpha level of 0.05. The three most significant miRNAs (miR-575, miR-6821-5p, and miR-630)showed adjusted p-values of below 10−10. For each miRNA, raw and adjusted p-value are detailed in Supplemental Table 2. For the majority of miRNAs, the controls largely matched to the samples collectedprior to diagnosis. In contrast, the post-diagnostic cancer showed significantly different miRNA expression as compared to the controls. Examples including the most significant miR-575 (up-regulated following diagnosis) and the down-regulated miR-762 are provided in showing miRNAs with either reduced or elevated expression in the post-diagnostic samples as compared to similar expression between controls and pre-diagnostic samples. This calls for a more specific analysis in order to discover miRNAs that are differently expressed between controls and pre-diagnostic samples. As shown by the density distribution of the p-values, there are highly significant miRNAs found for the comparison of pre-diagnostic samples and controls (). Wilcoxon Mann-Whitney (WMW) tests for these two groups identified 91 significant differently expressedmiRNAs (Supplemental Table 3; ). We next computed the AUC for each of these miRNAsand identified a bi-variate distribution with one peak representing miRNA with lower expression in the pre-diagnostic cancer samples and the other peak representing miRNAs with higher expressionin the pre-diagnostic samples, each as compared to the controls. The AUC analysis shows that the numberof the overexpressed miRNAs is lower (40 miRNAs) than the number of the miRNAs with lower expression (51 miRNAs)in the pre-diagnostic samples as compared to the controls (). shows miR-149-3p as the most significantly dys-regulated miRNA, a miRNA with higher expression in the pre-diagnostic cases than in the controls. The study set-up however facilitates a more detailed comparison between three cancer types and controls at different time points. This leads to a large number of pair-wise comparisons. Unsupervised analyses can group the patterns of associations and specificity for time points and cancer types.
Figure 2. Comparison between cancer and control samples. (A) Box-plot of the normalized expression values of miR-762 in all control samples (HC; free from cancer during the study), all samples collected prior to cancer diagnosis(Tumour Pre)and all samples collected after cancer diagnosis(Tumour Post). (B) Box-plot of the normalized expression values of miR-575, the most significant miRNA in the analysis of variance. (C) Density distribution of unadjusted p-values for the comparison between all pre sampling time points and the matchedcontrols, showing an enrichment of low (significant) p-values.(D) AUC distributions for the comparison between all cancer pre sampling time points and the matchedcontrols. An AUC close to 1 indicates higher expression in cancer samples and an AUC close to 0 indicate higher expression in the control samples.The AUC was computed from all receiver operator characteristic curves (ROC) for paired comparisons of cancer to matched controls in each cancer type separately.The red curve corresponds to miRNAs with higher expression in the control samples and the green curve to miRNAs with higher expression in pre-diagnostic cancer samples. (E) Box-plot of the normalized expression values for miR-149-3p showing higher expression in pre-diagnostic cancer samplescompared to the matched controls.
Artificial intelligence to learn temporal and disease specific patterns
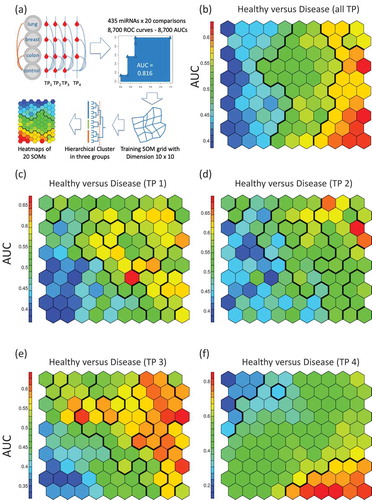
We next included in our analysis both the cancer type and the temporal aspect, i.e. the three collection time points. To this end, we applied the self-organizing map (SOM) as a competitive learning based artificial neural network. SOM is an unsupervised approach, but we used the AUC (and with this also the cancer/control information) as input. The SOM facilitated dimension reduction, bringing the 435-dimensional miRNA space to a 2-dimensional representation.The workflow of the SOM analysis is presented in . First, the SOM was trained and clusters with respect to AUCsfrom all cancer cases combining pre- and post-diagnostic samples as compared to the control samples were identified by hierarchical clustering. In general, the SOM identified three major groups of deregulated miRNAs in this comparison including miRNAs with lower expression in the cancer samples, unaffected miRNAs and miRNAs with higher expression in the cancer cases (). Second, SOM was trained and clusters with data from the three pre-diagnostic time points each compared to the control samples were identified. Throughout all three time points the SOMs reveal a group of miRNAs with lower expression in pre-diagnostic cancer samples as compared to the controls (). Higher expressed miRNAs in pre-diagnostic cancer samples were only identified for the time points closest to diagnosis (). The comparison between the post-diagnostic samples and the controls highlights distinct patterns of both lower and higher expressed miRNAs in the cancer samples (). In summary, SOM showed that the general pattern trained with data from all cancer cases combining and all control samples () is a composition of the disjointed sub-patterns of the pre-diagnostic and of the post-diagnostic miRNAs.
Figure 3. Self-organized maps (SOMs) analysis.(A) Schematic representation of the workflow. We performed all pair-wise comparisons for tumours and matched samples as well as TP4 and all controls per cancer type (blue dotted lines) and for all cancer types together (orange dotted lines). The SOMs were trained with AUC data from all 20 comparisons. For the analysis groups, clusters were determined by using hierarchical clustering and heat maps were generated. In the heat maps, hexagons represents at least one but usually a set of miRNAs. The colorof a hexagon represents the AUC values of the miRNAs in that hexagonwith the colour code indicated to the left of each subfigure. (B) SOM for the comparison between all samples of the cancer patients and all control samples. Hierarchical clustering identified vertical sections indicating three clusters of differentially expressed miRNAs. (C) SOM for the comparison between of all samples collected at the first time point prior to cancer diagnosis as compared to matched controls. There is a cluster of miRNAs with lower expression in the pre-diagnostic cancer samples (indicated in blue in the lower left corner). (D) SOM for the comparison between all samples collected at the second time point prior to cancer diagnosis as compared to matched controls. The cluster of miRNAs with lower expression in pre-diagnostic cancer samples is less evident than for the first time point. (E) SOM for the comparison between all samples collected at the third time point prior to cancer diagnosis as compared to matched controls. There is again a cluster of miRNAs with lower expression but also a cluster with higher expression in pre-diagnostic cancer samples. (F)SOM for the comparison between all samples collected after cancer diagnosis as compared to combined controls (healthy controls). The upper left corner describes a cluster of miRNAs with lower expression while the lower right corner represents a cluster with higher expression in post-diagnostic cancer samples. The overall SOM in Fig.3blargely comprises both, the blue and red clusters from the comparisons shown in Fig. 3C-f.
We next investigated separately the patterns for the three cancer types lung, colon and breast. Specifically, the SOMs were analysed for each cancer type according to the following five scenarios: All cancer samples versus matched controls, the pre-cancer samples of the first, second, and third time point each compared to matched controls, and the post-diagnostic samples compared to the combined controls. The resulting 3 × 5 patterns are shown inSupplemental Fig. 2. The analysis of the samples combined for each cancer type identified three groups of expressed miRNAs including lower expressed miRNAs, unaffected miRNAs and higher expressed miRNAs for all three cancer types.
The comparison between the three pre-diagnostic time points and the matched controls revealed specific patterns for each of the three cancer types. The SOM revealed a group of up-regulated miRNAs for the first pre-diagnostic time point in lung cancer samples. This group of up-regulated miRNAs was not found at the second or third time points for lung cancer. In contrast, the SOM did not describe clear signatures for colon and breast cancer at the first and second time points. For colon cancer, the SOM identified a group of down-regulated miRNAs at time point three similar to the pattern observed for lung cancer at time point three. The SOM did not reveal clear patterns of up- or down-regulated miRNAs for breast cancer.The SOM revealed distinct patterns for each cancer type for the comparison between post-diagnostic samples compared to controls. Specifically, the SOM identified a distinct group of down-regulated miRNAs for lung cancer. The least pronounced group of down-regulated miRNAs was found for breast cancer. The most prominent group of higher expressed miRNAs was found in colon cancer and less prominent groups of down-regulated miRNAs for lung and breast cancer. In summary, the SOM analysis supports the presence of time- and disease specific miRNA patterns leading to the question which miRNAs contribute to these patterns.
Each cell in the cluster heat maps contains at least one but usually more miRNAs with similar expression behaviour in and between the groups. For the 10 × 10 cells the miRNAs per cluster are presented in Supplemental Table 4 numbered consecutively in clusters 1 (lower left corner) to 100 (upper right corner). The largest cluster 31 contains 23 miRNAs.Having performed detailed analyses for the different cancer types and time points can help us to identify diagnostic signatures.
Joint analysis highlights 67 diagnostic miRNAs
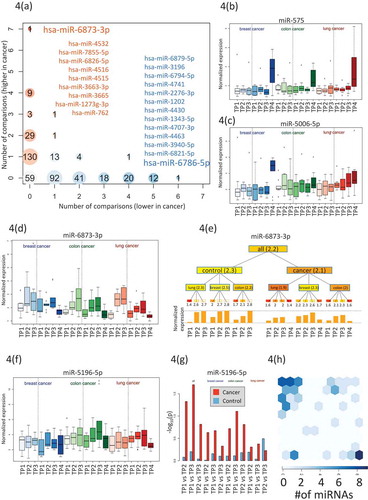
We computed for each miRNA the number of the above comparisons whereit was higher- or lower expressed in any cancer or any time point compared to control samples (). We found 59 miRNAs, which were not attributed to any time-point or disease. The majority of the miRNAs(222) was deregulated for only a single time point or a single cancer type. Of these, 90 (41.4%) were higher expressed and 130 were lower expressed (58.6%).We also observed miRNAs that were deregulated at most of the time points and formost cancer cases (top left and top right in ).The most prominent factor with the strongest impact on miRNA deregulation was the time point after cancer diagnosis as exemplified for miR-575 in that was already most significant in the analysis of variance (). However, we also found miRNAs that showed an increase of expressionover time prior to diagnosis. An example of such a time course is miR-5006-5p in lung cancer as shown in . Other miRNAs were lower expressed in pre- diagnostic cancer samples as compared to controls. An example is miR-6873-3p that showed an increase with age for the controls, but no comparable increase for the matched cancer samples ().Since several time-points for the same individuals were measured we could generally ask whether the miRNA expression levels at consecutive time points were significantly altered in cancer cases but not in controls.A paired hypothesis test identified 14 miRNAs with significantly lower p-values for cases than for controls including miR-5196-5p and miR-320a as shown in Fig. 5F/G.
Figure 4. Specific miRNA patterns. (A) Computation of the number of significantly higher- or lower expressed miRNA for each time point and each cancer. Higher expressed miRNAs are indicated in red and lower expressed miRNAs in blue. The bubble size corresponds to the number of miRNAs found for a given time point and a specific cancer.Specifically indicated in blue is miR-6786 that were lower expressed in 6 analyses and higher expressed in none of the analyses.Also indicated in blue are the 12 miRNAs with lower expression in 6 analyses and higher expression in none of the analyses.Specifically indicated in orange is miR-6873-3p that were higher expressed in 7 analyses and lower expressed in none of the analyses.Also indicated in orange are the 9 miRNAs with higher expression in 4 analyses and lower expression in none of the analyses.(B) The boxplot presents the normalized expression intensity of miR-575 in 21 groups (3 cancer types in blue, green and red shading and for each cancer type three control time points (left part in each panel) and four cancer time points (right part in each panel). This miRNA was already highest in the analysis of variance and presented in .(C) Analogously to Fig. 4B we present the expression of miR-5006-5p, showing steadily increasing expression over time for lung cancer patients but not for controls. This miRNA is potentially an early lung cancer marker. (D) Analogously to Fig. 4B we present the expression of miR-6873-3p, that is steadily increasing over time both for the controls and for the cancer samples. This miRNA seems to be rather age than disease related. (E) For the same miRNA (miR-6873-3p) the expression for all groups is shown as tree structure. The leaves are the same 21 groups of three cancers time seven total time points. The numbers below the leaves represent the average expression of all samples in this group. Internal nodes contain the average of all nodes in the hierarchy below this node. The bar graph at the bottom represents the expression intensity of the leaves.(F) Analogously to Fig. 4b we present the expression of miR-5196-5p. It shows a more constant expression in all control samples but higher variability in the cancer samples. (G) For this miRNA (miR-5196-5p) we computed all pair-wise comparisons between time points (TP1 to TP2; TP1 to TP3; TP2 to TP3) for controls(blue bars) and cases (red bars). Again, the analysis has been performed once with all cancer types together (grey shaded area) and for the cancer types separately (shaded in blue, green and red respectively). The height of the bar corresponds to the negative decade logarithm of p-values.The p-values for cancer comparisonssignificantly exceed the values for the controls. (H) Allocation of 67 miRNAs, which were identified with a significantly altered expression by the different comparisons to the SOMs shown in Fig. 3. All miRNAs were identified by the SOM analysis that shown a strong enrichment for these miRNAs (upper left corner of the SOM map).
In total, we identified 93 miRNAs by the above 4 analyses including i) ANOVA of control samples, pre-diagnostic samples, and post-diagnostic cancer samples, ii) comparison of pre-diagnostic and controls samples, iii) identification of miRNAs that were deregulated in different cancer types, and iv) paired hypothesis test for miRNAs that are significantly altered in tumour samples but not in matched controls. Some miRNAs were identified by several analyses, reducing the number to 67 relevant miRNAs (Supplemental Table 5). The majority of these miRNAs have also been identified by the artificial intelligence-based analyses using SOMs.As shown in Fig. 5 h SOM grouped 36 of these miRNAs in one cluster and 12 miRNAs in a second cluster. Notably, the miR-4687-3p and miR-6087 have been identified by three of analyses underlying their specific potential as pre-diagnostic markers.The immediate question is whether these miRNAs accumulate on specific pathways or in specific gene ontology categories.
Pathway analzysis highlights 12 enriched pathways
We performed a miEAA pathway analysis for the 67 miRNAs from the previous analysis. This analysis highlighted 12 pathways (nominal p-value below 0.05 as well as enrichment score above 1.2; Supplemental Table 6). Five pathways, ‘D-Arginine and D-ornithine metabolism’, ‘ABC transporters’, ‘Glycine, serine and threonine metabolism’ and ”Hippo signalling pathway – multiple species”. Had enrichment factors between 6 and 1.6. With lower enrichment scores we also observed different cancer pathways (lung cancer, thyroid cancer, and chronic myeloid leukaemia) In sum, 88% of all miRNAs contributed in at least one of the 12 pathways. Astonishingly, we observed a substantial variability in specific and general miRNAs. While 8 miRNAs (hsa-miR-149-3p, hsa-miR-1207-5p, hsa-miR-762, hsa-miR-6873-3p, hsa-miR-4741, hsa-miR-4530, hsa-miR-4433a-3p, and hsa-miR-1343-5p) were contained in 10 or more pathways, 11 miRNAs (hsa-miR-6826-5p, hsa-miR-575, hsa-miR-550a-5p, hsa-miR-4721, hsa-miR-4515, hsa-miR-4463, hsa-miR-6793-5p, hsa-miR-6084, hsa-miR-4687-3p, hsa-miR-3682-3p, and hsa-miR-4327) were observed only in three or less pathways. A detailed matching of miRNAs to pathways is provided in Supplemental Table 6.
Discussion
Markers that facilitate detection of tumours in early stages, at best pre-diagnostic markers, are one of the most promising tools to improve cancer outcome. One question is how long prior to diagnosis molecular changes can be measured. To address such issues, very large sample collections are mandatory. Janus Serum Bank in Oslo (Norway)isan comprehensive resource for serum samples that have been stored and followed up over decades.A major strength of the Janus Serum Bank is the large number of collected samples and the long follow-up time, allowing to identify for each cancer case a matching control even by applying stringent criteria. The possibility for closely matched pairs was essential for the design of our study (nested case-control design), which analysed 30 pairs of samples, each including an individual who developed cancer and a matched individual who was not diagnosed with cancer at any time point. A further strength of the Janus Serum Bank is the multiple sampling over time allowing to follow up pre-diagnostic changes of a biomarker. This characteristic was also central to the design of our study, which includes three pre-diagnostic samples of each individual selected. One limitation in the study set up was a later time point for controls. Since the collection to the Janus Serum Bank was ended in 2004 we were not able to acquire matched controls for the diagnostic samples, which were obtained at later time points.
Still, many factors can potentially confound miRNA profiles. We thus addressed the influence of different factors potentially influencing circulating miRNA biomarker profiles. As most obvious confounders we investigated the age and sex of individuals [Citation30]. In this study we detected 318 miRNAs that were significantly correlated with age and after adjustment for multiple testing 35 miRNAs remained statistically significant. Regarding sex, 144 miRNAs showed significant dysregulation and no miRNA remained significant after adjustment for multiple testing. The age seems thus to have a more substantial influence than the gender. Both aspects should have a limited influence in the present study since we either performed paired testing for the same individuals or group comparisons with cohorts matched for age and gender. But other less obvious confounders exist, we e.g. observed even small changes depending on the season when samples have been collected [Citation31]. The effect size of such changes is however typically below the effect sizes for disease related biomarkers.
Nonetheless, we checked especially for the miRNAs that are dys-regulated following diagnosis whether the abundance in blood changes with age between young and old individuals [Citation32]. Of all 64 miRNAs significantly up-regulated following diagnosis only one (hsa-miR-21-5p) was also significantly correlated with age. Notably hsa-miR-21-5p that is up-regulated in the samples following diagnosis (that are older) is associated with the opposite, a down-regulation in older individuals. Of the 58 samples down-regulated in cancer samples post diagnosis, one is going down with age (hsa-miR-33b-3p) and two are going up in age (hsa-miR-574-3p, hsa-miR-324-3p). Of course this comparison in itself is not perfect (e.g. the miRNAs from the previous study had to be matched to the most recent miRBase version, the age range is more extreme in the previous comparisons), but limits the likelihood that the post cancer signatures are due to the age differences.Another challenge in analysis of microarray miRNA expression is whether appropriate approaches are used and whether data are log-transformed prior to the analysis. In our study the miRNAs were only partially normally distributed on the original or the log transformed scale. We thus largely applied methods that are rank based and thus do not differ in the results depending on a log transformation. Prominent examples are the AUC that was used as input for SOMs or the non-parametric Wilcoxon Mann-Whitney test. One exception is the analysis of variance. Here, we performed the analysis on the original data and on the log transformed data. The negative decimal logarithm of p-values between the two analyses was as high as 0.87, demonstrating the very high concordance (Supplemental Fig. 3).
Already in previous research studies we obtained valuable results from samples of the Janus Serum Bank. We determined the influence of confounding factors including storage time, age, sex, smoking, and body mass index among others on the patterns [Citation18] of blood-borne miRNAs. Further, we identified pre-diagnostic miRNA patternsin sera from lung cancer patients [Citation19]. In the present study we extend our previous results with respect to many aspects. We now include more samples per cancer type, we include time points that are much further away from the diagnosis and we measure and compared different cancer types. Lastly, we matched on the time difference between the samples allowing only minimal variation (a maximal difference between the blood collection time point of cases and controls of only up to two months). The extended scope of the study also called for different bioinformatic and biostatistical approaches, such as self-organizing maps as an artificial neural network approach.
The different design of our present and our previous analysis makes it difficult to compare the two analyses both in terms of sample collections and in terms of the applied measurement technology. Despite the substantial differences between the studies, we re-identified several pre-diagnostic miRNAs from the previous study in our present results, including miR-762, miR-1202, miR-1207-5p, and miR-575. To further gauge the biological meaning and especially the evidence for causative role of the pre-diagnostic miRNAs identified in the present study, we evaluated these miRNAs with regards to their previously reported involvement in cancer. A systematic PubMed search for the 67 miRNAs identified in our study yielded 324 manuscripts that report a cancer connection for these miRNAs (Supplemental Table 7). Most frequently we found a cancer association for miR-320a, which was described in 93 studies, for miR-630 in 59 studies, for miR-1207-5p in 25 studies, and for miR-149-3p in 21 studies. Specifically, miR-320a has been associated with lung carcinoma in 11 studies, withbreast carcinoma in 17 studies and with colon carcinoma in 8 studies. Likewise, miR-630 and miR-1207 have previously been associated with the cancer types analysed in the present study. In detail, miR-630 wasassociated in 10 studies with lung cancer, in 6 studies with breast cancer, in 2 studies with colon cancer, and miR-1207-5p in 4 studies with lung cancer, in 4 studies with breast cancer and in 2 studies with colon cancer (Supplemental Table 8). Our results emphasized miR-4687-3p to have specific potential as pre-diagnostic marker. This is also suggested by Nagy et al who identified altered levels of miR-4687 in plasma of colorectal cancer and adenomas cases compared to individuals with normal colon [Citation33].Also miR-6087, the other miRNA showing specific potential, has previously been suggested as a circulating early detection biomarker of bladder cancer in a large serum study [Citation34], with a potential role in regulation of p53 [Citation35].Circulating cell-free RNA are considered promising as liquid biopsy cancer markers, although the biological and clinical interpretations are challenging [Citation36]. Our study is indicativeof RNA profiles specific for cancer decades before diagnosis, however, validation and biological and clinical interpretations are needed in future studies.
Since most of these studies were on tissue orcell cultures, care must be taken to prematurely hypothesize a causal role for the pre-diagnostic sera miRNAs in the development of these cancers.Although we analyzeda total of 210 samples, it has also to be acknowledged that we could only identify 10 patients for each cancer type.This was due to the criteria of sample selection requiring i) three pre-diagnostic samples for each patient with ii) comparable collection time points, and with iii) matched controls both in terms of the patients’ age and the collection time points. The predictive value of the identified miRNAs awaits confirmation by prospective studies with an extended number of samples ideally recruiting from additional populations beside the Norwegian population that was analysed in the present study.Such prospective cohort-based studies, however, require long follow up times as part of a longitudinal study design, which are essential to identify new biomarkers [Citation37].While the respective study set ups have clear advantages as pointed out above, they will likely not reach the cohort sizes of current case-control studies that include already for single cancer types over 3,000 patients and controls [Citation38]. One solution will be to combine the results of studies with stringent matching as performed here with results of studies having larger cohort sites and less stringent inclusion criteria e.g. considering the pre-diagnostic time points.
In summary,our results suggest that circulating miRNA signatures can be found decades prior to the clinical manifestation of a tumour. The most prominent miRNA changes occur in pre-diagnostic samples for lung cancer, which could however be confounded by smoking behaviour of patients and controls. This is consistent with our previous study that showed dynamic pre-diagnostic changes of circulating RNAs related to the histology and the stage of lung cancer after its manifestation. As for colon and breast cancer, our results indicate less pronounced changes of blood-bornemiRNAs prior to diagnosis. While the results of our study are generally promising it is evident that reproduction in other cohorts is required.
Methods
Study set-up and RNA extraction
In the study we included lung cancer, colon cancer and breast cancer patients, three of the top most common cancers and where the identification of early detection biomarkers would have a large impact. We also wanted to compare miRNA signatures across different cancer types. The cancer cases were identified by linking the Janus Cohort to the Cancer Registry of Norway using the individual’sNorwegian national identity number.
For each cancer group, 10 patients were included who had three pre-diagnostic and one diagnostic sample available.30 control individuals were selected. For the cancer patients three pre-diagnostic and one post diagnostic time point were measured (120 samples) for the controls three time points matching the pre-diagnostictime points were measured (90 samples) (). Between cancer and matched controls, a maximal time difference of two months was allowed. All samples in the JSB are stored at −25°C and collected in gel vials, or in 10-mL tubes containing either 5 mg sodium iodoacetate or no additives. Total RNA including miRNAs was isolated using the miRNeasy Serum/Plasma Kit (Qiagen, Hilden, Germany) as previously described[Citation17]. Of the 210 samples, 204 yielded high-quality RNA and microarray results, 6 samples were excluded for quality reasons[Citation39].The study was approved by the Norwegian regional committee for medical and health research ethics (REC no: 2013/614). The donors have given broad consent for the use of the samples in cancer research.
Microarray measurement
Genome wide miRNA expression profiles were created using the SurePrint G3 8 × 60 k miRNA microarray (miRBase version 21, Cat. no. G4872A). Using this microarray, probes for 2,549 mature human miRNAs were measured. As input material for the microarray screening, 100 ng total RNA including miRNA was used for each sample. The hybridization process and read out of the microarrays has been performed according to manufacturer’s recommendations as previously described[Citation17].
Data processing and bioinformatics
Features were extracted from the manufacturers GW Feature Extraction software (version 10.10.11, Agilent Technologies). Replicated measurements of miRNAs were summarized by the median expression and data were subjected to standard quantile normalization. Filtering of miRNAs close to the background excluded 2,114 miRNAs leaving an expressed set of 435 serum miRNAs. The filtering was done using the present call definition of the Manufacturers software that identifies a feature to be expressed if it is significantly above the microarray background.The expression matrix is freely available without any restriction (Supplemental Table 9).Since miRNA measurements were not always normally distributed (according to Shapiro Wilk Normality tests), non-parametric Wilcoxon Mann-Whitney (WMW) test have been performed in addition to the parametric t-test. If not mentioned explicitly, p-values in the manuscript rely on the WMW test. Because of the explorative nature of our study nominal p-values are reported. To assess differential expression of miRNAs, the area under the curve (AUC) has been computed in addition to p-values. Note that the AUC is closely related to the effect size of the WMW test. Here, an AUC close to 0.5 means no dys-regulation, an AUC below 0.5 means higher expression in controls and an AUC above 0.5 means higher expression in cancer patients. An AUC of 1 in turn means that the lowest expression in a cancer patients is above the highest in a control patient and vice versa an AUC of 0 means that the lowest expression in a control patient is above the highest expression in cancer samples.To compute the density of AUC values, the em algorithm for mixtures of univariate normal the normalmixEM from the R mixtools package has been applied assuming two components. To assess sources of data variability, Principal Variance Component Analysis (PVCA) using the Bioconductor pvca package has been performed. To learn cancer and time patterns we applied one type of artificial neural networks (aNN), so called self-organized maps (SOMs). The computations have been performed using the kohonen and somgrid package from R. We used a hexagonal 10 × 10 grid to group the 435 serum miRNAs. As feature vector, the AUC values for the different comparisons were used. The data set was presented 10,000 times to the SOM with a learning rate linearly decreasing from 0.05 to 0.01. To cluster the SOM results, hierarchical clustering using the hclust function has been performed. All downstream analyses have been carried out with R (R 3.3.2 GUI 1.68 Mavericks build (7288)).
Pathway analysis
As pathway analysis we used the newest release of our miEAA tool [Citation40] (https://anathema.cs.uni-saarland.de/mieaa_tool/).We performed a so-called Over-Representation analysis by uploading the relevant miRNAs and comparing them against the human background. We allowed only categories with at least three miRNAs contained in order to exclude very small categories showing an arbitrary enrichment (e.g. a category with an expected number of 0.1 miRNAs and one miRNA observed would show an enrichment factor of 10). We set the nominal alpha level to 0.05 and only considered categories with an enrichment factor of at least 1.2.
Supplemental Material
Download Zip (1.5 MB)Data Availability Statement
The expression intensities of the miRNAs included in the study are available as Supplemental Material. The expression matrix is annotated with the disease arm the sample has been picked (lung, colon or breast cancer arm), whether it belongs to a patient or a control in this study arm and the respectivetime point.
Disclosure statement
No potential conflict of interest was reported by the authors.
Supplemental material
Supplemental data for this article can be accessed here.
Additional information
Funding
References
- He L, Hannon GJ. MicroRNAs: small RNAs with a big role in gene regulation. Nat Rev Genet. 2004;5(7):522–531.
- Bartel DP. MicroRNAs: genomics, biogenesis, mechanism, and function. Cell. 2004;116(2):281–297.
- Hart M, Kern F, Backes C, et al. The deterministic role of 5-mers in microRNA-gene targeting. RNA Biol. 2018;15(6):819–825.
- Lu J, Getz G, Miska EA, et al. MicroRNA expression profiles classify human cancers. Nature. 2005;435(7043):834–838.
- Maciotta S, Meregalli M, Torrente Y. The involvement of microRNAs in neurodegenerative diseases. Front Cell Neurosci. 2013;7:265.
- Backes C, Meese E, Keller A. Specific miRNA disease biomarkers in blood, serum and plasma: challenges and prospects. Mol Diagn Ther. 2016;20(6):509–518.
- Fehlmann T, Ludwig N, Backes C, et al. Distribution of microRNA biomarker candidates in solid tissues and body fluids. RNA Biol. 2016;13(11):1084–1088.
- Hjerkind KV, Gislefoss RE, Tretli S, et al. cohort profile update: the janus serum bank cohort in Norway. Int J Epidemiol. 2017;46(4):1101–2f.
- Jellum E, Andersen A, Lund-Larsen P, et al. The JANUS serum bank. Sci Total Environ. 1993;139-140:527–535.
- Gislefoss RE, Grimsrud TK, Morkrid L. Long-term stability of serum components in the Janus Serum Bank. Scand J Clin Lab Invest. 2008;68(5):402–409.
- Langseth H, Gislefoss RE, Martinsen JI, et al. Cohort profile: the janus serum bank cohort in Norway. Int J Epidemiol. 2017;46(2):403–4g.
- Fehlmann T, Backes C, Alles J, et al. A high-resolution map of the human small non-coding transcriptome. Bioinformatics. 2018;34(10):1621–1628.
- Keller A, Leidinger P, Vogel B, et al. miRNAs can be generally associated with human pathologies as exemplified for miR-144. BMC Med. 2014;12(1):224.
- Keller A, Leidinger P, Bauer A, et al. Toward the blood-borne miRNome of human diseases. Nat Methods. 2011;8(10):841–843.
- Alles J, Fehlmann T, Fischer U, et al. An estimate of the total number of true human miRNAs. Nucleic Acids Res. 2019;47(7):3353–3364.
- Keller A, Meese E. Can circulating miRNAs live up to the promise of being minimal invasive biomarkers in clinical settings? Wiley Interdiscip Rev RNA. 2016;7(2):148–156.
- Keller A, Rounge T, Backes C, et al. Sources to variability in circulating human miRNA signatures. RNA Biol. 2017;14(12):1791–1798.
- Rounge TB, Umu SU, Keller A, et al. Circulating small non-coding RNAs associated with age, sex, smoking, body mass and physical activity. Sci Rep. 2018;8(1):17650.
- Keller A, Leidinger P, Gislefoss R, et al. Stable serum miRNA profiles as potential tool for non-invasive lung cancer diagnosis. RNA Biol. 2011;8(3):506–516.
- Umu SU, Langseth H, Keller A, et al. A 10-year prediagnostic follow-up study shows that serum RNA signals are highly dynamic in lung carcinogenesis. Mol Oncol. 2020;14(2):235–247.
- Baglietto L, Ponzi E, Haycock P, et al. DNA methylation changes measured in pre-diagnostic peripheral blood samples are associated with smoking and lung cancer risk. Int J Cancer. 2017;140:50–61.
- Fasanelli F, Baglietto L, Ponzi E, et al. Hypomethylation of smoking-related genes is associated with future lung cancer in four prospective cohorts. Nat Commun. 2015;6(1):10192.
- Meng S, De Vivo I, Liang L, et al. Pre-diagnostic leukocyte mitochondrial DNA copy number and risk of lung cancer. Oncotarget. 2016;7(19):27307–27312.
- Dai L, Tsay JC, Li J, et al. Autoantibodies against tumor-associated antigens in the early detection of lung cancer. Lung Cancer. 2016;99:172–179.
- Zhou B, Shu B, Yang J, et al. C-reactive protein, interleukin-6 and the risk of colorectal cancer: a meta-analysis. Cancer Causes Control. 2014;25(10):1397–1405.
- Touvier M, Fezeu L, Ahluwalia N, et al. Pre-diagnostic levels of adiponectin and soluble vascular cell adhesion molecule-1 are associated with colorectal cancer risk. World J Gastroenterol. 2012;18(22):2805–2812.
- Opstal-van Winden AW, Krop EJ, Karedal MH, et al. Searching for early breast cancer biomarkers by serum protein profiling of pre-diagnostic serum; a nested case-control study. BMC Cancer. 2011;11(1):381.
- Trabert B, Pinto L, Hartge P, et al. Pre-diagnostic serum levels of inflammation markers and risk of ovarian cancer in the prostate, lung, colorectal and ovarian cancer (PLCO) screening trial. Gynecol Oncol. 2014;135(2):297–304.
- Kohonen T. Self-organized formation of topologically correct feature maps. Biol Cybern. 1982;43(1):59–69.
- Meder B, Backes C, Haas J, et al. Influence of the confounding factors age and sex on microRNA profiles from peripheral blood. Clin Chem. 2014;60(9):1200–1208.
- Ludwig N, Hecksteden A, Kahraman M, et al. Spring is in the air: seasonal profiles indicate vernal change of miRNA activity. RNA Biol. 2019;16(8):1034–1043.
- ElSharawy A, Keller A, Flachsbart F, et al. Genome-wide miRNA signatures of human longevity. Aging Cell. 2012;11(4):607–616.
- Nagy ZB, Barták BK, Kalmár A, et al. Comparison of circulating miRNAs expression alterations in matched tissue and plasma samples during colorectal cancer progression. Pathol Oncol Res. 2019;25(1):97–105.
- Usuba W, Urabe F, Yamamoto Y, et al. Circulating miRNA panels for specific and early detection in bladder cancer. Cancer Sci. 2019;110(1):408–419.
- Zhang Y, Kang R, Liu W, et al. Identification and analysis of P53-mediated competing endogenous RNA network in human hepatocellular carcinoma. Int J Biol Sci. 2017;13(9):1213–1221.
- Zaporozhchenko IA, Ponomaryova AA, Rykova EY, et al. The potential of circulating cell-free RNA as a cancer biomarker: challenges and opportunities. Expert Rev Mol Diagn. 2018;18(2):133–145.
- Fitzgerald RC. Big data is crucial to the early detection of cancer. Nat Med. 2020;26(1):19–20.
- Fehlmann T, Kahraman M, Ludwig N, et al. Evaluating the use of circulating MicroRNA profiles for lung cancer detection in symptomatic patients. JAMA Oncol. 2020;6(5):714.
- Blondal T, Jensby Nielsen S, Baker A, et al. Assessing sample and miRNA profile quality in serum and plasma or other biofluids. Methods. 2013;59(1):S1–6.
- Backes C, Khaleeq QT, Meese E, et al. miEAA: microRNA enrichment analysis and annotation. Nucleic Acids Res. 2016;44(W1):W110–6.