
ABSTRACT
MicroRNAs (miRNAs) are a class of small noncoding RNAs about 22-nucleotide (nt) in length that collectively regulate more than 60% of coding genes. Aberrant miRNA expression is associated with numerous diseases, including cancer. miRNA biogenesis is licenced by the ribonuclease (RNase) III enzyme Drosha, the regulation of which is critical in determining miRNA levels. We and others have previously revealed that alternative splicing regulates the subcellular localization of Drosha. To further investigate the alternative splicing landscape of Drosha transcripts, we performed PacBio sequencing in different human cell lines. We identified two novel isoforms resulting from partial intron-retention in the region encoding the Drosha catalytic domain. One isoform (AS27a) generates a truncated protein that is unstable in cells. The other (AS32a) produces a full-length Drosha with a 14 amino acid insertion in the RIIID domain. By taking advantage of Drosha knockout cells in combination with a previously established reporter assay, we demonstrated that Drosha-AS32a lacks cleavage activity. Furthermore, neither Drosha-27a nor Drosha-32a were able to rescue miRNA expression in the Drosha knockout cells. Interestingly, both isoforms were abundantly detected in a wide range of cancer cell lines (up to 15% of all Drosha isoforms). Analysis of the RNA-seq data from over 1000 breast cancer patient samples revealed that the AS32a is relatively more abundant in tumours than in normal tissue, suggesting that AS32a may play a role in cancer development.
KEYWORDS:
Introduction
Drosha, a conserved RNase III enzyme required for viability in animals, plays an essential role in processing cellular double-stranded RNAs (dsRNAs) [Citation1,Citation2]. Drosha is critical for the maturation of microRNAs (miRNAs) [Citation3], which collectively regulate more than half of all protein-coding transcripts in human cells [Citation4]. Drosha interacts with dsRNA-binding protein DGCR8 to form the Microprocessor complex [Citation5,Citation6], which releases hairpin-shaped miRNA precursors (pre-miRNA) from larger RNA polymerase II (Pol II)–driven primary transcripts (pri-miRNA) in the nucleus [Citation7]. Cellular RNAs containing similar stem-loop structures are potential targets for Drosha processing. Recent reports suggest a function for Drosha in rRNA processing and the degradation of certain mRNAs [Citation8–11], thus extending its role beyond miRNA biogenesis.
The expression and function of Microprocessor components are often dysregulated in cancer and result in aberrant miRNA expression [Citation12–14]. Drosha downregulation and the corresponding reduction in miRNA are correlated with metastasis, invasion, and poor patient survival rates [Citation15–18]. This highlights the importance of clarifying the mechanism by which Drosha-mediated miRNA biogenesis is controlled. However, the majority of current knowledge on this topic is drawn from experiments performed within cell-free or reconstituted systems; how Drosha activity is regulated in physiology and diseases remains largely elusive.
Human Drosha contains two RNase III domains (RIIIDa and RIIIDb) and a dsRNA-binding domain (dsRBD) in the C-terminus, a central domain (CED) in the middle of the protein, and an N-terminal domain essential for nuclear localization [Citation19–21]. Drosha mRNA contains 36 exons. Previously, we and others identified several Drosha isoforms including one in which the exon containing the nuclear localization signal (NLS) is skipped [Citation22,Citation23]. This established alternative splicing as one of the mechanisms involved in regulating Drosha subcellular localization. Drosha transcripts were also shown to be abnormally spliced in melanoma and teratocarcinoma cells, resulting in the production of C-terminal truncated, non-functional Drosha proteins [Citation24]. These findings suggest that alternative splicing might play a profound role in regulating Drosha activity.
Here, we investigated the alternative splicing landscape of Drosha mRNA in a variety of human cell lines by PacBio sequencing. We found that the Drosha transcript undergoes extensive alternative splicing to generate many isoforms. We identified two novels and relatively abundant isoforms, both of which contain a partial retention of an intron in the region encoding the RNase III domain (RIIID). Drosha proteins derived from these two variants are incapable of cleaving pri-miRNA and non-functional in miRNA biogenesis. These isoforms were detected in multiple cancer cell lines and their levels were upregulated in a subset of breast cancer patients, suggesting that they may play a role in cancer development.
Results
Identification of novel Drosha splicing variants in multiple human cell lines
To comprehensively profile Drosha alternative splicing isoforms, we characterized Drosha transcripts in a transformed human cell line (HEK293T) as well as in cancer cell lines derived from cervical cancer (HeLa), breast cancer (MCF-7) and osteosarcoma (U2OS). First, we measured the transcription start site (TSS) of Drosha transcripts in these 4 cell lines using 5ʹ RACE. While multiple TSS were detected, all were mapped into a narrow (~40nt) window relatively close to the annotated TSS in Genome Browser [Citation25] (Supplemental Fig. S1). Using a poly-dT primer together with a Drosha-specific primer to target a region downstream of these detected TSS, we were able to convert all Drosha splicing variants into cDNAs via RT-PCR. The resulting cDNA libraries were subjected to PacBio sequencing. Different from RNA-seq (which relies on mapping short reads of exon-exon junctions and is somewhat inefficient at identifying de novo isoforms), PacBio sequencing generates full-length sequences of all isoforms resulting from alternative splicing ().
Figure 1. Identification of Drosha splice variants in human cells.
We obtained more than 50,000 long reads from each cell line (Supplemental Table S1). After removing chimeric reads that resulted from PCR error and/or undesired ligation between cDNAs, we were able to uniquely map ~80% of the remaining non-chimeric reads back to the genomic sequence. Surprisingly, only a small portion of these were derived from Drosha transcripts, indicating that the primer used for RT-PCR is not specific to Drosha. Nonetheless, approximately 1000–2500 Drosha cDNA sequences were generated from each cell line, a number which is in theory sufficient to detect rare Drosha isoforms with a relative abundance as low as 0.1%.
Consistent with previous reports from us and others [Citation22,Citation23], Drosha splicing variants are highly prevalent, occupying more than half of the PacBio reads in all 4 cell lines (). While alternative splicing was observed in the 5ʹ untranslated region (UTR) and alternative polyadenylation (APA) was observed in the 3ʹ UTR, we focused on events that occurred within the Drosha coding sequence (CDS) and were more likely to have a direct functional impact. Our analysis of the most abundant isoforms in HEK293T cells confirmed the previously established alternative splicing events in which exon6, exon7, or both are skipped. Interestingly, two novel alternative splicing events were also observed: one with a partial intron inclusion (exon27a) between exon27 and exon28, and the other with a partial intron inclusion (exon32a) between exon32 and exon33 (). We named these two variants AS27a and AS32a, respectively. Nearly all combinations among skipping of exon6 and/or exon7 and inclusion of exon27a and/or exon32a were detected, suggesting that it is unlikely that these alternative splicing events are coupled. Similar observations were made in Hela, MCF-7 and U2OS cells (Supplemental Fig. S2), indicating that the occurrence of these variants is not limited to one cell type.
To validate the PacBio sequencing results, we amplified the cDNAs using PCR with two primer sets that spanned exon27-exon28 and exon32-exon33, respectively. As expected, each set generated two bands with the predicted sizes for wildtype full-length and the product of alternative splicing (); Sanger sequencing confirmed that one band resulted from the wildtype transcript while the other represented the intron inclusion variant. To determine the relative abundance of AS27a and AS32a variants compared to the full-length transcript, we performed quantitative RT-PCR (qRT-PCR) by using variant-specific primers and probes. Consistent with the PacBio results, the levels of AS32a and AS27a are relatively low, ranging from 2% to 12% of total Drosha transcripts in the 4 cell lines tested (, Supplemental Fig. S3).
Drosha-AS27a is truncated and unstable; Drosha-AS32a has an insertion in the RIIID domain and lacks cleavage activity
Interestingly, insertions of AS27a and AS32a are both located in Drosha RIIID, the catalytic domain responsible for cleavage activity of the enzyme (). The insertion sizes of AS27a and AS32a are 129 and 42nt, respectively, and while both insertions are apparently in-frame, further investigation revealed that the insertion of AS27a contains a premature stop codon. Therefore, the Drosha protein derived from AS27a isoform (Drosha-AS27a) is predicted to be truncated at the C-terminal, losing the RIIIDb and the downstream dsRBD domain. Drosha-AS32a, on the other hand, is predicted to be a full-length protein with a 14aa insertion at the c-terminal end of the RIIIDb domain, which disrupts one of the three signature RNase III motifs.
Figure 2. Characterization of Drosha-AS27a and Drosha-AS32a isoforms.
To validate these predictions, we cloned the cDNAs of full-length Drosha (Drosha-FL), AS27a and AS32a into FLAG-tagged expression plasmids. Taking advantage of a Drosha knockout HEK293T cell line established previously by our group [Citation22], we were able to express and examine these Drosha variants free of interference from endogenous enzyme. As expected, results from western blots performed with an antibody against Drosha indicated that Drosha-AS27a is a truncated protein and Drosha-AS32a is slightly longer than Drosha-FL (). Interestingly, while Drosha-AS32a was expressed at a similar level to that of Drosha-FL, Drosha-AS27a was barely detectable. To rule out the possibility that this was an artefact caused by inefficient recognition of the truncated protein by the anti-Drosha antibody, we repeated the western blot with an antibody against the FLAG tag and observed a similar result (). Quantitative, real-time RT-PCR showed that the level of Drosha-AS27a mRNA was similar to, if not higher than that of Drosha-FL and Drosha-AS32a (). Together, these results strongly suggest that the Drosha-AS27a protein is unstable in cells. Supporting this idea, blocking proteasome activity by MG341 treatment led to accumulation of Drosha-AS27a (). Given that Drosha-AS27a lacks the C-terminus required for DGCR8 association [Citation20], it is possible that the Drosha-AS27a protein is unable to form the Microprocessor complex with DGCR8 and therefore prone to degradation.
Next, we investigated whether Drosha-32a (the full-length protein with a 14aa insertion) retained cleavage activity towards pri-miRNA using a previously established reporter system that measures the Drosha cleavage in cells [Citation22]. Briefly, two luciferase reporter constructs harbouring either pri-miR-16 or pri-let-7a in the 3ʹUTR were co-transfected into Drosha knockout cells together with either a control plasmid or a plasmid expressing Drosha-FL or Drosha-AS32a. In the assay, Drosha cleavage of the pri-miRNA sequence triggers degradation of the luciferase transcripts which in turn results in reduced luciferase activity. Drosha cleavage efficiency can thus be measured by comparing luciferase activity in the presence and absence of Drosha protein (Supplemental Fig. S4). While expression of Drosha-FL reduced reporter activity by >90%, no reduction was observed when Drosha-AS32a was expressed (). Given that a single cut by Drosha is sufficient to reduce reporter expression (Supplemental Fig. S4), these observations indicate that the AS32a insertion at the C-terminal end of RIIIDb domain completely abolished the cleavage activity of Drosha from both RIIIDa and RIIIDb domains.
AS27a and AS32a are incapable of pri-miRNA processing
Our results strongly suggest that both AS27a and AS32a splicing variants were non-functional in miRNA biogenesis, as proteins generated from these two variants lack either stability or cleavage activity. To test this directly, we performed a genetic complementation assay in Drosha KO HEK293T cells (with corresponding wildtype cells as a control; ). To facilitate detection of miRNAs, we cloned the genomic sequence of pri-miR-16 and its surrounding sequence (~200nt on each side) into a CMV (Pol II)-driven transcription vector and co-expressed pri-miR-16 with various Drosha variants. As expected, we were able to detect both pre-miR-16 and mature miR-16 by northern blot in wildtype HEK293T cells but not in Drosha KO cells (). Co-expression of Drosha-FL rescued production of both pre-miR-16 and mature miR-16, but no signal was detected when Drosha-AS27a or Drosha-AS32a was co-expressed (), indicating that neither protein is capable of processing pri-miR-16.
Figure 3. Drosha-AS27a and Drosha-AS32a are deficient in miRNA biogenesis.
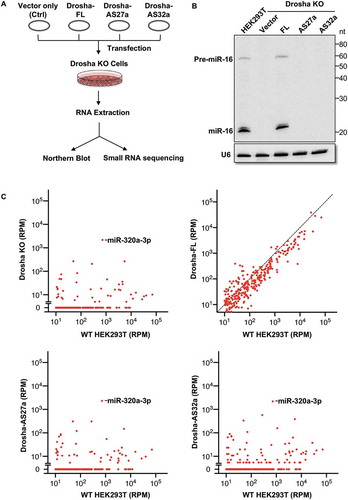
To extend this conclusion to all endogenous miRNAs, we repeated the same experiment without overexpressing pri-miR-16 and performed small RNA sequencing (miRNA-seq). Compared to wildtype HEK293T cells, expression of nearly all endogenous miRNAs in Drosha KO cells was reduced to a level close to noise (<10 reads per million) (). The levels of miRNAs whose biogenesis is known to be independent of Drosha activity (for example, miR-320-3p [Citation26,Citation27]) were elevated, most likely due to an increase in empty Argonaute proteins. While the expression of Drosha-FL restored the miRNA expression profile to be similar to that of wild-type HEK293T cells, expression of neither Drosha-AS27a nor Drosha-32a had any detectable impact on miRNA expression (). These results confirm that Drosha-AS27a and Drosha-AS32a are non-functional in miRNA biogenesis.
Given that Drosha-AS32a contains the C-terminus which is required for DGCR8 association, it is possible that Drosha-AS32a binds DGCR8 to form a non-functional microprocessor that inhibits miRNA biogenesis in a negative-dominant manner. To test this, we overexpressed Drosha-AS32a in wildtype HEK293T cells (Supplemental Fig. S5A) and measured endogenous miRNA expression by deep sequencing. Compared to cells treated with a vector-only control, we did not observe any difference in the miRNA expression profile (Supplemental Fig. S5B). The same experiment performed in HeLa cells generated a similar result (Supplemental Fig. S5C, D), suggesting that non-functional Drosha-AS32a does not interfere with the activity of endogenous Drosha in cultured cells.
AS27a and AS32a are abundant in cancer cell lines and their levels are elevated in some breast cancer patients
Loss of Drosha function caused by alternative splicing is one potential explanation for the downregulation of miRNA commonly observed in many types of cancer [Citation13,Citation14]. To measure the abundance of AS27a and AS32a variants in cancer cells, we analysed the RNA-seq data deposited in the Cancer Cell Line Encyclopaedia (CCLE). Of the 1264 cancer cell lines for which RNA-seq are available, we focused on 340 in which there are sufficient reads of Drosha transcripts. In 330 of these, we were able to detect unique exon-exon junction reads that can only be derived from either AS27a or AS32a transcripts, suggesting that these two variants are highly prevalent in cancer cells. To calculate the relative abundance, we divided the number of reads supporting intron inclusion by the number of reads supporting intron inclusion and exclusion (Supplemental Fig. S6). The result from a subset of cancer cell lines (for which there are sufficient intron-inclusion junction-reads) is plotted in . Consistent with the idea that AS27a and AS32a function redundantly in disrupting Drosha activity, we did not observe any correlation between the frequency of these two variants ().
Figure 4. AS27a and AS32a are abundant in cancer cell lines and their levels are elevated in some breast cancer patients.
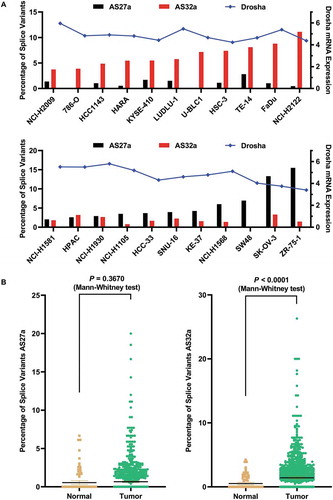
Dysregulation of Drosha function plays a key role in cancer development [Citation28]. We hypothesize that the alternative splicing events leading to the production of non-functional Drosha may contribute to tumorigenesis. To test this, we used RNA-seq data from The Cancer Genome Atlas (TCGA) to compare the alternative splicing events of AS27a and AS32a in cancer and normal tissues. The sequencing depth is rather limited for the majority of samples, which made it challenging to detect AS27a or AS32a variants. Nonetheless, after analysing over 1000 breast cancer patient samples, we found that both the average percentage and the average expression level of AS32a were significantly higher than that of normal tissues (, Supplemental Fig. S7), suggesting that AS32a may have functional relevance in cancer.
To investigate the potential impact of AS32a on miRNA dysregulation, we analysed the corresponding miRNA profiles. On TCGA, miRNA levels were previously normalized and reported as reads per million total miRNA counts. This normalization masked variation of overall miRNAs abundance between samples. Nonetheless, by comparing breast cancer patient samples to normal tissues, we were able to detect relative changes in miRNA profile (Supplemental Fig. S8A). Well-characterized oncogenic miRNAs such as hsa-mir-21 [Citation29] were upregulated while tumour suppressor miRNAs such as hsa-let-7 [Citation30] were downregulated in patient samples (Supplemental Fig. S8A). Applying a similar strategy, we sought to detect the impact of AS32a by comparing patient samples with a relatively high level of Drosha splicing variant to those without any. The top 50 highly expressed miRNAs were analysed (Supplemental Fig. S8B). Consistent with the observation that only AS32a was enriched in the tumour samples (), the level of AS32a correlates to a larger change in miRNA profile than that of AS27a. Interestingly, several miRNAs (such as mir-21) which were upregulated in tumours compared to normal tissues were further increased in patient samples with a high level of AS32a. Likewise, downregulated miRNAs (such as let-7 family members) were further decreased (Supplemental Fig. S8B). Together, these results support a model in which cancer cells use AS32a to modulate miRNA levels, which in turn benefit tumour progression.
Discussion
Given the critical role that miRNA plays in gene regulation, Drosha has been studied extensively. While many cellular factors have been found to modulate Drosha activity [Citation31], little is known about the impact of alternative splicing on Drosha function. Drosha pre-mRNA is over 130kb in size, and has 36 identified exons. Traditional methods such as RT-PCR followed by Sanger sequencing or northern blot are inadequate to characterize the potentially complicated landscape of Drosha isoforms. While RNA-seq has proven to be an effective high-throughput approach for detecting mRNA isoforms, it remains a challenge to correctly assign relatively short (~100 to ~300 nt) exon-exon junction reads to the corresponding isoform. This is particularly problematic when undefined exon-exon junctions are involved. For this reason, RNA-seq is somewhat limited in its ability to identify novel isoforms. PacBio sequencing, on the other hand, generates high-confidence full-length Drosha cDNA sequences without assembly. By applying this approach, we identified two novel alternative splicing events – AS27a and AS32a and validated both by qRT-PCR and Sanger sequencing.
More importantly, measuring the full-length cDNA sequence not only provided a comprehensive survey on alternative splicing events occurring in different regions of Drosha but also enabled us to compare these events without bias. The top four most abundant alternative-spliced isoforms are various combinations of exon6 and exon7 skipping. AS32a and AS27a start to show in the next most abundant group of isoforms, suggesting that AS32a and AS27a are major alternative splicing events, second only to exon6/7 skipping. Previously reported alternative splicing events in which exon31, exon32 and exon33 are skipped in various combinations [Citation24] were observed in our PacBio sequencing results, but at a lower frequency than AS32a or AS27a (Supplemental Table S2).
Consistent with previous reports [Citation22–Citation24], our study revealed that despite a rather complicated landscape of Drosha isoforms, alternative splicing happened at two major regions: one which encodes the NLS and the other which harbours the sequence of the catalytic domain. This striking correlation with Drosha function argues that these events are not random, but rather part of a regulated process in modulating Drosha activity. The fact that AS32a and AS27a are abundant in cancer cell lines and elevated in breast cancer patients supports a model in which cancer cells use AS32a and AS27a to reduce Drosha activity and downregulate miRNA levels, which in turn benefits tumour progression. However, the relatively low frequency of AS32a and AS27a challenges this idea, and questions the biological impact of a mild reduction in Drosha activity. One possibility is that a reduced level (but not total depletion) of miRNAs is beneficial for tumour growth. This would explain why a partial reduction of Drosha activity is observed in cancer cells. Supporting this idea, Dicer (which functions downstream of Drosha in miRNA biogenesis) was shown to be a haploinsufficient tumour suppressor [Citation32,Citation33]. Alternatively, the ectopically expressed Drosha-AS32a in HEK293T cells may not fully recapitulate its function in vivo. Drosha-AS32a might modulate miRNA expression in vivo by interacting with cellular factors which are absent in cultured cells. If true, this helps to explain why we were able to observe a correlation between AS32a level and variation of miRNA profile in breast cancer patients but not in HEK293T cells. Future study is required to understand the mechanisms by which AS32a and AS27a are regulated. We will then be able to manipulate AS32a and AS27a to test their impacts on tumour progression. Finally, it is also possible that the main functions of AS32a and AS27a lie beyond cancer. Further investigation to identify tissues/cells in which these two isoforms are highly prevalent will provide additional insights.
Materials and methods
Cell culture and transfection
HEK293T, HeLa, U2OS, and MCF-7 cells were cultured in DMEM, high glucose (Thermo Fisher Scientific) supplemented with 10% heat-inactivated FBS (Hyclone), 100 U/ml penicillin and 100 pg/ml streptomycin in 5% CO2 at 37°C. Drosha knockout HEK293T cells was described previously [Citation22]. Cell transfections were performed using PolyJet™ DNA Transfection Reagent (SignaGen) according to the manufacturer’s instructions.
RNA isolation
Total RNA was extracted using RNeasy mini kit (Qiagen) or Trizol (Thermo Fisher Scientific) according to the manufacturer’s instructions. Extracted RNA was then treated with DNase I by using DNA-free™ DNA Removal Kit (Thermo Fisher Scientific). The RNA concentration was quantified using a Nanodrop 2000 spectrophotometer (Thermo Fisher Scientific). RNA integrity number (RIN) was assessed on Agilent 2100 Bioanalyzer (Agilent Technologies). All RNA samples used for the following experiments have a RIN around 10.
Rapid amplification of cDNA ends (RACE)
The 5ʹ end of Drosha transcripts was measured by using SMARTer® RACE 5ʹ/3ʹ Kit (Clontech Laboratories) following the manufacturer’s instructions. PCR products were cloned into pCR™2.1-TOPO® vector (Thermo Fisher Scientific) and were subsequently sequenced by Sanger sequencing.
Single-molecule real-time (SMRT) sequencing by Pacific Biosciences (PacBio)
Library preparation of HEK293T, HeLa, U2OS, and MCF-7 was performed in accordance with PacBio user’s manual. Briefly, the cDNA library for each cell line was generated by 3ʹ RACE using SMARTer® RACE 5ʹ/3ʹ Kit (Clontech Laboratories). To capture specific Drosha transcripts, 5ʹ gene-specific primer was used for PCR amplification. The SMRT bell libraries were constructed by using the SMRTbell Template Prep Kit 1.0 (Pacific Biosciences) following manufacturer’s protocol. Each library was then sequenced on one PacBio RSII SMRT cell.
Intra-molecular circular consensus (CCS) reads generated from PacBio sequencing were analysed by Iso-seq standard pipeline. Obtained high-quality isoform consensus sequences were classified as full-length if a matching pair of barcode sequences were observed on the two ends of the read. The full-length reads were then run through an in-house development pipeline which iteratively clustering full-length reads that belong to the same isoform. Redundant sequences which have the same exon structures were collapsed into unique isoforms with total read count for that unique isoform.
Reverse transcription and polymerase chain reaction (RT-PCR)
Reverse transcription of mRNA was carried out with Superscript IV (Thermo Fisher Scientific) and Oligo dT or Random Hexamers according to the manufacturer’s instructions. The PCR was amplified with Phusion® High-Fidelity DNA Polymerase (New England Biolabs) with gene-specific primers. The primer sequences are listed in Supplementary Table S3. Electrophoresis of the PCR product was performed on an agarose gel with SYBR Safe DNA Gel Stain (Thermo Fisher Scientific). Image was obtained and quantified by Chemidoc Touch Imaging System (Bio-Rad).
Quantitative real-time PCR (qPCR)
Quantitative real-time PCR of Drosha isoforms was performed with isoform-specific primers and double-quenched ZEN/Iowa Black FQ probes (Integrated DNA Technologies) on the CFX384 Touch Real-Time PCR Detection System (Bio-Rad). For quantification of Drosha isoforms, plasmids containing cDNA sequences of each isoform were used as templates to test the efficiency of primers and establish standard curves. The relative level of each isoform in HEK293T, HeLa, MCF-7, and U2OS cells was determined with the cycle threshold (CT) value normalized to the standard curves. Sequences of primers and probes are listed in Supplementary Table S3.
Plasmids construction
pcDNA6/FLAG-Drosha was described in previous study [Citation22]. pcDNA6/FLAG-Drosha-AS27a and pcDNA6/FLAG-Drosha-AS32a were generated by mutagenesis using gBlocks® Gene Fragments (IDT). The correct insert sequence in the plasmids was validated by Sanger sequencing. The gblock sequences are listed in Supplementary Table S3. Pri-miR-16 expression plasmid was constructed into pCMV-FLAG vector with restriction sites NotI and SalI.
Western blot
Cells pellets were lysed with M-PER mammalian protein extraction reagent (Thermo Scientific) supplemented with protease inhibitor cocktail (Roche). Protein samples were separated in a 4–15% Mini-PROTEAN® TGX Stain-Free™ Gel and electrotransferred onto a PVDF membrane (Bio-Rad) using Trans-Blot Turbo Transfer System (Bio-Rad). Primary antibodies used in this study are rabbit anti-Drosha (Cell Signalling), mouse anti-FLAG (Sigma) and mouse anti-α-tubulin (Sigma). The signals were developed with Immobilon Western Chemiluminescent HRP Substrate (Millipore) or SuperSignal West Pico Chemiluminescent Substrate (Pierce). The images were obtained by Chemidoc Touch Imaging System (Bio-Rad).
Bortezomib treatment
Drosha knockout HEK293T cells were seeded in a 6-well plate with 8 × 10⁵ cells per well. Transfection of Drosha-AS27a plasmids was performed on the following day as described above. Twenty-four hours post transfection, cells were treated with either 200 nM Bortezomib (MG341) (Selleckchem) or same volume of DMSO for 12 hours. Total protein was extracted from treated cells and the level of Drosha-AS27a protein was determined by Western blot as described above.
Northern blot
Total RNA was electrophoresed on a 15% (w/v) acrylamide/8 M urea gel. After being transferred on Hybond-N1 membranes (Amersham Pharmacia Biotech), the membrane was UV crosslinked and blocked by PerfectHyb Plus Hybridization Buffer (Sigma) at 37°C for 5 min. miR-16 or U6 was detected using 32P-labelled oligonucleotides that are reverse complement to the miR-16 or U6 sequence, respectively. Images were analysed by Typhoon Trio Imaging System (GE Healthcare).
Dual-luciferase assay
Luciferase-based pri-miRNA processing reporters were generated on the psiCHECK-2 vector (Promega) as previously described [Citation22]. A total of 100 ng of pri-miRNA reporters, Drosha plasmids or empty vectors were co-transfected in triplicates into Drosha KO cells in 24-well plates. Cells were harvested at 42–48 h post-transfection. Firefly luciferase and Renilla luciferase were then measured with Promega’s dual-luciferase kit and detected by GloMax®-Multi Luminescence Module (Promega) according to the manufacturer’s instructions.
Small RNA sequencing
Small RNA libraries were prepared with total RNA using the NEBNext Multiplex Small RNA Library Prep Set for Illumina according to the manufacturer’s instructions. The RNA library quality was determined by the Agilent 2100 Bioanalyzer (Agilent), and the quantity was assessed with Qubit dsDNA HS Assay (Thermo Fisher Scientific). Small RNA libraries were sequenced on Illumina Miseq (Illumina) with MiSeq Reagent Kit v3 (Illumina).
Bioinformatic analysis
The small RNA sequencing data were analysed by in-house scripts. Briefly, adaptors were removed, and reads were mapped by using Bowtie to obtain expression profiles. For analysing the percentage of Drosha isoforms in human tissues, the single-end samples from Illumina BodyMap 2.0 (GSE30611) were downloaded and analysed as described previously [Citation22]. For the frequencies of Drosha alternative splicing exon 27a and exon 32a events in cancer cell lines, normal and tumour tissues, RNA sequencing data were obtained from the Cancer Cell Line Encyclopaedia (CCLE) and The Cancer Genome Atlas (TCGA), and analysed with Samtools and QuagmiR in the Cancer Genomics Cloud [Citation34,Citation35].
Statistical analysis
Statistical analysis was performed by the two-tailed, unpaired t-test (GraphPad Prism 8). Differences were considered significant if the P value was <0.05.
Disclosure of potential conflicts of interest
No potential conflicts of interest were disclosed.
Supplemental Material
Download Zip (1 MB)Supplementary material
Supplemental data for this article can be accessed here.
Additional information
Funding
References
- Court DL, Gan J, Liang Y-H, et al. RNase III: genetics and function; structure and mechanism. Annu Rev Genet. 2013;47:405–431.
- Chong MMW, Zhang G, Cheloufi S, et al. Canonical and alternate functions of the microRNA biogenesis machinery. Genes Dev. 2010 Sept 1;24(17):1951–1960.
- Lee Y, Ahn C, Han J, et al. The nuclear RNase III Drosha initiates microRNA processing. Nature. 2003 Sept 25;425(6956):415–419.
- Bartel DP. Metazoan MicroRNAs. Cell. 2018 Mar 22;173(1):20–51.
- Denli AM, Tops BBJ, Plasterk RHA, et al. Processing of primary microRNAs by the Microprocessor complex. Nature. 2004 Nov 11;432(7014):231–235.
- Gregory RI, Yan K-P, Amuthan G, et al. The Microprocessor complex mediates the genesis of microRNAs. Nature. 2004 Nov 11;432(7014):235–240.
- Ha M, Kim VN. Regulation of microRNA biogenesis. Nat Rev Mol Cell Biol. 2014 Aug;15(8):509–524.
- Triboulet R, Chang H-M, Lapierre RJ, et al. Post-transcriptional control of DGCR8 expression by the Microprocessor. RNA. 2009 June;15(6):1005–1011.
- Karginov FV, Cheloufi S, Chong MMW, et al. Diverse endonucleolytic cleavage sites in the mammalian transcriptome depend upon microRNAs, Drosha, and additional nucleases. Mol Cell. 2010 June 25;38(6):781–788.
- Lin Y-T, Sullivan CS. Expanding the role of Drosha to the regulation of viral gene expression. Proc Natl Acad Sci USA. 2011 July 5;108(27):11229–11234.
- Han J, Pedersen JS, Kwon SC, et al. Posttranscriptional crossregulation between Drosha and DGCR8. Cell. 2009 Jan 9;136(1):75–84.
- Sun K, Lai EC. Adult-specific functions of animal microRNAs. Nat Rev Genet. 2013 Aug;14(8):535–548.
- Lin S, Gregory RI. MicroRNA biogenesis pathways in cancer. Nat Rev Cancer. 2015 June;15(6):321–333.
- Peng Y, Croce CM. The role of MicroRNAs in human cancer. Signal Transduct Target Ther. 2016 Jan 28;1:15004.
- Iorio MV, Ferracin M, Liu C-G, et al. MicroRNA gene expression deregulation in human breast cancer. Cancer Res. 2005 Aug 15;65(16):7065–7070.
- Thomson JM, Newman M, Parker JS, et al. Extensive post-transcriptional regulation of microRNAs and its implications for cancer. Genes Dev. 2006 Aug 15;20(16):2202–2207.
- Merritt WM, Lin YG, Han LY, et al. Dicer, Drosha, and outcomes in patients with ovarian cancer. N Engl J Med. 2008 Dec 18;359(25):2641–2650.
- Volinia S, Calin GA, Liu C-G, et al. A microRNA expression signature of human solid tumors defines cancer gene targets. Proc Natl Acad Sci USA. 2006 Feb 14;103(7):2257–2261.
- Han J, Lee Y, Yeom K-H, et al. The Drosha-DGCR8 complex in primary microRNA processing. Genes Dev. 2004 Dec 15;18(24):3016–3027.
- Nguyen TA, Jo MH, Choi Y-G, et al. Functional anatomy of the human microprocessor. Cell. 2015 June 4;161(6):1374–1387.
- Kwon SC, Nguyen TA, Choi Y-G, et al. Structure of human DROSHA. Cell. 2016 Jan 14;164(1–2):81–90.
- Dai L, Chen K, Youngren B, et al. Cytoplasmic Drosha activity generated by alternative splicing. Nucleic Acids Res. 2016 Dec 1;44(21):10454–10466.
- Link S, Grund SE, Diederichs S. Alternative splicing affects the subcellular localization of Drosha. Nucleic Acids Res. 2016 June 20;44(11):5330–5343.
- Grund SE, Polycarpou-Schwarz M, Luo C, et al. Rare Drosha splice variants are deficient in microRNA processing but do not affect general microRNA expression in cancer cells. Neoplasia. 2012 Mar;14(3):238–248.
- Kent WJ, Sugnet CW, Furey TS, et al. The human genome browser at UCSC. Genome Res. 2002 June;12(6):996–1006.
- Xie M, Li M, Vilborg A, et al. Mammalian 5ʹ-capped microRNA precursors that generate a single microRNA. Cell. 2013 Dec 19;155(7):1568–1580.
- Zamudio JR, Kelly TJ, Sharp PA. Argonaute-bound small RNAs from promoter-proximal RNA polymerase II. Cell. 2014 Feb 27;156(5):920–934.
- Allegra D, Bilan V, Garding A, et al. Defective DROSHA processing contributes to downregulation of MiR-15/-16 in chronic lymphocytic leukemia. Leukemia. 2014 Jan;28(1):98–107.
- Pfeffer SR, Yang CH, Pfeffer LM. The Role of miR-21 in Cancer. Drug Dev Res. 2015 Sept;76(6):270–277.
- Roush S, Slack FJ. The let-7 family of microRNAs. Trends Cell Biol. 2008 Oct;18(10):505–516.
- Treiber T, Treiber N, Meister G. Regulation of microRNA biogenesis and its crosstalk with other cellular pathways. Nat Rev Mol Cell Biol. 2019;20(1):5–20.
- Kumar MS, Pester RE, Chen CY, et al. Dicer1 functions as a haploinsufficient tumor suppressor. Genes Dev. 2009 Dec 1;23(23):2700–2704.
- Lambertz I, Nittner D, Mestdagh P, et al. Monoallelic but not biallelic loss of Dicer1 promotes tumorigenesis in vivo. Cell Death Differ. 2010 Apr;17(4):633–641.
- Lau JW, Lehnert E, Sethi A, et al. The cancer genomics cloud: collaborative, reproducible, and democratized-a new paradigm in large-scale computational research. Cancer Res. 2017 Nov 1;77(21):e3–6.
- Bofill-De Ros X, Chen K, Chen S, et al. QuagmiR: a cloud-based application for isomiR big data analytics. Bioinformatics. 2019 May 1;35(9):1576–1578.