
 ?Mathematical formulae have been encoded as MathML and are displayed in this HTML version using MathJax in order to improve their display. Uncheck the box to turn MathJax off. This feature requires Javascript. Click on a formula to zoom.
ABSTRACT
The well-established Shine-Dalgarno model suggests that translation initiation in bacteria is regulated via base-pairing between ribosomal RNA (rRNA) and mRNA. We used novel computational analyses and modelling of 823 bacterial genomes coupled with experiments to demonstrate that rRNA-mRNA interactions are diverse and regulate all translation steps from pre-initiation to termination. Previous research has reported the significant influence of rRNA-mRNA interactions, mainly in the initiation phase of translation. The results reported in this paper suggest that, in addition to the rRNA-mRNA interactions near the start codon that trigger initiation in bacteria, rRNA-mRNA interactions affect all sub-stages of the translation process (pre-initiation, initiation, elongation, termination). As these interactions dictate translation efficiency, they serve as an evolutionary driving force for shaping transcripts in bacteria while considering trade-offs between the effects of different interactions across different transcript regions on translation efficacy and efficiency. We observed selection for strong interactions in regions where such interactions are likely to enhance initiation, regulate early elongation, and ensure translation termination fidelity. We discovered selection against strong interactions and for intermediate interactions in coding regions and presented evidence that these patterns maximize elongation efficiency while also enhancing initiation. These finding are relevant to all biomedical disciplines due to the centrality of the translation process and the effect of rRNA-mRNA interactions on transcript evolution.
Introduction
The Shine-Dalgarno (SD) sequence or ribosome binding site (RBS) region, which is located approximately 8–10 nucleotides upstream of the start codon in prokaryotic mRNA [Citation1] [Citation2], is known to be involved in prokaryotic translation initiation via base-pairing to a complementary sequence in the 16S rRNA component of the small ribosomal subunit – theanti-Shine-Dalgarno (aSD) sequence [Citation1,Citation2–4].
Recent studies have suggested that sequences (motifs) within the coding region that interact with the aSD, similarly to the SD, can slow down or pause translation elongation in several bacteria species [Citation5,Citation6,Citation7]. Thus, it was suggested that such sequences in the coding region decrease the overall translation rate and can generally be considered deleterious. Other studies have suggested that selection against internal SD-like sequences that promote rRNA-mRNA interactions can act against codons that tend to compose such motifs [Citation8,Citation9].
Here, based on a comprehensive analysis of 823 prokaryotic genomes investigating all possible positions across all transcripts (i.e. 2,896,245 transcripts), we provide a high-resolution model of rRNA-mRNA interactions during translation, which suggests that the current knowledge about the function of rRNA-mRNA interactions is just the ‘tip of the iceberg’: in most of the analysed bacteria, rRNA-mRNA interactions seem to be involved in all stages and sub-stages of translation and not just in the initiation phase as was known to date (Figure S1). Protein abundance is known to be affected by various gene expression steps such as transcription, translation, mRNA degradation, and protein degradation. In this study we focus on the translation step which is known to consume most of the energy in the cell [Citation10,Citation11] and suggest that all its sub-steps are affected by rRNA-mRNA interactions. Thus, rRNA-mRNA interactions affect how evolution shapes the nucleotide composition along the entire transcript to optimize translation.
Results
To understand the interactions between the 16S rRNA and mRNAs across the bacterial kingdom, we developed a high-resolution computational model to predict rRNA-mRNA interactions’ strength, where low hybridization free energy indicates a stronger interaction (Material and Methods section). We used our model to analyse the entire transcriptome of 823 bacterial species, investigating all possible positions across all transcripts (i.e. 2,896,245 transcripts). To detect evolutionary selection patterns, we performed various statistical tests to compare the distribution of rRNA-mRNA interaction strength in each position along the transcriptome of each genome to the one expected by a null model. We reported positions with significant difference from the null model. We aimed to show that the probability of randomly getting a certain strength of interaction is very low, given the null model, and computed a p-value for this (significance level). The null model preserves the codon frequency, amino acid content, and GC content in each transcript (Material and Methods section). Therefore, the deviations towards extreme interactions that maintain all our statistical questions suggest that the transcripts are under selection. It is important to mention that our analysis is at a genome-scale level, which means that many genes contribute to each position’s significant level.
For each position along the transcriptome, we performed three statistical tests to answer the following questions:
1) Does the nucleotide (nt) sequences in that position tend to produce stronger rRNA-mRNA interactions than expected by the null model?
A positive answer to this question supports the conjecture that strong interactions in this position in the transcript tend to improve the translation.
2) Does the nt sequences in that position tend to produce weaker rRNA-mRNA interactions than expected by the null model?
A positive answer to this question supports the conjecture that weak interactions in the position in the transcript tend to improve the translation.
3) Does the nt sequences in that position tend to produce intermediate (moderate strength: neither very strong nor very weak) rRNA-mRNA interactions in comparison to what is expected by a null model? (see ) and Material and Methods section).
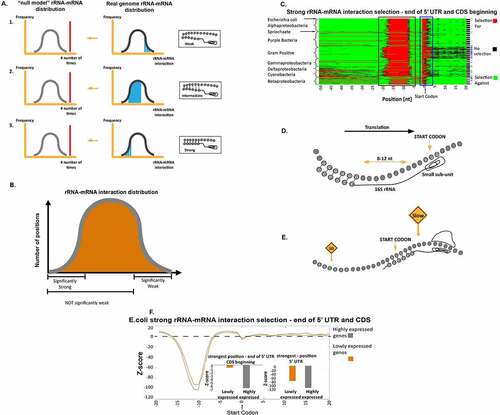
Figure 1. Prediction of rRNA-mRNA interaction strength and selection for or against strong rRNA-mRNA interactions at the 5ʹUTR and at the beginning of the coding region. (a) The three statistical tests to detect evolutionary selection for different rRNA-mRNA interaction strengths (see Material and Methods section). 1. Enrichment of sub-sequences with weak rRNA-mRNA interactions (higher rRNA-mRNA interaction values, i.e. right tail of the distribution); 2. Enrichment of sub-sequences with intermediate rRNA-mRNA interactions (not weak and not strong rRNA-mRNA interaction values), and 3. Enrichment of sub-sequences with strong rRNA-mRNA interactions (lower rRNA-mRNA interaction values, i.e. the left tail of the distribution). We examined weak, intermediate, and strong rRNA-mRNA interaction strengths separately. In each case, we tested if their number or mean value was significantly higher than expected by the null mode rRNA-mRNA interaction values distribution. (b) Explanation of the statistical questions. The statistical questions we asked are not complementary to each other. (c) Results of the test for selection of strong interactions in the 5ʹUTR and first 20 nucleotides of the coding region. Each row represents a bacterium, rows are clustered based on phyla, and each column is a position in the transcripts of the analysed organisms. Red and green indicate a position with significant selection for and against strong rRNA-mRNA interaction compared to the null model, respectively. Black indicates a position with no significant selection (Material and Methods section). The second column from the right: a black pixel represents a bacterium. The number of positions with significant selection for strong interactions was significantly higher than the null model in the 5ʹUTR. Rightmost column: a blue pixel represents a bacterium for which the number of significant positions with selection for strong interactions was significantly higher than the null model in the last nucleotide of the 5ʹUTR and the first five nucleotides of the coding region. (d) An illustration of the way strong rRNA-mRNA interactions affect translation initiation: The rRNA-mRNA interactions upstream of the start codon initiate translation by aligning the small subunit of the ribosome to the canonical start codon. (e) An illustration of the suggested model: strong interactions at the first elongation steps slow down the ribosome movement. (f) Z-scores for rRNA-mRNA interaction strengths at the last 20 nucleotides of the 5ʹUTR and first 20 nucleotides of the coding regions in highly and lowly expressed E. coli genes. Lower/higher Z-scores indicate selection for/against strong rRNA-mRNA interactions, respectively, in comparison to what is expected by the null model. Highly and lowly expressed genes were selected according to protein abundance. Insets: two bar graphs of the Z-scores in highly and lowly expressed genes in the two regions of the reported signals
A positive answer to this question supports the conjecture that intermediate interactions in the position in the transcript tend to improve the translation.
Significant positions related to all the tests above were reported based on a p-value threshold of 0.05. Since we performed multiple statistical tests for each base-pair to deal with multiple hypothesis testing issues, we performed the same analysis on the null model genomes to estimate the false discovery rate (FDR) (Figure S2). We found it to be a few percentages in all the reported results. The different definitions of the statistical tests appear in ) and ).
We report the following observed general tendencies of sub-sequences within different transcript regions to produce different strength interactions with the 16S rRNA: Strong interactions at the beginning and end of a transcript, Intermediate and Weak interactions at the middle of the transcript.
Translation initiation and early translation elongation are regulated by selection for strong interactions at the 5ʹend
First, we analysed the 5ʹUTRs of 551 bacteria with aSD (anti-Shine Dalgarno) sequence in the rRNA. It was suggested that translation initiation in prokaryotes is initiated by hybridization of the 16S rRNA to the mRNA [Citation2]. The 16S rRNA binds to the 5ʹUTR near and upstream of the START codon [Citation4], as depicted in ). Indeed, as can be seen in ) (brown box) in almost all of the analysed bacteria, there is a significant signal of selection for strong rRNA-mRNA interactions at positions −8 through −17 relative to the START codon, this result is in agreement with the Shine-Dalgarno model [Citation1] [Citation2].
The second signal of selection for strong rRNA-mRNA interactions appears in the last nucleotide of the 5ʹUTR and the first five nucleotides of the coding sequence (), blue box). Since the elongating ribosome is positioned around 11 nucleotides downstream of the position its rRNA interacts with the mRNA [Citation12], these rRNA-mRNA interactions are likely related to slowing down the early elongation phase of the ribosome.
It has been suggested that at the beginning of the coding region, various features slow down the early stages of translation elongation to improve organism fitness, e.g. via optimizing the ribosomal allocation and chaperon recruitment ())[Citation13,Citation14]. This second novel signal is likely a mechanism of such regulation. Both of the reported signals above occur in 89% of the analysed bacteria.
Comparing highly and lowly expressed genes in E. coli ()) reveals that both signals are stronger in the highly expressed genes, which are under stronger selection to optimize translation. The difference between the Z-scores of highly and lowly expressed genes in the two reported signal regions was highly significant (nucleotides −8 through −17 in the 5ʹUTR: Wilcoxon rank-sum test p = 7.9∙10−5; last nucleotide of the 5ʹUTR and the first five nucleotides of the coding sequence: Wilcoxon rank-sum test p = 9.3∙10−4).
Selection against strong rRNA-mRNA interactions in the coding regions that prevent the slowing down of translation elongation
Ribo-seq analyses in E. coli have indicated that strong interactions between the 16S rRNA and the mRNA can lead to pauses during translation elongation and hindering translation [Citation5–7,Citation15] ()). Avoiding such strong rRNA-mRNA interactions in the coding region should allow the ribosome to flow efficiently during translation elongation. The deleterious effects of such strong rRNA-mRNA interaction sequences may also be due to their role in encouraging internal translation initiation, which would create truncated and frame-shifted protein products. Hockenberry et al. [Citation9] found support for this claim by observing that the occurrence of AUG start codons occurrence is significantly depleted downstream of existing strong rRNA-mRNA interaction sequences in E. coli.
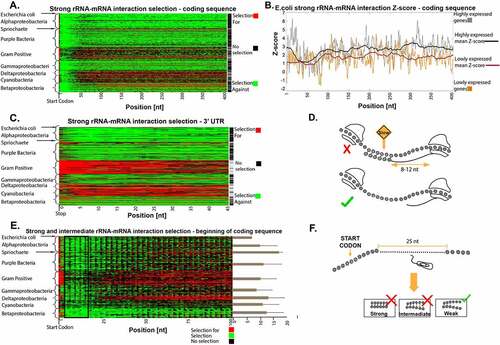
Figure 2. Selection for and against strong rRNA-mRNA interactions in the coding and 3ʹUTR regions. (a) The positions with selection for or against strong rRNA-mRNA interaction in the first 400 nt of coding regions. Each row represents a bacterium, the rows clustered by phyla, and each column is a position in the transcripts of the analysed organisms. Red/green indicates a position with significant selection for/against strong rRNA-mRNA interactions compared to the null model, respectively (Materials and Methods section). Black indicates positions with no significant selection. Rightmost column: black represents bacteria for which the number of positions with significant selection against strong interactions was significantly higher than the null model. (b) Z-score for rRNA-mRNA interaction strength at the first 400 nucleotides of the coding regions in highly and lowly expressed genes in E. coli. Lower/higher Z-scores mean stronger/weaker rRNA-mRNA interactions than the null model, respectively. The bold black/red lines represent a 40-nucleotide moving average in highly/lowly expressed genes, respectively. (c) Positions with selection for or against strong rRNA-mRNA interaction strength in the 3ʹ UTR. Each row represents a bacterium. The rows are clustered by phyla, and each column is a position in the bacteria’s transcript. Red/green indicates a position with significant selection for/against strong rRNA-mRNA interactions relative to the null model, respectively (Materials and Methods section). Black indicates position with no significant selection. Rightmost column: black represents bacteria for which the number of significant positions with selection against strong interactions is significantly higher than in the null model. (d) The effect of strong rRNA-mRNA interactions in the coding region on translation elongation: such interactions can slow down ribosome movement and retard translation. (e) Positions with significant strong and intermediate rRNA-mRNA interaction distribution in the first 100 nt of the coding region. Each row represents a bacterium, the rows are clustered by phyla, and each column is a transcript position. Red/green indicates a position with significant selection for/against strong and intermediate rRNA-mRNA interactions compared to the null model, respectively (Materials and Methods section). Black indicates position with no significant selection. Bars at the right of the plot show: for each bacterium, we calculated in a sliding window of 40 nucleotides the number of positions with selection against strong and intermediate interactions. The bars represent the average number of windows at the beginning of the coding region that had more selection against strong and intermediate interactions than the rest of the transcript, averaged by phylum. Lines extending from bars represent standard deviations (the signal’s periodicity is related to the genetic code). (f) An illustration of our model: strong and intermediate interactions at the first 25 nucleotides can be deleterious and can promote initiation from erroneous positions
It is important to mention that various studies have inferred the typical distance between the position of the aSD-SD interaction and the ribosomal P-site during elongation found it to be around 8–12 nucleotides as in the initiation phase [Citation1,Citation3,Citation4,Citation16–18].
Our analysis reveals evidence of significant selection against strong rRNA-mRNA interactions in the coding region ()). In 55% of the bacteria analysed, at least 50% of the positions in the first 400 nucleotides of the coding region exhibit a signal of significant selection against strong rRNA-mRNA interactions. Importantly, this selection was also observed away from positions upstream of a nearby AUG, suggesting that such selection is also related to elongation and not just to avoiding internal translation initiation (Figure S3). Our findings agree with Yang et al [Citation15]., who showed depletion in internal-SD-like sequences in most species analysed (without a control for the positions that are close to an AUG). However, this study provides this insight at a much higher resolution: Yang et al. examined the occurrence of such sequences over the total genome, whereas we performed a per-position comparison in each genome.
We found evidence for selection against strong rRNA-mRNA interactions in the coding region throughout the bacteria phyla analysed, except for in cyanobacteria and gram-positive bacteria, which seem to exhibit selection for strong rRNA-mRNA interactions ()). It has been hypothesized that interactions between rRNA and mRNA are weaker in cyanobacteria as 16S ribosomal RNA is folded so that subsequences that usually interact with the mRNA are situated within the RNA structure [Citation19] [Citation20]. Thus, in these organisms, it is to be expected that rRNA-mRNA interactions are less probable, resulting in lower selection pressure to eliminate sub-sequences that can interact with the rRNA in the coding region. A similar trend can be seen in the 3ʹUTR of genes ()). From our additional analysis, we postulate that similar to cyanobacteria, gram-positive bacteria also have rRNA structures that result in less efficient rRNA-mRNA interactions (Figure S4). It is possible to assume that, since there are evidences that gram-positive bacteria have photosynthetic ancestry as cyanobacteria [Citation21].
It is known that highly expressed genes tend to be under stronger selection pressure for aspects related to codon usage bias [Citation22–24] since a mutation that improves translation cost is expected to have higher effect on fitness when it occurs in highly expressed gene with abundant mRNA molecules that are translated by many ribosomes. Thus, we expect to see stronger selection against strong rRNA-mRNA interactions (that improve translation elongation rate) in the coding regions of highly expressed genes in comparison to lowly expressed genes. Indeed, this is the pattern that was observed (Wilcoxon rank-sum test p = 1.5∙10-30; )). In addition, as can be seen in ), at the beginning of the coding region (5–25 nucleotides), there is a significantly increased selection against strong and intermediate rRNA–mRNA interactions (typical p-value 0.0097). The presence of sub-sequences that interact in a strong/intermediate manner near the beginning of the coding region is probably more deleterious (relative to weak interactions) as it might promote initiation from erroneous positions with higher probability (see illustration in )); indeed, similar signals related to eukaryotic and prokaryotic initiation were reported [Citation8,Citation25].
Selection for strong rRNA-mRNA interactions at the end of the coding sequences to improve the fidelity of translation termination
For 82% of the analysed bacterial species, there is a selection for strong rRNA-mRNA interactions in 50% of the positions at the last 20 nucleotides of the coding region, ()). It is likely that this constitutes a mechanism for slowing ribosome movement when approaching the stop codon and serves to ensure efficient and accurate termination and prevent translation read-through [Citation26] ()). Researchers have suggested that this selection may have the function of assisting initiation of overlapping or nearby downstream genes in operons [Citation8]; however, we universally observed this phenomenon, across all genes and bacteria, including the last genes in an operon which are not closely followed by other genes (Figure S5).
Figure 3. Selection for/against strong rRNA-mRNA interactions at the end of the coding region. (a) Selection for or against strong rRNA-mRNA interaction in the last 400 nt of the coding regions. Each row represents a bacterium, rows are clustered by phyla, and each column is a position in the bacterial transcript. Red/green indicates positions with significant selection for/against strong rRNA-mRNA interaction compared to the null model, respectively (Materials and Methods section). Black indicates positions with no significant selection. Rightmost column: black pixels represent bacteria where the number of significant positions with selection for strong interactions was significantly higher than the null model. (b) The number of bacteria with significant selection for strong rRNA-mRNA interactions in each of the last 20 nt of the coding region. (c) Distribution of the position with the lowest rRNA-mRNA interaction Z-score, indicating the strongest rRNA-mRNA interaction, in the last 20 nt of the coding region among the analysed bacteria. (d) Mean of the lowest Z-score for rRNA-mRNA interaction strength among the last 20 nucleotides of the coding region for groups of genes classified according to gene expression levels. (e) Ribo-seq analysis: average Ribo-seq read count distribution at the beginning of the 3ʹUTR for genes with strong (grey bars) vs. weak (orange bars) rRNA-mRNA interactions at the end of the coding sequence (Material and Methods section). (f) An illustration of our model: strong interactions at the end of the coding region enhance the accurate recognition of the stop codon and aid in translation termination. (g) The experiment construct, an RFP gene connected to a GFP gene. We tested the effect of different rRNA-mRNA interaction strengths in the last 35 nt of the RFP gene by creating variants with different folding in the last 40 nt. (h) Bar graph of values proportional to GFP/RFP fluorescence levels in the nine variants (see Material and Methods section) grouped according to their local folding energies in the log phase
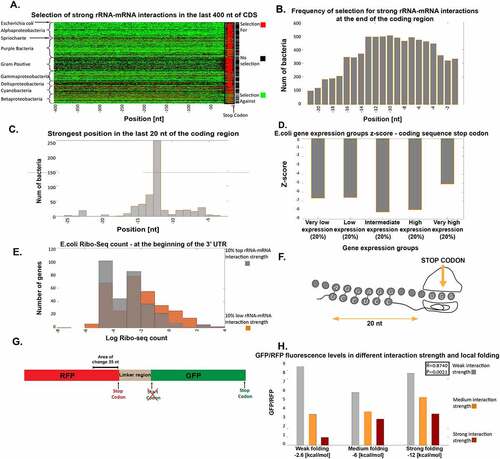
It has previously been found that when the rRNA binds to the mRNA, the ribosome is generally decoding a codon located approximately 11nt downstream of the binding site [Citation5]. To validate this, we inferred the positions with selection for the strongest interactions. We identified those with minimum rRNA-mRNA interaction Z-scores within the last 20nt of the coding region in most analysed bacteria (Material and Methods section). We discovered that the strongest and most significant positions across all bacteria are indeed (−9) through (−12) relative to the STOP codon (,c)). This supports our hypothesis that rRNA-mRNA interactions indeed function to halt the ribosome on the STOP codon and not to initiate the next open reading frame in the operon.
We examined the relationship between the strength of selection for strong interaction in the last 20nt of coding regions with different levels of gene expression and found it to be convex: such selection is stronger for genes with intermediate expression and weaker for both lowly- and highly expressed genes ()). We consider that the weaker selection in lowly-expressed genes may be due to lower selection pressure on the gene in general [Citation27]. Conversely, the weaker signal in highly-expressed genes may be due to stronger selection on translation elongation and termination rates: the ribosome density in these genes is higher [Citation13], and if a ribosome is stalled to promote accurate termination, it may cause ribosome queuing at the 3ʹ-end, resulting in inefficient ribosomal allocation. Highly expressed genes may have other mechanisms for ensuring termination fidelity.
To test if strong rRNA-mRNA interactions prior to the stop codon improve termination fidelity, we analysed Ribo-seq data of E. coli [Citation28] () and Material and Methods section). We expected that if such an interaction improves the fidelity of termination, mRNAs with a strong interaction will exhibit fewer read-through events. Thus we would observe fewer Ribo-seq read counts (RC) downstream of the STOP codon. Indeed, we found that the average read count for the 20 nucleotides after the stop codon was lower following genes with strong rRNA-mRNA interactions in the last 20 nucleotides of the coding region, compared to genes with weaker interactions in this region (mean RC = 0.334 and 0.514, respectively; Wilcoxon rank-sum test p = 0.001).
To experimentally test our hypothesis of strong rRNA-mRNA interactions prior to the stop codon preventing stop-codon read-through, we used a construct mRNA with a gene coding for a red fluorescent protein (RFP) linked to a gene coding for a green fluorescent protein (GFP; )). We positioned the GFP gene downstream such that its expression acts as an indicator of read-through expression, and variants with higher GFP fluorescence are indicative of higher stop-codon read-through rates (Material and Methods section and Figure S6). We designed nine variants with different rRNA-mRNA interaction strengths, local mRNA folding at the last 40nt [Citation29] of the RFP and measured their fluorescence. As hypothesized, we found that variants with stronger rRNA-mRNA interactions at the end of the RFP coding region tend to produce lower GFP levels ()). We found that there is a high correlation between the relative read-through signal (the ratio between the GFP fluorescence and the RFP fluorescence) and the predicted rRNA-mRNA interactions strength prior to the stop codon even when controlling for the local mRNA folding near the stop codon when considering the log-phase of the experiment (partial Spearman correlation: r = 0.8740 P = 0.0021). Additional analysis of the variants and the experiment kinetics can be seen in the Material and Methods section and Figure S6.
Selection for intermediate rRNA-mRNA interactions in the coding region and UTRs to improve the pre-initiation diffusion of the small subunit to the initiation site
The previous sections presented evidence for selection against strong interactions between the rRNA and mRNA in most of the coding region, but this doesn’t mean that all interactions throughout this region are deleterious: other forces may act in differing directions. Prior to binding with mRNA, free ribosomal units travel by diffusion. Some interaction with the mRNA may assist in ‘guide’ the diffusing small subunit of the ribosome to remain near the transcript and ‘help’ them find the start codon, increasing their diffusion efficiency and consequently overall translation initiation efficiency ().1).
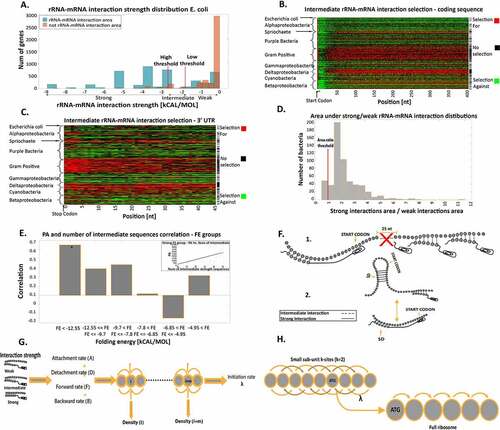
Figure 4. Selection for/against intermediate rRNA-mRNA interactions in the coding and UTR regions. (a) Definition and threshold validation for intermediate-strength rRNA-mRNA interactions in E. coli. Two distributions are shown: 1. blue bars: maximum rRNA-mRNA interaction strength distribution of the interaction strength region related to region 1 (see main text). 2. Orange bars: maximum rRNA-mRNA interaction strength distribution in the weak interaction region (related to region 2) (see main text). Thresholds for defining intermediate interactions for this organism are also depicted. (b) Positions with selection for high/low number of intermediate rRNA-mRNA interactions in the first 400 nt of the coding regions. Rows represent individual bacteria and are clustered by phyla; each column is a transcript position. Red/green indicate positions with significant selection for/against intermediate rRNA-mRNA interaction relative to the null model, respectively (Material and Methods section). Black indicates positions with no significant selection. Rightmost column: black pixels represent bacteria where the number of positions with significant selection for intermediate interactions is significantly higher than the null model. (c) Positions with selection for high/low number of intermediate rRNA-mRNA interactions in the 3ʹ UTR. Rows represent bacteria clustered by phyla; each column is a transcript position. Red/green indicates positions with significant selection for/against intermediate rRNA-mRNA interactions relative to the null model, respectively (Materials and Methods section). Rightmost column: black pixels represent bacteria where the number of positions with significant selection for intermediate interaction is significantly higher than the null model. (d) Distribution of the area ratio. A ratio larger than 1 suggests that it is more probable that the inferred thresholds are related to (intermediate) rRNA-mRNA interactions and not to a lack of interaction. (e) The number of intermediate sequences and PA correlations in GFP synonymous variants. The GFP variants are divided into six groups according to their FE near the start codon. The FE thresholds were selected to have approximately equal numbers of GFP variants in each group. Groups with significant correlation are marked with *. Inset: correlation between PA and the number of intermediate interaction sequences for the strongest FE group. (f) Illustration of intermediate interaction effects on translation initiation. 1) Intermediate interactions in the coding sequence. 2) This aids initiation when strong mRNA folding in the region surrounding the START codon (i.e. when initiation is more rate-limiting). (g) An illustration of the biophysical model. its rRNA-mRNA interaction strength determines each site’s parameters. There is an attachment rate to the site, detachment rate from the site, movement forward to the site and from it, and movement backward from the site and to it. This model allows for the deduction of the initiation rate for insertion into the elongation model. (h) An illustration of the rRNA-mRNA interaction strength extended model. k sites determine the density of each site before it and k sites after it. (Materials and Methods and Figure S7)
Initiation is often the rate-limiting stage of translation, and initation’s most limiting aspect appears to be the 3-dimensional diffusion of the small sub-unit to the SD region. One-dimensional diffusion (i.e. along the mRNA) may be faster. If mRNAs can ‘catch’ small ribosomal subunits and then direct them to their start codons, they may be favoured by evolution. The large amount of redundancy in the genetic code allows for mutations that may improve interactions between the rRNA and mRNA even in the coding region, without negatively affecting protein products; however, as we have seen, strong interactions in the coding region are problematic. Based on these considerations, we hypothesized that evolution shapes coding regions to include intermediate rRNA-mRNA interactions, which are not strong enough to halt elongation but can optimize pre-initiation diffusion.
To test this hypothesis, we created an unsupervised optimization model to identify sequences with intermediate rRNA-mRNA interaction by adaptively calculating rRNA-mRNA interaction-strength thresholds for each bacterium. The algorithm selects rRNA-mRNA interaction strength thresholds to delineate the maximum number of significant positions with rRNA-mRNA interactions between these thresholds (see more details in the Material and Methods section).
To verify that the thresholds are reasonable, we looked at the highest (per gene) rRNA-mRNA interaction strength distribution in the 5ʹUTR in two regions: 1) The canonical rRNA-mRNA interaction region during initiation (i.e. nucleotides −8 through −17 upstream to the start codon). 2) The region in the 5ʹUTR, which is upstream to 1). We then defined each gene by two values: a. Minimum interaction strength (i.e. strongest interaction) from region 1) distribution. b. Minimum interaction strength from region 2) distribution. For each bacterium, we created distribution plots based on values a. and b. over its genes. ) includes these two distributions for E. coli; as can be seen, the rRNA-mRNA intermediate interaction strength thresholds for this bacterium are in the two distributions’ overlapping regions. Furthermore, we calculated the area between the optimized intermediate thresholds under the distribution of all values of rRNA-mRNA interaction strength in the aforementioned regions (1) and (2) ()). As expected, the area under distribution 1) is greater than the area under distribution 2) in most bacteria (the ratio is larger than 1 in 91% of the bacteria). This confirms that the range of interaction strengths identified corresponds to intermediate interactions and not to a lack of interaction. It is important to mention that intermediate interactions at the beginning of the 5ʹUTR can result in translation initiation from the wrong location and can create damaged protein.
Our analyses revealed that in 52% of the analysed bacteria, at least 50% of the positions are under significant selection for intermediate rRNA-mRNA interactions. According to the null model, this would be expected to be the case for only 0.18% ()). A similar trend can be seen in the 3ʹUTR ()). The level of selection for intermediate interactions in the coding region varies among the bacterial phylum. Thus, various phylum-specific characteristics may be affected as growth rate, competition, and many aspects of translation regulation (Material and Methods).
Similar results to the ones reported here were obtained when we used different approaches to define intermediate interactions; for example, we show that there is selection for lower standard deviation of rRNA-mRNA interactions in bacterial genomes (see more details in Figure S7.A and Figure S7.B).
Our null model preserves the protein itself, the codon bias, and the GC content. Therefore, the observed selection cannot be favouring specific codons or amino acids. In addition, our rRNA-mRNA interaction profiles consider all three reading frames; hence, the amino acids are not the key factor that influences this signal. Furthermore, the fact that we see a similar selection pattern in the UTRs ()) suggests that this pattern cannot be attributed only to selection for certain codon pairs.
We hypothesize that selection for intermediate rRNA-mRNA interactions in the coding region of a gene should improve its translation initiation efficiency and thus its protein levels. To demonstrate this, we calculated the partial Spearman correlations between the number of intermediate interaction sequences in the GFP variant and the heterologous protein abundance (PA), based on 146 synonymous GFP variants that were expressed from the same promoter [Citation30]. The control variables were the codon adaptation index (CAI) [Citation31]; a measure of codon usage bias, and mRNA folding energy (FE) near the start codon, known to affect translation initiation efficiency (the weaker the folding in the vicinity of the start codon the higher the fidelity and efficiency of translation initiation) [Citation32]. We defined an area of intermediate interactions according to the thresholds determined by our model in E. coli and calculated the correlation explained above. As expected, the correlation was positive and significant (r = 0.35; P = 0.2∙10−4), indicating that variants with more sub-sequences in the coding region that bind to the rRNA with an intermediate interaction strength tend to have higher PA. We found that this correlation is very high (r = 0.61; p = 0.003) specifically when the FE near the start codon is the strongest ()). The intermediate sequences are expected to have a stronger effect on initiation when this process is less efficient (i.e. when it is more rate-limiting). Thus, according to our model, we expect to see a stronger correlation between protein levels and the number of intermediate sequences when the mRNA folding in the region surrounding the START codon is strong ().2). When calculating the partial Spearman correlation between the number of sub-sequences that interact in a weak manner with the rRNA and the PA of the GFP variants, the correlation is negative and significant (r = −0.32; p = 8.5∙10−5). This further validates our conjecture that translation efficiency, in this case, is indeed related to interactions that are neither very strong nor very weak or absent. It also suggests that this effect on translation efficiency is related to the pre-initiation step and not the elongation step. Otherwise, we would expect a positive correlation with weak interaction (Figure S8).
We also analysed E. coli genes by their mRNA half-life [Citation33] to assess how selection for intermediate interactions varies among them. We found that genes with shorter half-life tend to have more intermediate interactions (Wilcoxon test P =) (Material and Methods). It is possible that these genes undergo stronger selection to include intermediate interactions since their corresponding mRNAs ‘have less time’ to initiate translation. Thus, the reported results discussed here suggest that the small ribosomal subunit diffusion is probably relatively fast.
It is known that mRNAs tend to localize in certain regions in the cell [Citation34], meaning that if we can keep the ribosome close to a certain mRNA, we also keep it close to other mRNAs. If a certain mRNA ‘captures’ a ribosome, then undergoes degradation, this ribosome will likely remain close to other nearby mRNAs. It is also possible that due to compartmentalization and aggregation of many mRNA molecules, the interaction with the small sub-unit of one mRNA can be ‘helpful’ for a nearby mRNA.
Finally, we created a computational biophysical model that describes the small ribosomal sub-unit movement along the transcript. In this model, the movement is influenced by the intermediate interactions (,h)). The model indicates that adding intermediate interaction along the transcript improves the initiation rate and termination rate even if the intermediate sequence is near the 3ʹ end of the gene. It also demonstrates the advantage of intermediate interactions over weak or strong ones in most of the transcript as intermediate interactions in the transcript optimize the translation rate. We conclude that intermediate rRNA-mRNA interactions along the transcript enhance small ribosomal sub-unit diffusion to the start codon with resultant improvements in the translation rate (Material and Methods and Figure S9).
Discussion
This study revolutionizes current understandings of how mRNA-rRNA interactions affect translation efficacy and efficiency throughout all stages of translation in many prokaryotes. We provide multiple sources of evidence that in many bacterial phyla the 16S rRNA plays a role in regulating all stages of translation via its interaction with the mRNA. Such interactions are usually directly correlated with organism growth rates (File S1). Evidence for the effect of these interactions on translation does not appear in organisms without an aSD sequence in the rRNA [Citation35] (Figure S10).
Previous work has identified pieces of this puzzle, such as the importance of the aSD-SD interactions for translation initiation [Citation1] [Citation2], and some initial evidence that these interactions may be deleterious in the coding regions [Citation15] [Citation36]. This study is novel in expanding our understanding of the effect of such interactions throughout the translation process – from pre-initiation small sub-unit diffusion through initiation, elongation, and termination. It presents new evidence of selection for intermediate interactions in the transcript and for strong aSD-SD interactions upstream the stop codons and downstream the start codon with numerous details about the distributions of the reported patterns in transcripts. This study also provides novel insights into how evolutionary forces reflect trade-offs and non-linear relationships between different interaction strengths in different parts of the mRNA transcript and the bacteria fitness and how these vary across levels of gene expression and phyla. In addition, we show how the reported patterns are correlated and/or affected by other features of the transcripts, such as the strength of the mRNA folding near the start codon, the mRNA stability, the aSD patterns in the rRNA, etc. The results are supported by various scientific approaches, including selection detection, molecular biology experiments, and biophysical modelling.
Our findings also shed light on the biophysics of translation in bacteria, the conformation of the small ribosomal subunit rRNA and its interaction with mRNA molecules during the various steps of the translation process. The interactions described herein can also be implemented in engineered transcripts for efficient expression in various bacterial species. Rigorous molecular evolution models should consider our findings that even within coding regions, the selection of nucleotides and codons that comprise mRNAs are shaped by rRNA-mRNA interactions and how these affect translation efficiency.
Our results demonstrate various complex trade-offs and non-monotonous relations between the optimal rRNA-mRNA interaction strength across transcripts. For example, increasing the rRNA-mRNA interaction strength inside coding regions decreases elongation efficiency and increases the initiation efficiency. Thus, evolution in these regions tends to shape coding regions such that they include intermediate (not too strong, not too weak) levels of rRNA-mRNA interactions. Whereas at the 3ʹ end of the coding region, strong rRNA-mRNA interactions tend to improve termination fidelity, although they decrease translation rates and may increase ribosomal traffic jams. Thus, evolution at the 3ʹ end tends to shape the end of coding regions such that they include more rRNA-mRNA interactions when they do not decrease translation efficiency (i.e. in genes that are less translationally efficient). Moreover, the secondary structure can compete with the efficiency of the rRNA-mRNA interaction [Citation37] and modelling this phenomena is relatively challenging computationally and statistically. Thus, as a future research it will be interesting to study a combined model, which includes both aspects, and examine these non-monotonous relations in high resolution both from the molecular evolution, engineering, and biophysical points of view.
Materials and methods
The analysed data
In this subsection of the methods the analysed data is described.
The analyzed organisms
We analysed 551 bacteria genome from the following phyla or classes: Alphaproteobacteria, Betaproteobacteria, Cyanobacteria, Deltaproteobacteria, Gammaproteobacteria, Gram-positive bacteria, Purple bacteria, Spirochaetes bacteria. In addition, we analysed 76 bacteria genome across the tree of life that does not have a canonical aSD sequence in their 16S rRNA. Finally, we analysed 196 bacteria genome with known growth rates. The full lists of analysed organisms can be found in the supplementary Organisms table file. All of the bacterial genomes were downloaded from the NCBI database (https://www.ncbi.nlm.nih.gov/) in October 2017. In addition to the coding regions, for each gene, we also analysed the 50nt upstream of the start codon and the 50nt downstream of the stop codon (approximating the end of the 5ʹUTR and the beginning of the 3ʹUTR, respectively).
Protein levels
E. coli endogenous protein abundance data was downloaded from PaxDB (http://pax-db.org/download), we used ‘E. coli – whole organism, EmPAI’ published in 2012.
rRNA-mRNA strength model
In this subsection of the methods, the prediction and definition of rRNA-mRNA interactions are described.
The rRNA-mRNA strength prediction
The prediction of rRNA-mRNA interaction strength is based on the hybridization free energy between two sub-sequences: The first sequence is a sequence from the mRNA and the second sequence is the aSD from the rRNA. This energy was computed based on the Vienna package RNAcoFold [Citation38], which computes a common secondary structure of two RNA molecules. Lower, more negative free energy is related to stronger hybridization.
We assumed that the interacting sub-sequence at the 16S rRNA 3ʹ end is UCCUCC (3ʹ to 5ʹ). However, when we remove this assumption (change the aSD sequence according to our optimization algorithm Supplementary Figure S9) and infer it in an unsupervised manner, the results remain similar. It is crucial to mention that the calculation and prediction of the rRNA-mRNA remains the same except the aSD sequence. Thus, we indeed used the canonical aSD sequence.
The rRNA-mRNA interaction strength profiles and selection strength
The rRNA-mRNA interaction strength profiles include the predicted rRNA-mRNA interaction strength for each position in each transcript (UTRs and coding regions) and each bacterium. We analysed the average profile of each bacterium.
We calculated the interaction strength between all 6 nucleotide sequences along each transcript (UTR’s and coding sequences) with the 16S rRNA aSD. We performed a statistical test (empirical P-value) to decide if the potential rRNA-mRNA interaction in this position is significantly strong, intermediate, or weak for each possible genomic position along the transcripts. To determine whether a position (across the entire transcriptome) tends to include sub-sequences with a certain rRNA-mRNA interaction strength (strong, intermediate, or weak), we compared it to the properties of sub-sequences observed in a null model in the same position (see further details regarding the null model below). We also created Z-score maps of the strength of interactions (Figure S11).
Intermediate rRNA-mRNA interactions definition and analysis
In this subsection of the methods, definition and additional analysis regarding Intermediate rRNA-mRNA interactions are described.
The intermediate rRNA-mRNA interaction definition
To define intermediate interaction strength, we devised an unsupervised adaptive optimization model that infers the thresholds (upper and lower) of intermediate interaction strength. We assumed that coding regions tended to include intermediate interactions and chose the thresholds that maximize their number in comparison to the null model. Specifically, we implemented an algorithm that in each iteration changes the selected upper and lower thresholds mentioned above such that the number of significant positions in terms of the number of intermediate interactions in the real genome compared to the null model will be maximal.
The first iteration thresholds were selected as follows; we created a distribution histogram of interaction strength in the region with the strong canonical SD interaction in the 5ʹUTR of each bacterium (positions −8 through −17, )). We calculated the area under the strong interaction distribution. We initially chose the ‘high’ (strongest interaction strength – more negative free energy) and ‘low’ (weakest interaction strength – less negative free energy) thresholds to be the interaction strength such that the area up to the chosen threshold interaction value was 5% of the total distribution area from each side of the curve.
To study the properties of the selected thresholds, we created the interaction strength histograms for two regions in the 5ʹUTR ()): 1) The distribution of strong interaction strength, as mentioned above. 2) The distribution of interaction strength in positions −40 to −50 at the 5ʹUTR upstream of the START codon (where we do not expect to see strong rRNA-mRNA interaction, as this region doesn’t have a known role in translation initiation).
Next, we looked at the two inferred thresholds’ positions compared to these two histograms; as can be seen in ), they tend to appear in the region between the two histograms supporting the hypothesis that these are indeed intermediate interaction strength.
To further quantitatively validate the inferred thresholds, we calculated the area under the two histograms mentioned above induced by the two inferred thresholds. The ratio between these two areas (the first one divided by the second one) was computed: A ratio larger than one suggests that it is more probable that the inferred thresholds are related to (intermediate) interactions between the rRNA and mRNA than to lack of interactions; indeed, in most bacteria (503/551) the ratio was larger than one ()).
Intermediate signal
When looking at the intermediate selection signal, we can see that the signal can be observed in 52% of the analysed bacteria; The groups of bacteria that exhibit that signal are 47% of the Betaproteobacteria, 49% of the Cyanobacteria, 94% of the Deltaproteobacteria, 43% of the Gammaproteobacteria, 83% of the Gram-positive bacteria, 28% of the Purple bacteria, 100% of the Spirochaete bacteria, 26% of the Alphaproteobacteria and E.coli.
The relation between the number of intermediate rRNA-mRNA interactions in coding regions and heterologous protein levels
We aimed to show that intermediate sequences in a gene’s coding region directly improve its translation initiation efficiency and protein levels. Hence, we calculated the partial Spearman correlations between the number of intermediate interaction sequences in the GFP variant and the heterologous protein levels (PA), based on 146 synonymous GFP variants expressed from the same promoter and the same UTR [Citation30].
The control variables were the CAI (Codon Adaptation Index – a measure of codon bias) and folding energy (FE) near the start codon. We defined an area of intermediate interactions according to the thresholds received by our model in E. coli, and we expanded it by 20% to allow maximum intermediate interactions in this synthetic system (which is expected to differ from endogenous genes). The correlation was positive and significant (r = 0.35; P = 2∙10−5), suggesting that variants with more sub-sequences in the coding region that bind to the rRNA with an intermediate interaction strength tend to have higher PA.
mRNA half-life and intermediate interactions
To enhance our knowledge of the effect of intermediate interactions, we analysed mRNA half-life data [Citation33]. We divided E. coli genes according to their mRNA half-life. For the top and bottom 20%, we calculated the percentage of genes that have intermediate interaction in each position in the coding region.
Statistical analysis
In this subsection of the methods, all of the statistical analysis that was used is described.
The null model
For each bacterial genome, we designed 100 null model mRNA randomizations. UTR regions were generated with nucleotide permutation, preserving the nucleotide distribution, including the GC content of the original mRNA. Coding regions were generated by permuting synonymous codons while preserving codon frequencies, amino acid order and content, and GC content of the original mRNA.
Similar rRNA-mRNA interaction strength profiles as the ones described above were computed for the transcripts’ randomized versions to compute p-values related to possible selection for strong/intermediate/weak rRNA-mRNA interactions.
We computed an empirical p-value for every position in the transcriptome of a certain organism. To this end, the average rRNA-mRNA interaction strength in the position was compared to the average obtained in all of the randomized genomes. The p-value was computed based on the number of times the real genome average was higher or lower (depend on the hypothesis we checked) than the null model average. A significant position is a position with a p-value smaller than 0.05.
We also validated the robustness of our results to the number of randomization. For more details on the null models’ validity, see Figure S2 and Figure S12.
Z-score calculation in highly and lowly expressed genes
To validate the reported signals, we performed all of our analyses on highly and lowly expressed genes of E. coli. We chose the highly and lowly expressed genes according to their PA (20% highest and lowest PA values) and computed Z-scores as explained in the following sub-sections.
Highly vs. lowly: selection for strong rRNA-mRNA interactions at the 5’UTR end and at the beginning of the coding region
We calculated the Z score based on the rRNA-mRNA interaction strength in all possible positions in the 5ʹUTR and coding region in the highly and lowly expressed genes.
– Z-score in position i.
– rRNA-mRNA interaction strength in position i.
– Average rRNA-mRNA interaction strength in position i in all of the randomizations.
– Standard deviation of rRNA-mRNA interaction strength in position j in all of the randomizations.
From a statistical point of view, we defined each gene by two values according to the reported signal: 1) Minimum Z-score value in positions −8 through −17 in the 5ʹUTR. 2) Minimum Z-score value in positions 1 through 5 at the beginning of the coding region. The regions were selected according to the reported signal in ).
We performed two Wilcoxon rank-sum tests to estimate the p-values for the two reported signals in highly vs. lowly expressed genes.
Highly vs. lowly: selection against strong rRNA-mRNA interactions at the beginning of the coding sequence
We calculated the Z-score (as described above) based on the rRNA-mRNA interaction strength of each position in the first 400nt of the coding region in the highly and lowly expressed genes.
We performed Wilcoxon rank-sum tests to estimate the p-values of the reported signals.
Highly vs. lowly: Z-score calculation of selection for strong mRNA-rRNA interactions at the end of the coding sequence
In this case, we calculated the Z-score (as described above) based on the rRNA-mRNA interaction strength of each position in the last 20nt of the coding region in each bacterium.
For each bacterium, we found the position with a minimum Z-score value (strongest interaction compared to the null model). We created a histogram of the positions of the strongest Z-scores in the last 20nt of the coding region ()) and a histogram based on gene expression levels ()).
Experimental data
In this subsection of the methods, all details regarding the read-through experiment are described.
Selection against strong interaction at the end of the coding region – read-through experiment
Plasmids construction
We used plasmid pRX80 and modified it by deleting the lac I repressor gene and the CAT selectable marker. The resulting plasmid contained the RFP and GFP genes in tandem, and both are expressed from a promoter with two consecutive lac operator domains. The plasmid also contains the pBR322 origin of replication and the Kanamycin resistance gene as a selectable marker. Because the two operator sequences caused instability at the promoter region, we replaced the promoter region with a lacUV promoter with only one operator sequence. The resulting plasmid, pRCK28, was now used to generate of variants that differ in the 40 last nucleotides of the RFP ORF. The variants include synonymous changes composed of both ribosome binding sites at three energy ranges and alter the local folding energy (LFE) of the 40 last nucleotides of the RFP ORF end. The variable sequences were synthesized as G-blocks, and Gibson assembly was used to replace the relevant region of the pRCK28 plasmid, generating nine variants as described in Figure S6 (A, C). The resulting variable plasmids were transformed into competent E. coli DH5 cells. Colonies were selected on LB Kanamycin plates. A few candidates were analysed by PCR and sequenced to verify the synonymous changes in each variant.
Fluorescent tests
Single colonies of each variant and the original pRCK28 clone and negative control (an E. coli clone with a Kanamycin resistant plasmid at the same size of pRC28 but without any fluorescent genes) were grown overnight in LB-Kanamycin at 37°C. Cells were then diluted, and 10,000 cells were inoculated into 110ul defined rich medium (1X M9 salts, 1 mM thiamine hydrochloride, 2% glucose, 0.2% casamino acids, 2 mM MgSO4, 0.1 mM CaCl2) in 96 well plates, at 37°C. For each variant, two biological repeats and four technical repeats of each were used. A fluorimeter (Spark-Tecan) was used to run growth and fluorescence kinetics. For growth, OD at 600 nm data was collected. For red fluorescence, excitation at 555 nm and emission at 584 nm was used. For green fluorescence, excitation at 485 nm and emission at 535 nm was used. Data were analysed and normalized to growth intensity ratios.
Western blot analyses
Cells from the cultures used for fluorescence assay were diluted 1:100 in the same rich defined medium and grown to mid-late log phase (0.7), 1 ml cultures were concentrated by centrifugation lysed using the BioGold lysis buffer supplemented with lysozyme.Total protein lysates were resolved on Tris-glycine 4–15% acrylamide mini protein TGX stain-free gels (BioRad). Proteins were transferred to nitrocellulose membranes using the trans-blot Turbo apparatus and transfer pack. Membranes were incubated in blocking buffer (TBS+1% casein) for 1 hr at room temperature. Anti GFP and/or anti RFP antibodies (Biolegend) were used at 1:5 K, for 1 hr in blocking buffer, at room temperature to probe the GFP and RFP expression. Goat anti-mouse 2nd antibody was then applied at 1:10 K dilution. ECL was used to probe a binding signal, and ImageJ software was used to determine band intensity.
Additional analysis and models
In this subsection of the methods, additional analysis and models to further infer and investigate rRNA-mRNA interactions are described.
Ribosome profiling
E. coli ribosome footprint reads were obtained from [Citation28] (SRR2340141,3–4). E. coli transcript sequences were obtained from NCBI (NC_000913.3). Sequenced reads were mapped as described in [Citation39] with the following minor modifications. We trimmed 3ʹ adaptors from the reads using Cutadapt [Citation40] (version 1.17), and utilized Bowtie [Citation41] (version 1.2.1) to map them to the E. coli transcriptome. In the first phase, we discarded reads that mapped to rRNA and tRNA sequences with Bowtie parameters ‘–n 2 – seedlen 21 – k 1 – norc’. In the second phase, we mapped the remaining reads to the transcriptome with Bowtie parameters ‘–v 2 – a – strata – best – norc – m 200ʹ. We filtered out reads longer than 30nt and shorter than 23nt. Unique alignments were first assigned to the ribosome occupancy profiles. For multiple alignments, the best alignments in terms of number of mismatches were kept. Then, multiple aligned reads were distributed between locations according to the distribution of unique ribosomal reads in the respective surrounding regions. To this end, a 100nt window was used to compute the read count density (total read counts in the window divided by length, based on unique reads) in the vicinity of the M multiple aligned positions in the transcriptome, and the fraction of a read assigned to each position was
. The location of the A-site was set for each read length by the peak of read distribution upstream of the stop codon for that length.
After creating the ribosome profiling distributions, for each gene, we calculated the number of positions with strong rRNA-mRNA interactions in the last 20 nucleotides of the coding region (the location of the reported signal, )). We ranked the genes according to their ‘number of strong positions’, and defined the 10% highest/lowest ranking genes. For the highest and lowest ranking genes, we calculated the average Ribo-seq read count in the first 20 nucleotides of the 3ʹ UTR (the closest region to the stop codon), ).
Selection against strong interaction in the coding region in positions that are not upstream to a close AUG codon
We performed the following analysis to detect a signal of selection for/against strong interactions in the coding region after excluding positions upstream to a close start codon. We considered the E. coli genomes (both real and randomized versions), and in each gene, we ‘marked’ a position that is up to 14 positions upstream of an AUG (in all frames). We then computed the p-value related to selection for strong rRNA-mRNA interactions (as mentioned before) but when we consider only the non-marked positions (both in the real and the randomized genomes). The result can be seen in Figure S3.
Unified biophysical translation model of the reported signals
We developed a computational simulative model of translation that includes the pre-initiation, initiation, and elongation phases. Our model is based on a mean-field approximation of the TASEP model [Citation17]. All of the model parameters are based on rRNA-mRNA interaction strength.
The model consists of two types of ‘particles’: 1. Small subunits of the ribosome (pre-initiation): in this case, the particles’ detachment/attachment and bi-direction movement are possible along the entire transcript. 2. Ribosomes (elongation): the movement is unidirectional (from the 5ʹ to the 3ʹ of the mRNA) and possible only in the coding region; the initiation rate is affected by the density of the small subunits of the ribosome at the ribosomal binding site (RBS).
The model equations
Small sub-unit basic model
In this model, several parameters describe the small sub-unit movement in each site of the transcript. The small sub-unit can attach to the mRNA’s relevant site at a certain rate (depends on the rRNA-mRNA interaction value at that site). The small sub-unit can detach from a site at a certain rate (depends on the complementary interaction to the rRNA-mRNA interaction).
The small sub-unit movement to the next site depends on the detachment rate from the current site and next site’s attachment rate.
– Flow from cell i to cell i + 1.
The movement backward of the small sub-unit to the previous site depends on the detachment rate from the current site and the attachment rate of the previous site.
– Flow from cell i + 1 to cell i.
The start and end terms of the equations depend on the first/last site’s attachment or detachment.
‘initiation’ of the small sub-unit into the first site:
‘termination’ of the small sub-unit from the last site:
This is an example of the simple model equations that are based on the RFM. The density of ribosomes in site i depend on the flow to the site (from the site before and the next site), depends on the flow from site i (to the previous site and the next site), and the detachment and attachment rates of site i.
For example, i = 2:
Small sub-unit k-sites model
To fully grasp the intermediate interaction effect, we extended the small sub-unit model so that the i’th site is affected by k sites before it and k sites after it.
The density of site i is dependent on the flow to the i’th site from i-k:i-1 and the flow from the i’th site to i + 1:i + k sites.
If k is larger than the number of sites before/after the I’th site, k = maximal possible k.
Attachment, Detachment equations are the same as in the basic model.
The movement between sites of the small sub-unit depends on the detachment rate from the i’th site and the attachment rate of the k’th site.
Flow from cell i to cell k:
– Flow forward to the first site (initiation)
– Flow backward from the first site (initiation)
The model equations for an mRNA in the length of n sites:
Initiation:
Elongation (k < i < n-k):
In this case, we have k sites before the i’th site and k sites after the i’th site.
Therefore, we sum all contribution of all k sites (in both sides of site i) to calculate the density of site i.
Elongation (i ≤ k):
In this case, we have less than k sites before the i’th site and k sites after the i’th site.
Therefore, we sum k sites contributions after the i’th site all k’ sites before the i’th site (k’<k, the maximum number of possible sites before the i’th site) to calculate the density of site i.
Elongation (i ≥ n-k):
In this case, we have k sites before the i’th site and less than k sites after the i’th site.
Therefore, we sum all k sites contributions before the i’th site all k’ sites after the i’th site (k’<k, the maximum number of possible sites after the i’th site) to calculate the density of site i.
Termination:
The model of ribosomal movement during elongation
To initiate the ribosome movement, we calculated the initiation rate considering the density from the small sub-unit model in the SD location in the 5ʹ UTR.
The ribosome movement depends on the rRNA-mRNA interaction of the relevant site and the effect of other features such as adaptation to the tRNA pool (denoted as typical decoding rate, TDR) on the elongation at the site codon.
Parameters and model validation
To demonstrate our model, we created an artificial gene with 100 codons that all of its sites are weak sites (rRNA-mRNA interaction = 0). We generated five additional variants from this basic variant via introducing in nucleotide 33 a gradient of different rRNA-mRNA interaction strength.
We simulated our complete model (the pre-initiation stage with k = 20 and the elongation model) for all the variants (Figure S9.A).
To show that adding many intermediate interactions along the transcript (as we see in endogenous genes) improve the translation rate, we performed the following simulation: we started with a variant with one intermediate interaction close to the beginning of the coding sequence (3 nt after the start codon); we gradually added intermediate downstream of the start codon to improve the translation rate. Specifically, to make sure that even for long genes, the intermediate effect exists, we simulated a longer sequence with 500 nucleotides, and each added intermediate sequence was downstream of the previous one in a position that improves the translation (Figure S9 (B-D)).
SD sequence optimization model
The common assumption is that the SD and aSD sequences are usually the canonical ones. However, we believe that there may be organisms with different rRNA-mRNA interaction motifs. Thus, we developed an optimization model that finds the optimized SD and aSD sequences for a given bacterium in an unsupervised manner.
To find the optimal SD, we devised the following algorithm (Figure S9.E):
For a certain organism, we considered all the 6nt long sub-sequences at the last 20nt of the 3ʹ end of the 16S rRNA as a potential alternative ‘aSD’.
For each such potential alternative ‘aSD’, and for each gene in the organism, we considered all the sub-sequences in position −8 through −17 in the 5ʹUTR to find the sub-sequence with the strongest rRNA-mRNA interaction, with the potential to be an alternative ‘aSD’. These values were averaged across the genes, and the potential alternative ‘aSD’ that yields the lowest average (related to strongest predicted averaged rRNA-mRNA interaction strength) is predicted to be an alternative ‘aSD’ sequence.
We executed our optimization model on 551 bacteria (Figure S9.F).
Supplemental Material
Download Zip (11.7 MB)Acknowledgments
We thank Hadas Zur for helpful comments.
Disclosure statement
The author(s) declare no conflict of interest.
Supplementary material
Supplemental data for this article can be accessed here
Additional information
Funding
Related Research Data
References
- Shine J, Dalgarno L. Determinant of cistron specificity in bacterial ribosomes. Nature. 1975;254(5495):34–38.
- Kozak M. Initiation of translation in prokaryotes and eukaryotes. Gene. 1999;234(2):187–208.
- Nakagawa S, Niimura Y, Miura KL, et al. Dynamic evolution of translation initiation mechanisms in prokaryotes. Proc Natl Acad Sci. 2010;107(14):6382–6387.
- Shine J, Dalgarno L. The 3’-Terminal sequence of escherichia coli 16S Ribosomal RNA: complementarity to nonsense triplets and ribosome binding sites. Proc Natl Acad Sci. 1974;71(4):1342–1346.
- Li GW, Oh E, Weissman JS. The anti-Shine–Dalgarno sequence drives translational pausing and codon choice in bacteria. Nature. 2012;484(7395):538–541.
- Liu X, Jiang H, Gu Z, et al. High-resolution view of bacteriophage lambda gene expression by ribosome profiling. Proc Natl Acad Sci. 2013 Jul;110(29):11928–11933.
- Schrader JM, Zhou B, Li G-W, et al. The coding and noncoding architecture of the caulobacter crescentus genome. PLoS Genetics. 2014 Jul;10(7):e1004463.
- Diwan GD, Agashe D. The frequency of Internal Shine–Dalgarno-like motifs in prokaryotes. Genome Biol Evol. 2016;8(6):1722–1733.
- Hockenberry AJ, Jewett MC, Amaral LAN, et al. Within-Gene Shine–Dalgarno sequences are not selected for function. Mol Biol Evol. 2018;35(10):2487–2498.
- Buttgereit F, Brand MD. A hierarchy of ATP-consuming processes in mammalian cells. Biochem J. 1995;312(1):163–167.
- Lane N, Martin W. The energetics of genome complexity. Nature. 2010;467(7318):929–934.
- Tuller T, Carmi A, Vestsigian K, et al. An evolutionarily conserved mechanism for controlling the efficiency of protein translation. Cell. 2010;141(2):344–354.
- Tuller T, Zur H. Multiple roles of the coding sequence 5′ end in gene expression regulation. Nucleic Acids Research. 2015;43(1):13–28.
- Fredrick K, Ibba M. How the sequence of a gene can tune its translation. Cell. 2010;141(2):227–229.
- Yang C, Hockenberry AJ, Jewett MC. Depletion of shine-dalgarno sequences within bacterial coding regions is expression dependent. G3 Genes|Genomes|Genetics. 2016;6(November):3467–3474.
- Salis HM, Mirsky EA, Voigt CA. Automated design of synthetic ribosome binding sites to control protein expression. Nat Biotechnol. 2009;27(10):946–950.
- Márquez V, Wilson DN, Tate WP, et al. Maintaining the ribosomal reading frame: the influence of the E site during translational regulation of release factor 2. Cell. 2004;118(1):45–55.
- Korostelev A, Trakhanov S, Asahara H, et al. Interactions and dynamics of the Shine Dalgarno helix in the 70S ribosome. Proc Natl Acad Sci U S A. 2007;104(43):16840–16843.
- Weiner I, Shahar N, Marco P, et al. Solving the riddle of the evolution of shine-dalgarno based translation in chloroplasts. Mol Biol Evol. 2019;36(12):2854–2860.
- Scharff LB, Childs L, Walther D, et al. Local absence of secondary structure permits translation of mrnas that lack ribosome-binding sites. PLoS Genetics. 2011;7(6):e1002155.
- Woese CR, Debrunner-Vossbrinck BA, Oyaizu H, et al. Gram-positive bacteria: possible photosynthetic ancestry. Science. 1985;229(4715):762–765.
- Bergman S, Tuller T. Widespread non-modular overlapping codes in the coding regions. Phys Biol. 2020;17(3):031002.
- Zur H, Tuller T. Exploiting hidden information interleaved in the redundancy of the genetic code without prior knowledge. Bioinformatics. 2015;31(8):1161–1168.
- Bahiri-Elitzur S, Tuller T. Computational discovery and modeling of novel gene expression rules encoded in the mRNA. Biochem Soc Trans. 2020;48(4):1519–1528.
- Zur H, Tuller T. New universal rules of eukaryotic translation initiation fidelity. PLoS Comput Biol. 2013;9(7):e1003136.
- Bonetti B, Fu L, Moon J, et al. The efficiency of translation termination is determined by a synergistic interplay between upstream and downstream sequences in Saccharomyces cerevisiae. J Mol Biol. 1995 Aug;251(3):334–345.
- Dos Reis M, Wernisch L. Estimating translational selection in eukaryotic genomes. Mol Biol Evol. 2009;26(2):451–461.
- Mohammad F, Woolstenhulme CJ, Green R, et al. Clarifying the translational pausing landscape in bacteria by ribosome profiling. Cell Rep. 2016;14(4):686–694.
- Peeri M, Tuller T. High-resolution modeling of the selection on local mRNA folding strength in coding sequences across the tree of life. Genome Biol. 2020;21(1). DOI:10.1186/s13059-020-01971-y
- Kudla G, Murray AW, Tollervey D, et al. Coding-sequence determinants of gene expression in Escherichia coli. Science. 2009;324(5924):255-258.
- Sharpl PM, Li W. The codon adaptation index-a measure of directional synonymous codon usage bias, and its potential applications. Nucleic Acids Res. 1987;15(3):1281–1295.
- Tuller T, Waldman YY, Kupiec M, et al. Translation efficiency is determined by both codon bias and folding energy. Proc Natl Acad Sci. 2010;107(8):3645–3650.
- Bernstein JA, Khodursky AB, Lin P-H, et al. Global analysis of mRNA decay and abundance in Escherichia coli at single-gene resolution using two-color fluorescent DNA microarrays. Proc Natl Acad Sci. 2002 Jul;99(15):9697–9702.
- Nevo-Dinur K, Nussbaum-Shochat A, Ben-Yehuda S, et al. Translation-independent localization of mRNA in E. coli. Science. 2011;331(6020):1081–1084.
- Yurovsky A, Amin MR, Gardin J, et al. Prokaryotic coding regions have little if any specific depletion of Shine-Dalgarno motifsPLoS One. 2018 Aug 23;13(8):e0202768.
- Hockenberry AJ, Amaral AN, Jewett MC, et al. Selection removes Shine-Dalgarno-like sequences from within protein coding genes Assessing the conservation status of Shine-Dalgarno-like sequenceMol Biol Evol. 2018;35(10):2487-2498.
- Shaham G, Tuller T. Genome scale analysis of Escherichia coli with a comprehensive prokaryotic sequence-based biophysical model of translation initiation and elongation. DNA Res. 2018;25(2):195–205.
- Hofacker IL. Vienna RNA secondary structure server.
- Diament A, Tuller T. Estimation of ribosome profiling performance and reproducibility at various levels of resolution. Biol Direct. 2016;11(1):24.
- MartinRemoves adapter sequences from high-throughput sequencing reads. EMBnet.journal. 2011 May;17(1):10–12.
- Langmead B, Trapnell C, Pop M, et al. Ultrafast and memory-efficient alignment of short DNA sequences to the human genome. Genome Biol. 2009 Mar;10(3):R25.