
ABSTRACT
5-Methylcytosine (m5C) is a type of RNA modification that exists in tRNAs and rRNAs and was recently found in mRNA. Although mRNA m5C modification has been reported to regulate diverse biological process, its function in adipogenesis remains unknown. Here, we demonstrated that knockdown of NOL1/NOP2/Sun domain family member 2 (NSUN2), a m5C methyltransferase, increased lipid accumulation of 3T3-L1 preadipocytes through accelerating cell cycle progression during mitotic clonal expansion (MCE) at the early stage of adipogenesis. Mechanistically, we proved that NSUN2 directly targeted cyclin-dependent kinase inhibitor 1A (CDKN1A) mRNA, a key inhibitory regulator of cell cycle progression, and upregulated its protein expression in an m5C-dependent manner. Further study identified that CDKN1A was the target of Aly/REF export factor (ALYREF), a reader of m5C modified mRNA. Upon NSUN2 deficiency, the recognition of CDKN1A mRNA by ALYREF was suppressed, resulting in the decrease of CDKN1A mRNA shuttling from nucleus to cytoplasm. Thereby, the translation of CDKN1A was reduced, leading to the acceleration of cell cycle and the promotion of adipogenesis. Together, these findings unveiled an important function and mechanism of the m5C modification on adipogenesis by controlling cell cycle progression, providing a potential therapeutic target to prevent obesity.
Introduction
Obesity, a global public health problem, is associated with numerous chronic diseases, including type 2 diabetes, cardiovascular diseases and cancer [Citation1–3]. The prevalence of obesity increases every year, threatening the health of almost 2 billion adults and 340 million children all over the world [Citation4]. Obesity, characterized as abnormal or excessive fat accumulation, is determined by increased adipocyte volume (hypertrophy) and number (hyperplasia) during adipogenesis [Citation5]. Thus, expanding our understanding of adipogenesis molecular mechanism is of great scientific and health significance.
To date, more and more researchers have found that epigenetic modifications play critical roles in adipocyte differentiation [Citation6]. As a novel widespread modification in eukaryote mRNA, 5-methylcytosine (m5C) is modulated by methyltransferase and RNA-binding proteins of this mark, attracting extensive attention worldwide [Citation7]. NOP2/Sun domain family member 2 (NSUN2) was identified as the main m5C methyltransferase of mRNA in human and mouse [Citation8,Citation9]. Aly/REF export factor (ALYREF) and Y box binding protein 1 (YBX1) were m5C readers, mediating nuclear-cytoplasmic shuttling and stability of methylated RNAs, respectively [Citation10,Citation11]. Interestingly, the modification is located either in positions close to the Argonaute binding regions within the 3’untranslated region (3’UTR) or the translational start site of mRNA [Citation12–14]. Recent studies have reported that m5C methylation plays critical roles in stem cell differentiation, maternal-to-zygotic transition and human cancer development by regulating mRNA stability, translation or subcellular localization [Citation9,Citation14,Citation15]. However, whether m5C regulates adipogenesis is largely unknown.
In this paper, we revealed that NSUN2 deficiency promoted lipid accumulation by accelerating cell cycle progression in early stage of adipogenesis. Further study indicated that NSUN2 knockdown reduced protein expression of cyclin-dependent kinase inhibitor 1A (CDKN1A), a key cell cycle inhibitory regulator, in an m5C-ALYREF dependent manner. Thus, our works reveal a crucial function of NSUN2/m5C/ALYREF signalling in adipogenesis regulation and provide novel insight into the molecular mechanism of mRNA m5C methylation and its modulators in obesity.
Results
NSUN2 was required for adipogenesis
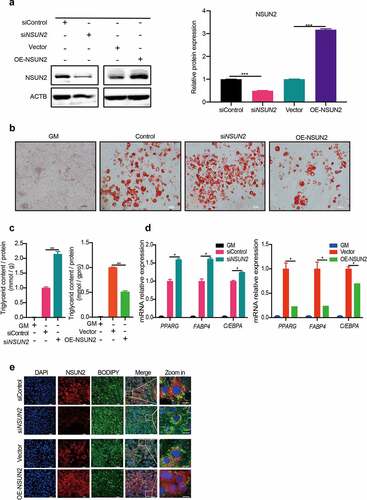
To explore the role of m5C in adipogenesis, we performed loss- or gain-of NSUN2 function studies in 3T3-L1 cells. Efficiency of knockdown or overexpression of NSUN2 in cells was validated by western blot (). Oil Red O staining and triglyceride-level analysis showed that silencing of NSUN2 increased lipid accumulation, while overexpression of NSUN2 showed the opposite phenotype (,). Furthermore, the mRNA expression of adipocyte markers and adipogenic transcription factors peroxisome proliferator activated receptor gamma (PPARG), fatty acid-binding protein 4 (FABP4) and CCAAT/enhancer binding protein alpha (C/EBPA) were significantly upregulated upon NSUN2 deficiency or reduced after the NSUN2 overexpression (). To identify the correlation between NSUN2 level and lipid accumulation in individual cells, we performed immunostaining assay. The results showed that knockdown of NSUN2 significantly increased lipid accumulation, while overexpression of NSUN2 dramatically decreased lipid accumulation in individual cells (). Taken together, these findings suggest a negative correlation between NSUN2 and adipogenesis in 3T3-L1 cells.
Figure 1. NSUN2 was Required for Adipogenesis. A) Western blot analysis of NSUN2 in 3T3-L1 preadipocytes with or without NSUN2 knockdown, control or overexpression NSUN2. ACTB was used as loading control. B) Oil Red O staining of control, NSUN2 knockdown or overexpressed cells after MDI-induced or GM (growth media) for 7 days. Scale bar: 100 μm. C) Relative triglyceride accumulation in GM, siControl, siNSUN2, vector, and OE-NSUN2 cells. Triglyceride accumulation was measured using a triglyceride assay kit. Protein content was measured by BCA Protein Assay Kit. Relative triglyceride accumulation was calculated by Triglyceride accumulation/Protein content. D) Real-time quantitative PCR (qPCR) analysis of PPARG, FABP4, and C/EBPA mRNA expression in cells with or without NSUN2 knockdown, control or overexpression NSUN2. ACTB was used as an internal control. E) Immunostaining results of NSUN2 and Bodipy in siControl, siNSUN2, vector and OE-NSUN2 cells. DAPI (blue), NSUN2 (red), BODIPY (green). Scale bar: 10 μm. The data were presented as the mean ± SD of triplicate tests. *P < 0.05, **P < 0.01, ***P < 0.001 compared to control group
NSUN2 controls adipogenesis by blocking mitotic clonal expansion
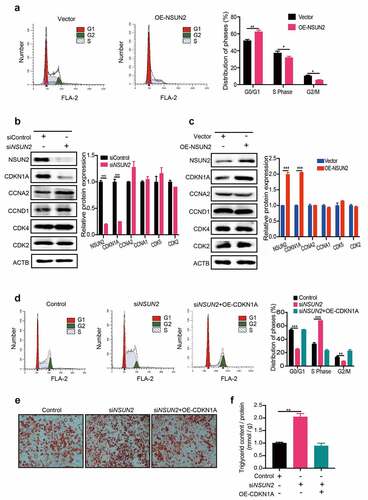
Mitotic clonal expansion (MCE) is an important prerequisite step for adipogenesis that occurs with 48 h of adipogenic stimulation [Citation16]. During MCE, growth-arrested cells undergo re-entry of the cell cycle with additional two rounds of division before terminal differentiation [Citation17]. Previous study suggested that NSUN2 could affect cell cycle in Hela cells [Citation18]. Determining the inhibitory effect of NSUN2 on adipogenesis raised the question of whether NSUN2 can affect the MCE process. Thus, we performed flow cytometry analysis in control or NSUN2-overexpressing 3T3-L1 cells after 18 h of adipogenic induction by an adipogenic differentiation medium (MDI) containing dexamethasone, iso-butylmethylxanthine (IBMX) and insulin. Compared with control cells, overexpression of NSUN2 triggered more cells to accumulate at G1 stage, whereas the cell numbers in S-phase and G2/M-phase decreased (). Therefore, MCE progression was prolonged upon enhanced expression of NSUN2. To further assess the effects of NSUN2 on MCE, the expression of cell-cycle regulators was determined. Cyclins and cyclin-dependent kinases (Cdks) are two major kinds of regulator that determine the cell-cycle progression. However, the protein expression of Cyclin A2 (CCNA2), Cyclin D1 (CCND1), Cyclin Dependent Kinase 1 (CDK1), Cyclin Dependent Kinase 2 (CDK2) and Cyclin Dependent Kinase 4 (CDK4) were not affected by NSUN2. Conversely, the expression level of the cell cycle inhibitor, CDKN1A, was remarkably upregulated in OE-NSUN2 cells and dramatically reduced in siNSUN2 cells (,, Figure S1A), indicating CDKN1A plays critical roles in the OE-NSUN2-induced prolonged G1/S transition. To test this hypothesis, we performed rescue experiment and observed that NSUN2 depletion accelerates G1/S transition, whereas the forced expression of CDKN1A could reverse the siNSUN2-induced acceleration of cell cycle (). Consistently, overexpression of CDKN1A restored adipogenesis and triglyceride accumulation of cells promoted by NSUN2 deficiency (,). Collectively, NSUN2 could block MCE by regulating CDKN1A protein expression, thereby affecting subsequent events in the adipocyte differentiation programme.
Figure 2. NSUN2 Controls Adipogenesis by Blocking Mitotic Clonal Expansion. A) Cell cycle progression analysis of control and NSUN2-overexpressed cells. Cells were harvested at 18 h after MDI initiated and stained via PI. B) Western blot analysis of CDKN1A, CCNA2, CCNA1, CDK4 and CDK2 protein expression in control, NSUN2 knockdown cells after MDI-induced for 18 h. ACTB was used as loading control. C) Western blot analysis of CDKN1A, CCNA2, CCNA1, CDK4 and CDK2 protein expression in Control or NSUN2 overexpressing cells after MDI-induced for 18 h. ACTB was used as loading control. D) Cell cycle progression analysis of control and NSUN2 knockdown cells transfected with or without CDKN1A plasmid. Cells were harvested at 18 h after MDI initiated and stained via PI. E) Oil Red O staining of control, CDKN1A overexpression with or without NSUN2 knockdown cells on day 7 of adipogenic differentiation. Scale bar: 100 μm. F) Relative triglyceride accumulation in Control and siNSUN2 cells transfected with or without OE-CDKN1A. Triglyceride accumulation was measured using a triglyceride assay kit. Protein content was measured by BCA Protein Assay Kit. Relative triglyceride accumulation was calculated by Triglyceride accumulation/Protein content. The data were presented as the mean ± SD of triplicate tests. *P values were calculated by Student’s t-test. *P < 0.05, **P < 0.01, ***P < 0.001
NSUN2 promotes the translation efficiency of CDKN1A mRNA
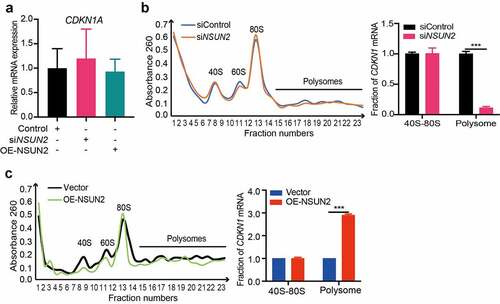
To further explain the relevance between NSUN2 and protein abundances of CDKN1A, we detected the CDKN1A mRNA levels of NSUN2 knockdown or overexpressed cells. Surprisingly, there was no relevance between CDKN1A mRNA levels and NSUN2 expression (), indicating that NSUN2 might control CDKN1A expression at the translational level. Next, we investigated whether NSUN2 influences CDKN1A expression by promoting mRNA translation. Polysome fraction analysis was performed in 3T3-L1 cells upon NSUN2 overexpression or knockdown, separating cellular fractions along a 10%–50% sucrose gradient. RNA was then isolated based on the number of ribosomes associated with the RNAs (,). As detected by qPCR, CDKN1A mRNA showed noticeable decreases in the polysome portion of NSUN2 deficient cells (), whereas increased in the NSUN2 overexpressed cells (). Collectively, these results indicated that NSUN2 promoted translation efficiency of CDKN1A mRNA.
Figure 3. NSUN2 Promotes the Translation Efficiency of CDKN1A mRNA. A) qPCR analysis of CDKN1A mRNA expression in control, NSUN2 knockdown or overexpressing cells. ACTB was used as internal control. B) polysome fraction and qPCR analysis of CDKN1A mRNA expression in 40S-80S ribosomes and polysomes fractions isolated from control or NSUN2 knockdown cells. C) polysome fraction and qPCR analysis of CDKN1A mRNA expression in 40S-80S ribosomes and polysomes fractions isolated from control or NSUN2 overexpressing cells. The data were presented as the mean ± SD of triplicate tests. P values were calculated by Student’s t-test. *P < 0.05, **P < 0.01, ***P < 0.001
NSUN2 promotes CDKN1A protein expression in an m5C-dependent manner
To investigate the underlying mechanism of NSUN2 on regulation of CDKN1A protein expression, we tested whether the methyltransferase activity of NSUN2 is required. Firstly, wild-type (NSUN2-wt) and mutant (NSUN2-mut) NSUN2 plasmid with mutated releasing (cysteine 35) and catalytic (cysteine 85) sites were constructed based on the published work (Figure S1B). Forced expression of NSUN2-wt, but not NSUN2-mut or vector, significantly increased CDKN1A protein expression (). In addition, we found that triglyceride accumulation was curbed in cells expressing NSUN2-wt, rather than NSUN2-mut, confirming that the methyltransferase activity of NSUN2 is required for adipogenesis (,).
Figure 4. NSUN2 Promotes CDKN1A Protein Expression in an m5C-dependent Manner. A) Western blot analysis of CDKN1A protein levels in wild type (wt)- and mutant (mut)-NSUN2 cells after MDI-induced for 18 h. ACTB was used as loading control. B) Oil Red O staining of control, NSUN2-wt or NSUN2-mut overexpressing cells on day 7 day of adipogenic differentiation. Scale bar: 100 μm. C) Relative triglyceride accumulation in OE-NSUN2-wt and OE-NSUN2-mut cells. Triglyceride accumulation was measured using a triglyceride assay kit. Protein content was measured by BCA Protein Assay Kit. Relative triglyceride accumulation was calculated by Triglyceride accumulation/Protein content. D) Methylated RNA immunoprecipitation (MeRIP)-qPCR analysis of m5C levels of CDKN1A mRNA in control, NSUN2-wt or NSUN2-mut overexpressing cells after MDI-induced for 18 h. E) Real-time quantitative PCR (qPCR) analysis of CDKN1A mRNA expression after MDI-induced for 18 h in control and NSUN2 knockdown cells transfected with NSUN2-wt, NSUN2-mut plasmid. F) Methylated RNA immunoprecipitation (MeRIP)-qPCR analysis of m5C levels of CDKN1A mRNA in control and NSUN2 knockdown cells transfected with NSUN2-wt, NSUN2-mut plasmid. G) Western blot analysis of CDKN1A protein levels after MDI-induced for 18 h in control and NSUN2 knockdown cells transfected with NSUN2-wt, NSUN2-mut or empty vector. ACTB was used as loading control. H) Cell cycle progression analysis of control and CDKN1A knockdown cells transfected with NSUN2-wt or NSUN2-mut plasmid 18 h after MDI initiated. The population of cells in each phase (G0/G1, S and G2/M) of the cell cycle were quantified by using ModFit LT software. I) Oil Red O staining of control and CDKN1A knockdown cells transfected with NSUN2-wt or NSUN2-mut plasmid on day 7 of adipogenic differentiation. Scale bar: 100 μm. J) Relative triglyceride accumulation in siControl and siCDKN1A cells transfected with OE-NSUN2-wt or OE-NSUN2-mut plasmid. Triglyceride accumulation was measured using a triglyceride assay kit. Protein content was measured by BCA Protein Assay Kit. Relative triglyceride accumulation was calculated by Triglyceride accumulation/Protein content. The data were presented as the mean ± SD of triplicate tests. P values were calculated by Student’s t-test. *P < 0.05, **P < 0.01, ***P < 0.001
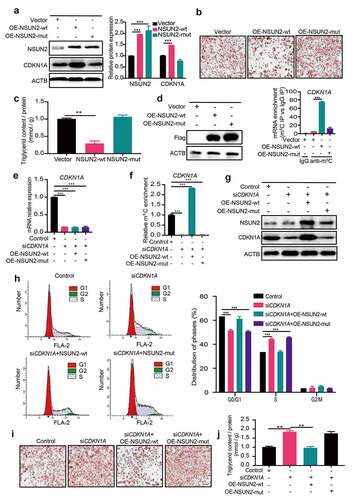
Previous study showed that CDKN1A mRNA contained at least five m5C sites in Hela cells [Citation18]. Next, we performed sequence alignment between human and mouse CDKN1A mRNA 3’UTR sequence, exhibiting a high degree of resemblance (Figure S1C). We conducted a bisulphate RNA sequencing assay to identify the m5C sites within CDK1NA. As shown in Figure S1D, three potential m5C sites (C1876, 80%; C1898, 75%; and C1907, 75%) were identified within 3’UTR of CDK1NA. Upon NSUN2 knockdown, the three m5C sites level were decreased (C1876, 15%; C1898, 15%; and C1907, 20%), and the three m5C sites level were increased (C1876, 95%; C1898, 90%; and C1907, 95%) when overexpressing of NSUN2. Furthermore, m5C immunoprecipitation-qPCR (m5C-IP-qPCR) analysis was used to validate the m5C levels of CDKN1A transcripts in cells transfected with Flag-tagged NSUN2-wt or NSUN2-mut plasmid. As expected, m5C levels of CDKN1A mRNA were substantially elevated by NSUN2-wt instead of NSUN2-mut (). The m5C level of CDKN1A was dramatically decreased upon NSUN2 knockdown (Figure S1E). The RT-PCR results showed that CDKN1A mRNA level was decreased in siCDKN1A cells compared to Control cells, and the CDKN1A mRNA level could not be rescued upon NSUN2-wt or NSUN2-mut overexpressing in siCDKN1A cells (). As expected, silencing of CDKN1A decreased the m5C level of CDKN1A in siCDKN1A cells. Overexpressing NSUN2-wt hypermethylated the remaining CDKN1A mRNA in siCDKN1A cells, while overexpressing NSUN2-mut contributed no effects on m5C level of CDKN1A mRNA (). Consistently, CDKN1A protein level and cell cycle progression could be reversed upon NSUN2-wt overexpressing instead of NSUN2-mut (,). Eventually, excess triglyceride accumulation was rescued by NSUN2-wt, but not NSUN2-mut in CDKN1A knockdown cells (,). To sum up, these results demonstrate that the m5C methylation activity of NSUN2 was necessary for CDKN1A expression and the regulation of cell cycle progression during adipogenesis.
m5C reader ALYREF facilitates CDKN1A mRNA export
Studies have shown that m5C binding proteins, including ALYREF and YBX1, mediate mRNA export and stability, respectively, [Citation10,Citation15]. In our study, we found that YBX1 has no effect on CDKN1A protein expression (Figure S1F). As ALYREF could recognize m5C-containing mRNA and promote mRNA export, thereby enhancing mRNA translation [Citation10]. We hypothesized that m5C might regulate CDKN1A expression through ALYREF-mediated mRNA export. To confirm this, ALYREF-Flag was generated and overexpressed in 3T3-L1 cells. RIP-qPCR result showed that CDKN1A mRNA interacted with ALYREF (). The CDKN1A protein expression was blocked upon ALYREF silencing (). And, reducing ALYREF expression could inverse the enhanced expression of CDKN1A in NSUN2-overexpressing cells (). These results confirm that ALYREF can directly bind to CDKN1A mRNA and regulate its protein expression.
Figure 5. m5C Reader ALYREF Facilitates CDKN1A mRNA export. A) Western blot analysis of FLAG in control and ALYREF-Flag overexpressing cells (left). Real-time qPCR analysis of CDKN1A mRNA expression in input and ALYREF-Flag RIP cells (right). B) Western blot analysis of CDKN1A protein levels in cells with or without ALYREF knockdown. ACTB was used as loading control. C) Western blot analysis of CDKN1A protein levels in control and ALYREF overexpressing cells with or without NSUN2 knockdown after MDI-induced for 18 h. ACTB was used as loading control. D) RNA immunoprecipitation-qPCR (RIP-qPCR) analysis of CDKN1A mRNA expression in ALYREF-Flag overexpressing cells with NSUN2 knockdown or not. E) RIP-qPCR analysis of CDKN1A mRNA expression in control, wt- or mut-NSUN2 overexpressing cells. F) Western blot analysis of CDKN1A protein levels in ALYREF overexpressing cells with or without NSUN2 knockdown after MDI-induced for 18 h. ACTB was used as loading control. G) Oil Red O staining of NSUN2 overexpressing cells with or without ALYREF knockdown. Scale bar: 100 μm. H) Relative triglyceride accumulation in Control and OE-NSUN2 cells transfected with or without siALYREF. Triglyceride accumulation was measured using a triglyceride assay kit. Protein content was measured by BCA Protein Assay Kit. Relative triglyceride accumulation was calculated by Triglyceride accumulation/Protein content. I) qPCR analysis of CDKN1A mRNA in the nucleus or cytoplasm of control and ALYREF knockdown cells. J) Electrophoresis analysis of endpoint PCR product of CDKN1A, RNU6 and ACTB isolated from nucleus and cytoplasm fraction in control and ALYREF knockdown cells. K) Fluorescence in situ hybridization (FISH) analysis of CDKN1A mRNA in ALYREF overexpressing cells with or without NSUN2 knockdown. L) Oil Red O staining of ALYREF overexpressing cells with or without NSUN2 knockdown on day 7 of adipogenic differentiation. M) Relative triglyceride accumulation in Control and OE-ALYREF cells transfected with or without siNSUN2. Triglyceride accumulation was measured using a triglyceride assay kit. Protein content was measured by BCA Protein Assay Kit. Relative triglyceride accumulation was calculated by Triglyceride accumulation/Protein content. The data were presented as the mean ± SD of triplicate tests. P values were calculated by Student’s t-test. *P < 0.05, **P < 0.01, ***P < 0.001
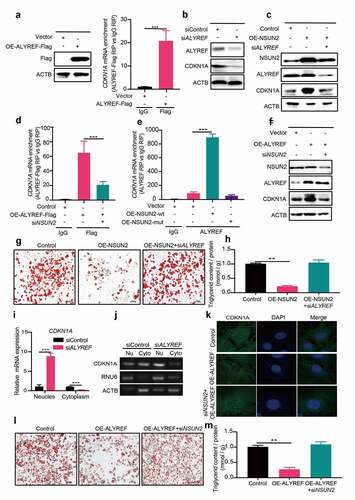
We next ask if ALYREF could bind to CDKN1A mRNA in an m5C-dependent manner. It was shown that silencing of NSUN2 reduced CDKN1A mRNA level bound with ALYREF (). Furthermore, overexpression of NSUN2-wt successfully enhanced the endogenous binding ability of ALYREF to CDKN1A mRNA, while NSUN2-mut plasmid failed to achieve this (). Consistently, upon silencing of NSUN2 in ALYREF overexpressing cells, CDKN1A protein expression could be reversed to almost the same level observed in control cells (). Besides, overexpressing of NSUN2 decreased lipid accumulation, while knockdown of ALYREF in NSUN2 overexpressing cells could rescue the lipid accumulation level to almost the same in control cells (,). The above results suggested that ALYREF could facilitate CDKN1A translation in an m5C dependent manner.
ALYREF could promote m5C containing mRNA export from nucleus to cytoplasm. We isolated nucleus and cytoplasm RNA in cells transfected with siControl or siALYREF (Figure S1G) to measure CDKN1A mRNA subcellular location. The result showed that CDKN1A mRNA level was accumulated in the nucleus (), indicating CDKN1A mRNA was blocked in nucleus upon ALYREF knockdown. Accordingly, PCR products electrophoresis analysis displayed an enriched CDKN1A mRNA in nucleus when ALYREF was reduced (). Furthermore, FISH assay confirmed that overexpression of ALYREF promoted CDKN1A mRNA transport from nuclear to cytoplasm, which could be prevented by knockdown of NSUN2 (). Decreased lipid accumulation in ALYREF overexpressing cells could be reversed by siNSUN2 (,). These works indicated that ALYREF selectively promoted CDKN1A mRNA export in a m5C dependent way.
Taken together, these results indicate that NSUN2 increases the m5C level of CDKN1A mRNA, which was recognized and exported from nuclear to cytoplasm by ALYREF. More CDKN1A mRNA was translated and protein level increased, leading to the blocking of the MCE process and further inhibiting adipogenesis.
Discussion
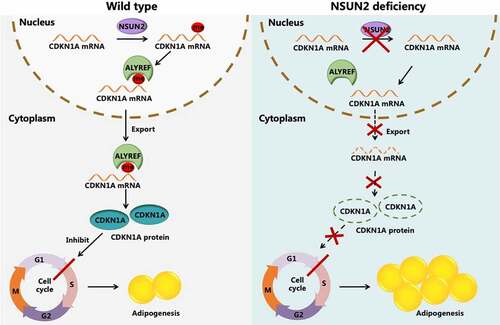
Previous works have demonstrated that m5C was strongly associated with cell proliferation and differentiation [Citation19]. However, since the first identified m5C methyltransferase, the functional roles of NSUN2 on adipogenesis remain unclear. In the current study, we provided novel insights into the mechanism underlying adipogenesis and clarified that NSUN2 mediated the cell cycle progression of MCE at the early stage of adipogenesis through an m5C-ALYREF dependent manner. Overexpression of NSUN2 increased mRNA m5C level of cell cycle-related suppressor gene CDKN1A, then boosted its translation efficiency via ALYREF-mediated mRNA nuclear export, thereby inhibiting adipogenesis ().
Figure 6. Working model of the mechanism of NSUN2 negatively regulated adipogenesis in an m5C-ALYREF-dependent manner. NSUN2 methylated 3’UTR of CDKN1A mRNA in 3T3-L1 preadipocytes. Subsequently ALYREF, a m5C binding protein, was recruited to CDKN1A mRNA to promote it export to cytoplasm from nuclear. More CDKN1A mRNA was translated and protein level increased, leading to the block of MCE process and further inhibiting adipogenesis
MCE is an essential step for adipogenesis that occurs during the early stage of differentiation, in which preadipocytes undergo two rounds of cell cycle and proliferation in the regulation of cell cycle-related genes [Citation20]. Evidence has established that Cdk inhibitory factors, such as CDKN1A, p27 and p53, acted as brakes to impede cell cycle progression by regulating the kinase activity of Cdk/cyclin complexes. CDKN1A is the main cell cycle inhibitor, reported to block the transition from G1 to S phase of cell cycle, which has negative correlation with adipogenesis [Citation21]. What is more, NSUN2 was reported as a critical regulator of cell cycle in human cells [Citation18]. Here, we found that overexpression of NSUN2 promoted CDKN1A mRNA m5C modification and promoted its protein expression, thereby impairing cell cycle progression and adipogenesis.
In general, mRNA modifications mainly exert their functions via recruiting specific binding proteins, as validated by the findings in m6A-modified RNA [Citation22]. Similarly, m5C modification in mRNA requires to be specifically recognized by binding proteins, including ALYREF and YBX1, to exert its regulation functions [Citation10,Citation23]. Strong evidence was provided that m5C modified mRNA could specifically be recognized by ALYREF, and consequently promotes selective mRNA export [Citation10]. However, YBX1 preferentially recognizes m5C-containing mRNAs through π-π interactions with Trp45, a key residue, in YBX1’s cold shock domain, which plays essential roles in maintaining maternal mRNA stability [Citation14]. In our study, NSUN2 did not impair the CDKN1A mRNA levels, while CDKN1A protein expression was positively related to the levels of m5C-modified mRNA, indicating that ALYREF was involved in regulation of CDKN1A expression. Further results confirmed that CDKN1A is the target gene of ALYREF. Our results discovered that ALYREF could modulate CDKN1A expression by regulating its mRNA export. A recent report showed that m6A and m5C modification cooperatively regulated CDKN1A translation [Citation18], which raises the possibility that cell differentiation is determined through collaborating with other signalling pathways. Therefore, further research is required to test this hypothesis.
In summary, we find that NSUN2, an m5C methyltransferase, plays a critical role in early stage of adipocyte differentiation by regulating CDKN1A mRNA export and protein synthesis. The adipocyte life cycle, including proliferation and adipogenesis, has become a potential target for many bioactive compounds and drugs for the prevention and treatment of obesity. For the first time, our results provide profound insights into the molecular mechanisms of adipogenesis through the regulation of cell cycle in an m5C-dependent and ALYREF-mediated manner, suggesting a new direction for the development of effective strategies for the treatment of obesity.
Materials and methods
Cell culture and adipocyte differentiation
3T3-L1 preadipocytes were cultured in Dulbecco’s modified eagle medium (DMEM, USA) containing 10% foetal bovine serum (FBS) and 1% penicillin/streptomycin (Gibco, USA). To induce adipocyte differentiation, the medium was replaced by cell differentiation solution I after 2 days of contact inhibition and incubated at 37°C with 5% CO2 for 2 days. The cell differentiation solution I was composed of 10% FBS-DMEM supplemented with 0.5 mM IBMX, 1 µM dexamethasone (Sigma, St. Louis, MO, USA) and 1 µg/mL insulin. After 2 days of inducing, the culture medium was replaced with DMEM supplemented with only 10% FBS and 1 µg/mL insulin and replenished every other day. The differentiation process was sustained until day 7 when the preadipocytes were successfully differentiated into mature 3T3-L1 adipocytes.
Cell transfection
Transfection was achieved by using Lipofectamine 2000 for plasmid and Lipofectamine RNAiMAX (Invitrogen, Carlsbad, CA, USA) for siRNA following the manufacturer’s protocols.
Oil Red O staining
Cells were washed by Cold PBS twice and then using 10% formalin to fix at room temperature for 1 h. The cells were stained with a filtered Oil Red O (Sigma, St. Louis, MO, USA) working solution (six parts 0.35% Oil Red O dye in isopropanol and four parts ddH2O) for 10 min. The cells were then rinsed three times with distilled water and observed under a microscope.
Measurement of triglyceride levels in cells
For triglyceride measurement, differentiated cells were washed twice with PBS and lysed by lysis buffer (Applygen Technologies). The triglyceride levels of the cells were measured using the triglyceride assay kit (Applygen Technologies) according to the manufacturers’ protocol.
Protein extraction and Western blot
Cells were collected and lysed on ice in RIPA buffer containing a protease and phosphatase inhibitor cocktail (Beyotime Biotechnology, Shanghai, China) for 30 min. The lysates were then centrifuged at 14,000 × g for 20 min at 4°C to remove the insoluble materials. The protein concentrations were measured using a BCA protein assay kit (Beyotime Biotechnology, Shanghai, China). Equal amounts of protein (30 µg) were heated for 10 min in SDS/PAGE sample buffer (50 mM Tris (pH 6.8), 100 mM dithiothreitol, 10% glycerol, 2% SDS, and 0.1% bromophenol blue). Proteins were separated by SDS-PAGE and then transferred to polyvinylidene difluoride (PVDF) membranes. The membranes were blocked with 5% non-fat milk and 0.1% Tween-20 at room temperature for 1 h and then incubated with a 1:1,000-dilution of primary antibodies overnight at 4°C. After the membranes were washed, they were incubated with a 1:3,000-dilution of HRP-conjugated secondary antibodies (Santa Cruz Biotechnology, Santa Cruz, CA, USA) at room temperature for 1 h. The immunoblots were visualized using chemiluminescence (ECL Plus detection system) and quantified using ImageJ software. The primary antibodies used in this study were listed in Table S1.
Plasmids and RNA knockdown
The mouse NSUN2 (ENSMUSG00000021595) coding sequence (CDS) was synthesized with a FLAG tag 5′-GACTACAAAGACGATGACGACAAG-3′ at the N terminus and cloned into the pcDNA3.1 expression plasmid (YouBio, Hunan, China) to generate the wild-type construct. NSUN2 CDS sequence was mutated from cytosine 35 or cytosine 85 to alanine (5′-TGC-3′→5′-GCC-3′) or (5′-TGT-3′→5′-GCT-3′). The mouse CDKN1A (ENSMUSG00000023067) and mouse ALYREF (ENSMUSG00000025134) coding sequence (CDS) were synthesized with a FLAG tag (5′- GACTACAAAGACGATGACGACAAG-3′) at the N terminus and cloned into the pcDNA3.1 expression plasmid (YouBio, Hunan, China) to generate construct. These following short interfering RNA sequences were synthesized from GenePharma (Shanghai, China): siControl-F, 5ʹ-UUCUCCGAACGUGCACGUTT-3ʹ (forward) and siControl-R, 5ʹ-ACGUGACACGUUCGGAGAATT-3ʹ (reverse); siNSUN2-F, 5ʹ-GAGGGAGUCAUUCUUACCATT-3ʹ (forward) and siNSUN2-R, 5ʹ-UGGUAAGAAUGACUCCCUCTT-3ʹ (reverse); siALYREF-F, 5ʹ- GCTTGTCACATCACAGATT-3ʹ (forward) and siALYREF-R, 5ʹ-AATCTGTGATGTGACAAGC-3ʹ (reverse); siCDKN1A-F, 5ʹ-GCCUGACAGAUUUCUAUCATT-3ʹ (forward) and siCDKN1A-R, 5ʹ-UGAUAGAAAUCUGUCAGGCTT-3ʹ (reverse); siYBX1-F, 5ʹ- GAGAACCCUAAACCACAAGAUTT −3ʹ (forward) and siYBX1-R, 5ʹ- AUCUUGUGGUUUAGGGUUCUCTT −3ʹ (reverse).
RNA fractionation, RNA extraction, and RT-PCR
Nucleocytoplasmic fractionations of RNA were performed as described previously. Briefly, transfected cells after MDI induced for 18 h, cell pellets from an 80% confluent 10 cm plate were collected and lysed in lysis buffer (10 mM Tris-HCl, 140 mM KCl, 1.5 mM MgCl2, 10 mM EDTA, 0.5% NP-40 and 40 U/ml RNasin, pH 7.4) for 5 min on ice. After centrifugation at 12,000 3 g for 5 min, the supernatants containing the cytoplasmic fraction of RNA were collected. The pelleted nuclei were washed with lysis buffer twice and were finally centrifuged as the nuclear fraction. Cytoplasmic and nuclear RNA were then extracted by TRIzol reagent. RNA was reversed transcribed using M-MLV Reverse Transcriptase (Thermo Fisher Scientific). The reverse-transcription products from samples in the various treatment conditions were used as templates for PCR using Taq DNA polymerase (Invitrogen). PCR products were electrophoresed using 1.5% agarose gels, and images were captured using the Gel Documentation System (Clinx Science Instruments, Shanghai, China). Primers for amplifying each target are listed in Table S2.
Flow cytometry
Post-confluent 3T3-L1 cells transfected with siRNA or plasmid were cultured in MDI medium for 18 and 18 h. The cells were harvested and washed with PBS, then fixed in 70% ice-cold ethanol at −20°C overnight. After washing with PBS and centrifugation, the cell pellet was resuspended by 0.5 mL of FxCycle™ PI/RNase Solution (Invitrogen, Carlsbad, CA, USA). Samples were incubated for 15 min at room temperature in the dark and subjected to a flow cytometer (BD). The analysis of cell cycle distribution was performed with ModFit LT 5.0 Software (Becton Dickinson).
Immunofluorescence and BODIPY staining
3T3-L1 grown on the coverslips were washed three times with PBS and fixed with 4% paraformaldehyde for 15 min. After washing three times with PBS, cells were permeabilized with 0.5% TritonX-100 for 15 min. Cells were then washed three times with PBS, blocked with 5% milk in PBST for 30 min, and incubated 2 h at room temperature with NSUN2 (Proeintech) antibody. After washing with PBST, cells were incubated with DyLight 594 conjugated anti-rabbit IgG secondary antibody (Earth Ox) for 1 h at room temperature. After washing three times with PBST, coverslips were then incubated with BODIPY (Thermo Fisher Scientific) for 10 min at room temperature. After washing three times with PBST, coverslips were then stained with DAPI (Beyotime Biotechnology). Fluorescent images were acquired using a Leica TCS SP8 confocal microscope.
Fluorescence in situ hybridization and confocal microscopy
Cells were fixed in 4% paraformaldehyde for 20 min. Fluorescence in situ hybridization (FISH) was performed as previously described [Citation24], and images were obtained with a Leica TCS SP2 confocal laser microscope LSM 510. Probes of CDKN1A transcripts are as follows: 5ʹ-CGGACATCACCAGGATTGGA-3ʹ.
Polysome fraction analysis
Preparation of given treated cells and polysome gradients were performed as previously described [Citation25]. One 10 cm2 plate cells were incubated for 37°C 15 min in the presence of 0.1 mg/mL cycloheximide. Cells were scraped and subsequently centrifuged at 1000 × g for 5 min added 200 μL of lysis buffer (0.1 M HEPES, pH 7.6, 0.3 M KCl, 1 M MgCl2, 1% Triton X-100, 0.1 mg/mL CHX) with proteinase inhibitor and RNase inhibitor. Lysates were cleared by centrifugation at 12,000 × g for 20 min at 4°C, after which the supernatant was collected and added Turbo DNAase I for 15 min at 37°C. Samples were loaded onto 10–50% sucrose gradients and were separated by ultracentrifugation for 2 h 30 min at 38,000 rpm on a Beckman SW41 rotor at 4°C. Gradients were then fractionated from the bottom and approximately 33 0.3 mL-samples or 27 0.5 mL-samples were recovered. This was followed by a recording A260 of the polysome profiles by Nanodrop. The RNA fraction was isolated from 3-fold volume of TRIzol reagent. Reversed cDNA was analysed using quantitative RT-PCR as described above.
Methylated RNA immunoprecipitation coupled with quantitative real-time PCR (meRIP-qPCR)
m5C meRIP-qPCR was performed as previously described [Citation9]. TRIzol reagent (Ambion) was used to isolate total RNA from 3T3-L1 cells. Enrichment of mRNA from total RNA was performed using Dynabeads® mRNA Purification Kit (Ambion). mRNA was randomly fragmented by incubation at 75°C for 3 min using 1X fragmentation buffer (Ambion). We incubated anti-m5C antibody (Epigentek) or IgG antibody (ABclonal) with Dynabeads Protein G (Bio-Rad) IP buffer (RNase inhibitor), 50 mM Tris-HCl, 750 mM NaCl and 0.5% (vol/vol) Igepal CA-630 (Sigma Aldrich) at 4°C overnight. Bead-antibody complexes were washed three times with IP buffer. m5C-containing mRNA was incubated in 300 μL elution buffer (5 mM Tris-HCl pH 7.5, 1 mM EDTA, 0.05% SDS, and 80 μg Proteinase K) for 1 h at 50°C. Following ethanol precipitation, the input RNA and eluted RNA were reverse transcribed with random hexamers, and m5C enrichment was determined by qPCR. The Ct difference (dCt) between the 1% input and the immunoprecipitated (IP) RNA was determined, and the relative enrichment was calculated as 2^−dCT.
Bisulphate RNA sequencing
2 μg total RNA for each sample was incubated in bisulphite convert buffer (40% sodium bisulphite and 600 μM Hydroquinone in DEPC water) for 70°C 5 minutes and 60°C 1 h, repeating for 3 cycles. After desalting by using MicroBio-spin6 columns, samples were de-sulphonated by 1 M Tris (pH 9.0, 1/1, V/V) at 37°C for 1 h, followed by ethanol precipitation. Bisulphate-converted RNA was reverse-transcribed by cDNA Synthesis Kit (Thermo) using random primer. The reverse-transcribed products (cDNA) were amplified by using the following primer. Forward primer: 5’-TTTTTTGTTTTTATTTAGATTGTAAGYG-3’, Reverse primer: 5’-ATCRAAAAATATTTATTAAACACCAACT-3’. The PCR products (cDNA) were inserted into the pMD19 (Simple) T-Vector (Takara). Twenty single clones for each sample were sequenced, the sequences were aligned with the corresponding CKDN1A mRNA sequence and the cytosines retained were considered to be methylated.
RNA immunoprecipitation (RIP) assay
2 × 10 cm2 plates cells transfected with ALYREF-FLAG plasmid were lysed in 400 μL RIP lysis buffer (150 mM KCl, 10 mM HEPES pH 7.6, 2 mM EDTA, 0.5% NP-40, 0.5 mM DTT, Protease Inhibitor, RNase Inhibitor) and incubated at 4°C for 30 min with rotation. Lysis was immunoprecipitated with an-FLAG beads (Invitrogen, Carlsbad, CA, USA) in IP buffer (200 mM NaCl, 50 mM HEPES pH 7.6, 2 mM EDTA, 0.05% NP-40, 0.5 mM DTT, RNase inhibitor) for 4 h or overnight at 4°C with rotation. The beads were then washed three times with IP Buffer. Total RNA was isolated by using TRIzol reagent (Invitrogen, Carlsbad, CA, USA), and Turbo DNase was added for 15 min at 37°C to remove DNA contamination. RNA was subjected to RT-PCR analysis for quantification. The Ct difference (dCt) between the 1% input and the immunoprecipitated (IP) RNA was determined, and the relative enrichment was calculated as 2^−dCT.
Statistical analysis
All values were presented as the mean ± SD unless otherwise specified. Differences were analysed by Student’s t-test or one-way ANOVA test using SPSS 22 (SPSS Inc, Chicago, USA). Values were considered statistically significant when *P < 0.05, **P < 0.01, ***P < 0.001.
Author contributions
Y.W. and X.W. conceived the project; Y.Z. and X.W. designed most experiments; Y.L., Y.Z., R.W., Y.C., W.C., B.Z. and X.L., performed the experiments; G.G., and Y.L., Y.L. and C.H. analyzed data; Y.L. and Y.Z. wrote the manuscript with suggestion from Y.W and X.W.
Supplemental Material
Download MS Word (16.7 KB)Acknowledgments
This work is supported by the National Key R & D Program (2018YFD0500400), the Fundamental Research Funds for ZheJiang Provincial Colleges & Universities (2019XZZX003-13), the National Natural Science Foundation of China (Grant No. 31572413), the Natural Science Foundation of Zhejiang Province (No. LZ17C170001).
Disclosure statement
The authors declare no conflict of interest.
Supplementary material
Supplemental data for this article can be accessed here.
Additional information
Funding
References
- Sung H, Siegel RL, Torre LA, et al. Global patterns in excess body weight and the associated cancer burden. CA Cancer J Clin. 2019;69(2):88–112.
- Caballero B. Humans against Obesity: who Will Win? Adv Nutr. 2019;10(suppl_1):S4–S9.
- Collaborators GBDO, Afshin A, Forouzanfar MH, et al. Health Effects of Overweight and Obesity in 195 Countries over 25 Years. N Engl J Med. 2017;377(1):13–27.
- Collaboration NCDRF. Worldwide trends in body-mass index, underweight, overweight, and obesity from 1975 to 2016: a pooled analysis of 2416 population-based measurement studies in 128.9 million children, adolescents, and adults. Lancet. 2017;390(10113):2627–2642.
- Muir LA, Neeley CK, Meyer KA, et al. Adipose tissue fibrosis, hypertrophy, and hyperplasia: correlations with diabetes in human obesity. Obesity (Silver Spring). 2016;24(3):597–605.
- Lecoutre S, Pourpe C, Butruille L, et al. PPARgamma2 expression in adipose tissue of male rat offspring from obese dams is associated with epigenetic modifications. FASEB J. 2018;32(5):2768–2778.
- Bohnsack KE, Hobartner C, Bohnsack MT. Eukaryotic 5-methylcytosine (m(5)C) RNA Methyltransferases: mechanisms, Cellular Functions, and Links to Disease. Genes (Basel). 2019;10(2):102.
- Xu X, Zhang Y, Zhang J, et al. promotes cell migration through methylating autotaxin mRNA. J Biol Chem. 2020;295(52):18134–18147.
- Amort T, Rieder D, Wille A, et al. 5-methylcytosine profiles in poly(A) RNA from mouse embryonic stem cells and brain. Genome Biol. 2017;18(1):1.
- Yang X, Yang Y, Sun BF, et al. 5-methylcytosine promotes mRNA export - NSUN2 as the methyltransferase and ALYREF as an m(5)C reader. Cell Res. 2017;27(5):606–625.
- Mordovkina D, Lyabin DN, Smolin EA, et al. Proteins in mRNP Assembly, Translation, and Stability Control. Biomolecules. 2020;10(4):591.
- Squires JE, Patel HR, Nousch M, et al. Widespread occurrence of 5-methylcytosine in human coding and non-coding RNA. Nucleic Acids Res. 2012;40(11):5023–5033.
- Huang T, Chen W, Liu J, et al. Genome-wide identification of mRNA 5-methylcytosine in mammals. Nat Struct Mol Biol. 2019;26(5):380–388.
- Yang Y, Wang L, Han X, et al. RNA 5-Methylcytosine Facilitates the Maternal-to-Zygotic Transition by Preventing Maternal mRNA Decay. Mol Cell. 2019;75(6):1188–1202.
- Chen X, Li A, Sun BF, et al. 5-methylcytosine promotes pathogenesis of bladder cancer through stabilizing mRNAs. Nat Cell Biol. 2019;21(8):978–990.
- Gatticchi L, Petricciuolo M, Scarpelli P, et al. Tm7sf2 gene promotes adipocyte differentiation of mouse embryonic fibroblasts and improves insulin sensitivity. Biochim Biophys Acta Mol Cell Res. 2020;1868(1):118897.
- Liu Q, Zhao Y, Wu R, et al. ZFP217 regulates adipogenesis by controlling mitotic clonal expansion in a METTL3-m(6)A dependent manner. RNA Biol. 2019;16(12):1785–1793.
- Li Q, Li X, Tang H, et al. NSUN2-Mediated m5C Methylation and METTL3/METTL14-Mediated m6A Methylation Cooperatively Enhance p21 Translation. J Cell Biochem. 2017;118(9):2587–2598.
- Mei L, Shen C, Miao R, et al. RNA methyltransferase NSUN2 promotes gastric cancer cell proliferation by repressing p57(Kip2) by an m(5) C-dependentmanner. Cell Death Dis. 2020;11(4):270.
- Kobayashi M, Ohsugi M, Sasako T, et al. RNA Methyltransferase Complex of WTAP, METTL3, and METTL14 Regulates Mitotic Clonal Expansion in Adipogenesis. Mol Cell Biol. 2018;38(16):e00116–18.
- Seong HA, Ha H. Thr55 phosphorylation of p21 by MPK38/MELK ameliorates defects in glucose, lipid, and energy metabolism in diet-induced obese mice. Cell Death Dis. 2019;10(6):380.
- Su R, Dong L, Li C, et al. R-2HG Exhibits Anti-tumor Activity by Targeting FTO/m(6)A/MYC/CEBPA Signaling. Cell. 2018;172(1–2):90–105 e123.
- Zou F, Tu R, Duan B, et al. YBX1 homolog YPS promotes ovarian germ line stem cell development by preferentially recognizing 5-methylcytosine RNAs. Proc Natl Acad Sci U S A. 2020;117(7):3603–3609.
- He J, Mo D, Chen J, et al. Combined whole-mount fluorescence in situ hybridization and antibody staining in zebrafish embryos and larvae. Nat Protoc. 2020;15(10):3361–3379.
- Garre E, Romero-Santacreu L, De Clercq N, et al. Yeast mRNA cap-binding protein Cbc1/Sto1 is necessary for the rapid reprogramming of translation after hyperosmotic shock. Mol Biol Cell. 2012;23(1):137–150.