
ABSTRACT
Breast cancer (BC) as a leading cause of cancer death among women, exhibits a wide range of genetic heterogeneity in affected individuals. Satisfactory management of BC depends on early diagnosis and proper monitoring of patients’ response to therapy. In this study, we aimed to assess the relation between the expression patterns of blood-based microRNAs (miRNAs) with demographic characteristics of the patients with BC in an attempt to find novel diagnostic markers for BC with acceptable precision in clinical applications. To this end, we performed comprehensive statistical analysis of the data of the Cancer Genome Atlas (TCGA) database and the blood miRNome dataset (GSE31309). As a result, 21 miRNAs were selected for experimental verification by quantitative RT-PCR on blood samples of 70 BC patients and 60 normal individuals (without any lesions or benign breast diseases). Statistical one-way ANOVA revealed no significant difference in the blood levels of the selected miRNAs in BC patients compared to any lesions or benign breast diseases. However, the multi-marker panel consisting of hsa-miR-106b-5p, −126-3p, −140-3p, −193a-5p, and −10b-5p could detect early-stages of BC with 0.79 sensitivity, 0.86 specificity and 0.82 accuracy. Furthermore, this multi-marker panel showed the potential of detecting benign breast diseases from BC patients with 0.67 sensitivity, 0.80 specificity, and 0.74 accuracy. In conclusion, these data indicate that the present panel might be considered an asset in detecting benign breast disease and BC.
Introduction
Breast cancer (BC) is the second-most common cancer and the seventh-leading cause of cancer mortality in the Iranian population [Citation1]. Due to the lack of databases on cancer in developing countries, the exact number of patients with BC is not known. Despite the significant progress in BC research, it is challenging to detect BC at early stages before spreading to other parts of the body.
BC includes a broad spectrum of different subtypes with diverse biological characteristics. While mammography is still the most prevalent technique for screening BC patients, it lacks sufficient accuracy and tumour detection sensitivity [Citation2]. Although novel mammography-based methods improved the sensitivity and specificity of detection [Citation3], some individuals avoid annual mammography because of the risk of exposure to high radiation, making it an invasive approach. Besides, mammography is not sufficient for women with extremely dense breast tissues. Moreover, the success of BC therapy is ultimately related to timely diagnosis and choosing the most efficacious therapies. Analysis of biomarkers in BC is a routine practice that can provide the required information to subcategorize BC and decide specific treatments for each patient [Citation4].
Tumour tissue-based biomarkers such as size, grade, node status, oestrogen receptor (ER), progesterone receptor (PR), the human epidermal growth factor receptor (HER2), and the Ki-67 are widely used in the standard clinical practice for both primary and metastatic BC patients [Citation5]. Besides, gene expression signatures of breast carcinomas have led to new classifications of tumour subgroups and carry prognostic and predictive information [Citation6]. Circulating molecular biomarkers such as proteins, metabolites, lipids, and nucleic acids are also parameters that might be used to determine BC subtypes. Although serum tumour markers, such as the carcinoembryonic antigens CA 15.3 and CA 27.59, could provide prognostic information, they are not currently recommended for screening, diagnosis, or routine surveillance after initial treatment [Citation7].
Since microRNAs (miRNAs) are secreted into the extracellular fluid and transported to the peripheral blood, they are detectable in blood in a stable form [Citation8]. Accordingly, circulating miRNAs were shown to be promising molecular indicators for prognosis and diagnosis of various malignancies [Citation9]. MiRNAs comprise a class of short, single-stranded non-protein-coding RNAs (ncRNAs) of ~22 nucleotides in length, and their dysregulation has been associated with development of human diseases [Citation10,Citation11], including BC [Citation12]. Besides, experimental evidence indicated that miRNAs could play roles in cancer progression as ‘oncomiR’ or ‘tumor-suppressive miRNA’ by regulating gene expression through degradation of target mRNA [Citation13].
The first step in identifying distinct miRNA profiles that can be considered in prognosis of a particular cancer, is discovering miRNA expression patterns in that condition. The altered expression of circulating miRNAs may be observed before emergence of obvious clinical symptoms and so far, a growing number of such expression pattern alterations was reported. A group of miRNAs including hsa-miR-374b-5p were shown to be capable of identifying patients with early-stage lung cancer with an accuracy of 95.9% (95% CI, 95.7%–96.2%), a sensitivity of 76.3% (95% CI, 74.5%–78.0%), and a specificity of 97.5% (95%CI, 97.2%–97.7%) [Citation14]. Circulating miR-1225-5p, miR-1202-5p, miR-1207-5p, miR-4270-5p, miR-642b-3p, and miR-4281-3p were significantly increased in BC patients’ plasma with stage I [Citation15].
Despite extensive research on the application of circulating miRNAs as potential clinical biomarkers [Citation16,Citation17,Citation18], there is still a paucity of a sensitive and accurate molecular diagnostic test for BC. This issue needs to be addressed for transition of miRNA-based diagnostic tools from basic sciences to clinical applications. Furthermore, several conditions must be met before BC screening succeeds in asymptomatic populations. In this context, population-based precision cancer test provides an adequately sensitive and specific screening strategy for early detection of BC.
As combination of biomarkers enhances the diagnostic test’s power, we herein aimed to find a multiple marker (multi-marker) panel of miRNAs as potentially novel blood-based biomarkers for BC screening or early detection. To reach a reliable miRNA panel, we analysed the miRNome of 695 BC and 87 normal breast tissues by a comprehensive computational approach that was followed by experimental verification on clinical blood samples.
Materials and methods
Study design and data collection
In the present study, two consecutive phases were followed to find and validate a proper set of miRNAs capable of discriminating BC patients from healthy individuals. The Cancer Genome Atlas (TCGA) and Gene Expression Omnibus (GEO) databases were explored to find the candidate miRNA set. Only the data of different cancer types published in TCGA, which respectively contained more than 9 and 50 samples of normal and cancer groups were considered. This approach led to retrieving the miRNome data of 4981 paired tissue samples belonging to 14 cancer types (from 11 different tissues). These cancer types are related to bladder, oesophageal, lung, stomach, thyroid, uterine, kidney, prostate, breast, liver cancers, and head and neck [Supplementary Table S1].
In the computational phase, a list of candidate differential expressed miRNAs has been calculated. In addition to the previous approach, another set of candidates has been selected by their power to classify BC samples from the others using machine learning method. These approaches produced two different lists of miRNAs according to the type of analysis. A microarray dataset, consisting of 105 blood samples (57 healthy and 48 BC individuals) deposited in the GEO database under the accession number GSE31309, was intersected with the lists as mentioned above. Finally, 21 miRNAs were selected for downstream analyses ().
Figure 1. Flow work of the present study. The Bioinformatics analyses (machine learning and differential expression approaches) (a) together with wet-lab analyses were undertaken for identification, assessment and validation of a set of miRNAs capable of detecting BC at early stages (b). The data of 14 TCGA cancer types and a dataset of blood miRNome (GSE31309) were used as the input data of Bioinformatics analyses. The qRT-PCR method followed by statistical analysis of the results were utilized for final validation of the bioinformatics phase. DF = differentially expressed, miRNA = microRNA, BC = Breast Cancer, qRT-PCR = quantitative real time PCR
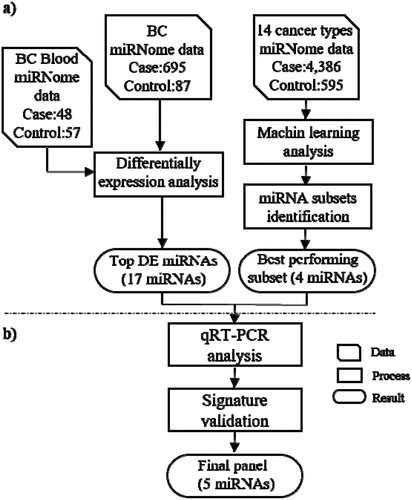
In the experimental phase, the quantitative RT-PCR (qRT-PCR) method was applied for expression analysis of the candidate miRNAs in blood samples of 70 BC patients and 60 NCs, to achieve an applicable and accurate panel for minimally invasive early detection of BC and benign breast disease (BBD) ().
Bioinformatics analysis
To identify a small set of miRNAs capable of discriminating BC samples from NC and all other samples with a different type of cancer, two different statistical approaches were used. First, differential expression analysis was performed by using quantile normalization from the limma package in R. This analysis has been done on a combination of 695 BC tissues and 87 normal breast miRNome data of TCGA database and blood-based miRNome data of 48 early-stage BC patients and 57 NCs, which were deposited in the GEO database under the accession number GSE31309. The miRNAs with Benjamini-Hochberg adjusted P-value less than 0.001 and with absolute log fold change >1 were selected. In the second approach, Support Vector Machine (SVM) from ‘e1071’ package in R has been used to classify samples into the three of BC, NC and all other types of cancers. In order to select a small set of candidate, the model has been trained for each set of possible miRNAs with maximum of 5 members. The set with the highest performance has been selected as a candidate list. To avoid overfitting, samples randomly divided into the two group of train and test with the equal size (half of the data as training and the other half as test). Eventually, the miRNAs highlighted by the two computational approaches were selected for further analyses.
Participants and blood samples
Blood samples (2.5 mL) were taken from 70 BC patients and 60 NCs (benign lesion or no lesion) who were admitted or were referred to Imam Khomeini Hospital Complex and Breast Cancer Research Center, Motamed Cancer Institute (Tehran, Iran) from July 2016 to August 2019. All blood samples were collected in PAXgene Blood RNA tubes and stored at −80°C until analysis according to the manufacturer’s instruction. These tubes were specialized for stabilizing intracellular RNA from whole blood.
BC patients for whom, tumours of stages between I and III were pathologically approved before surgery, were eligible for inclusion in this study. Normal individuals consisted of women tested by sonography and validated to have no history of any cancer. Informed consent was obtained from all participants and the study was approved by the Royan Institute ethics committee (IR.ACECR.ROYAN.REC.1395.74). and supplementary table S2 summarize the information of the participants.
Table 1. Characteristics of the BC patients included in this study (a) and normal control group with benign lesion disease or no lesion (b)
RNA extraction and cDNA synthesis
At least two hours before RNA extraction, the blood samples in PAXgene tubes were thawed at room temperature to ensure complete lysis of blood cells. Total RNA, including miRNA was extracted using the PAXgene Blood miRNA Kit (Qiagen, USA) according to the manufacturer’s instruction. Quantitative and qualitative RNA extraction analyses were performed using the Nanodrop 2000 spectrophotometer (Thermo Scientific, USA) and electrophoresis on agarose gel (1%), respectively. Here, 1000 ng of the extracted RNAs was used as the input for cDNA synthesis, which was implemented by miScript II RT Kit (Qiagen, USA), according to the manufacturer’s protocol.
Quantitative RT-PCR (qRT-PCR)
Expression of miRNAs was measured by miScript SYBR Green PCR kit (Qiagen, USA) using the StepOnePlus Real-Time PCR System (Applied Biosystems, USA). The expression level of miRNAs was assessed in duplicate and normalized based on the expression of SNORD48 snoRNA (U48) to obtain ∆Ct values. MiRNA-specific primer sequence was designed based on each miRNA query submitted to the miRBase database. The sequences of all primers used in this study are shown in supplementary Table S3. miRNAs expression was defined based on the threshold cycle (CT), and the fold change levels of miRNAs were calculated using 2‑ΔΔCt, where ΔΔCt = (Ct miRNA – Ct U48) Breast cancer – (Ct miRNA – Ct U48) Normal control [Citation19].
Statistical analysis
The miRNA’s relative expression levels of BC patients were normalized against those of NCs (with benign lesion or with no lesion) using one-way ANOVA test. Mean ± standard error of measurement (SEM) were used to present the data. Receiver operator curve (ROC) plots were generated, using Random Forest models, to evaluate the diagnostic performance of various miRNAs and multi-marker panels. The area under ROC curve (AUC) was used as an accuracy index for evaluation of diagnostic potential of the selected miRNAs. Classification analyses were performed by Random Forest classifier with 5 fold cross validation using Weka and a P-value < 0.05 was considered statistically significant.
Functional enrichment and pathway analysis of miRNAs defining in panel
Pathway analysis of the selected miRNAs in the diagnostic panel was performed using KEGG, WikiPathways, and Reactome in miRPath database and the default cut-off scores were chosen for the enrichment. This system is an online resource for miRNome data analysis. The pathways related to BC were explored to find critical genes that manage BC progression.
Results
MiRNAs for determination of cancer status
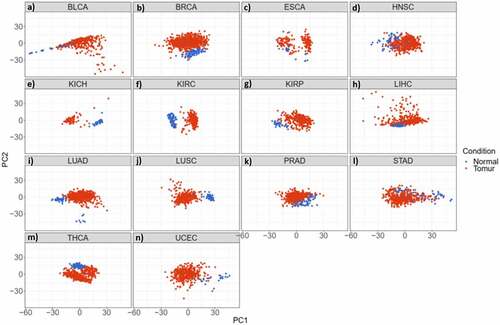
The read per million data has been downloaded from TCGA (December 2015) and the initial quality control has been done by TCGA. In addition, the data has been normalized by using quantile normalization from the limma package. After downloading and normalizing the next-generation sequencing (NGS) miRNome data of 14 cancer types, a supervised classification by principal component analysis (PCA) determined that tumour tissues of each cancer type could be sufficiently discriminated from the normal samples based on the expression level of miRNAs (). Among all cancer types, we focused on BC in the present study ().
Figure 2. miRNAs have the potential to discriminate cancer patients (red) from normal individuals (blue) in 14 studied cancer types. a-n) Principal Component Analysis (PCA) of different cancer types; a) Bladder Urothelial Carcinoma. b) Breast Invasive Carcinoma. c) Oesophageal Carcinoma. d) Head and Neck Squamous Cell Carcinoma. e) Kidney Chromophobe. f) Kidney Renal Clear Cell Carcinoma. g) Kidney Renal Papillary Cell Carcinoma. h) Liver Hepatocellular Carcinoma. i) Lung Adenocarcinoma. j) Lung Squamous Cell Carcinoma. k) Prostate Adenocarcinoma. l) Stomach Adenocarcinoma. m) Thyroid Carcinoma. n) Uterine Corpus Endometrial Carcinoma
Genome-wide data analysis identified discriminative miRNAs in BC
MiRNome data analysis resulted in finding two sets of miRNAs. The first set contained 81 top DE miRNAs (Benjamini-Hochberg adjusted P-value < 0.001 and absolute log FC > 1) in 695 BC patients and 87 normal individuals from the TCGA dataset [Supplementary Table S4]. To lower the number of miRNAs and investigating whether they are differentially expressed in blood samples of BC patients compared to the normal controls (NCs), the microarray data of whole blood miRNome belonging to the early-stage of BC patients (GSE31309) was added to the TCGA miRNome data. This data was obtained from 48 BC patients and 57 healthy individuals samples. We found that miRNAs are differentially expressed in both datasets by multiple testing across the contrast method [Supplementary Table S5].
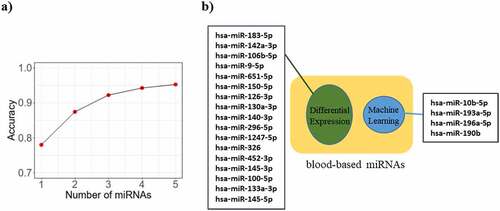
The second list contained miRNAs found by feature selection methods in the miRNome data of BC and their corresponding normal tissues. While it was expected that the accuracy of BC detection increases with the number of miRNAs, the accuracy did not increase by applying more than 4 miRNAs. Therefore, a subset of four miRNAs (hsa-miR-10b-5p, has-miR-193a-5p, hsa-miR-190b, and hsa-miR-196a-5p) with the 95% accuracy was obtained (). Finally, 21 miRNAs (17 miRNA from the DE approach and 4 miRNAs from the ML approach) were selected to be experimentally evaluated based on their expression level in BC patients and NCs blood samples ().
Figure 3. Identification and accuracy assessment of the putative miRNAs as breast cancer biomarkers. a) The curve indicates the accuracy level of detection as increased by the number of miRNAs. While the accuracy of detection increases with the number of miRNAs, it shows a plateau pattern for 4 or more miRNAs. b) Machine learning (ML) method and differential expression (DE) approaches respectively predicted 4 and 17 miRNAs capable of differentiating breast cancer patients from normal individuals. All these miRNAs were differentially expressed in blood samples of breast cancer patients versus blood of healthy individuals, acquired by literature and microarray dataset
Quantitative profiling of candidate miRNAs in whole blood samples
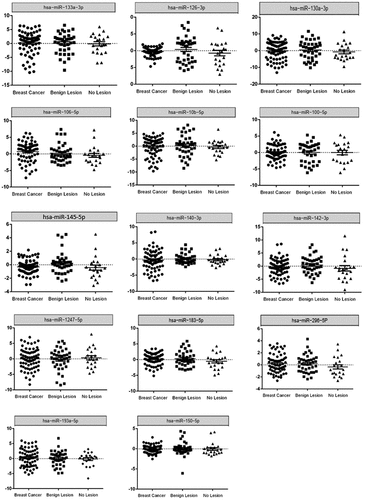
To validate the expression level of the 21 candidate miRNAs in clinical samples, qRT-PCR was performed on the blood samples of 70 BC patients and 60 NCs (consisting of 39 individuals with benign lesion and 21 individuals without lesion). Although preliminary data in microarray assay indicated an adequate expression level of all candidate miRNAs in blood samples, hsa-miR-9-5p and hsa-miR-452-5p were not detectable in the analysed samples. In addition, hsa-miR-651-5p, -miR-326, −196a-5p, −145-3p and −190b were detected at very low levels in blood samples. Results are therefore reported for the remaining 14 miRNAs.
The results of expression analysis revealed that as compared to individuals with no lesion or with benign lesion, there was no significant difference in fold change of hsa-miR-193-5p, −106b-5p, −140-3p, −10b-5p, −150-5p, −1247-5p, −130a-3p, −133a-3p, −183-5p, −142-3p, −296-5p, −100-5p, −126-3p and −145-5p in our ANOVA ().
Figure 4. Expression level of 14 miRNAs measured by qRT-PCR in BC patients (n = 70), Benign lesion patients (n = 39), and No lesion individuals (n = 21). P-values < 0.05 were considered as statistically significant results for one-way ANOVA test
Acceptable sensitivity and specificity of candidate miRNAs for early detection of breast cancer
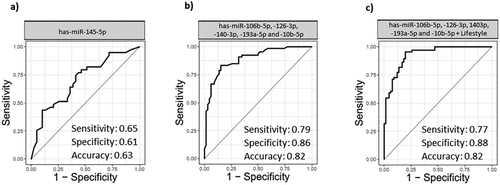
To evaluate the diagnostic capability of the studied miRNAs in the detection of BC, ROC curve analysis was performed. This analysis considers sensitivity and specificity as measures of biomarkers accuracy. The AUCs closer to one (100%) reflect greater substantial differences between BC and NC samples. ROC curve analysis revealed that the expression level of every single miRNA had low detection capability (Supplementary Figure S1). Among them, hsa-miR-145-5p with 0.65 sensitivity, 0.61 specificity, and 0.63 accuracy exhibited the highest performance value (). After initial ROC curve analysis, to enhance detection accuracy and provide a complete visualization of the relationships between various features and BC status, we conducted feature selection analysis among all attributes (lifestyle information and miRNAs expression). Moreover, five different machine learning algorithms (Random Forest, Naïve Bayes, Multilayer Perceptron, Zero R, and Logistic Regression) were compared to choose the best algorithm which have higher performance values. Although Random Forest was better algorithm in three panels except one, we decided to perform Random Forest algorithm for all panels to have the same comparison model among them [Supplementary table S6]. Results showed that combination of five miRNAs (hsa-miR-106b-5p, −126-3p, −140-3p, −193a-5p and −10b-5p) yielded a higher AUC and enhanced sensitivity and specificity in comparison with a single miRNA (sensitivity = 0.79, specificity = 0.86, and accuracy = 0.82) (). Combination of the expression level of miRNAs mentioned above, with lifestyle information showed sensitivity, specificity, and accuracy values of 0.77, 0.88, and 0.82, respectively (). The AUC analysis showed that the combination of miRNAs and the lifestyle information has a superior accuracy.
Figure 5. Receiver operative characteristic (ROC) and area under curve (AUC). a) ROC curve with single miRNA (hsa-miR-145-5p) in BC group and NC group. b) ROC curve of combination of miRNAs (hsa-miR-106b-5p, −126-3p, −140-3p-193a-5p and −10b-5p) in BC group and NC group. c) ROC curve of miRNAs (hsa-miR-106b-5p, −126-3p, −140-3p-193a-5p and −10b-5p) with demographic information of the patients (Age, marriage status, pregnancy status, number of children, breast feeding history, age of first menstruation, menopause status, familiar history of cancer, personal history of breast and uterine disease and smoking. BC (n = 70) and NC (n = 60)
Identification of a multi-marker panel for the detection of benign breast disease
In addition to BC detection, the selected signature had the potential to discriminate benign breast disease (BBD) patients from BC ones. For this purpose, the expression levels of miRNAs were analysed in BBD and BC patients. The feature selection algorithm elicited hsa-miR-10b-5p as a miRNA with the most discriminative potential between the two groups (accuracy = 0.69). ROC curve analysis showed that our defined signature (consisted of hsa-miR-106b-5p, −126-3p, −140-3p, −193a-5p and −10b-5p) could detect BBD individuals from BC ones with a performance value of 0.67 sensitivity, 0.80 specificity and 0.74 accuracy (Supplementary Figure S2).
miRNAs targeting essential genes in the PI3K/AKT signalling pathway
Based on Random Forest classification results, five miRNAs (hsa-miR-106b-5p, −126-3p, −140-3p, −193a-5p and −10b-5p) were selected for pathway analysis. We focused on KEGG, WikiPathways, and Reactome in the miRPath database. Only the target genes with experimentally strong evidence that are involved in at least three miRNA pathways, were considered. By applying these criteria, no target gene was found for hsa-miR-140-3p. Moreover, various common pathways had been altered by the other four candidate miRNAs. Among them, the PI3K/AKT signalling pathway was significantly highlighted in all three databases (Supplementary Figure S3).
Discussion
During the last decades, molecular biomarkers have been proven as influential players in the early detection of diseases and patients management [Citation17,Citation20,Citation21,Citation22,Citation23]. However, there is still a lack of sensitive and specific biomarker for cancer detection at early stages. Different biological fluids have been explored to find reliable biomarkers for cancer diagnosis, prognosis, and prediction status. Among all biomarkers, the miRNAs circulating in the blood system are of great importance [Citation24]. Blood-based miRNAs could be regarded as practicable biomarkers as they are found in a stable form in blood and could be preserved from endogenous RNase enzyme activity. Thus, they have particular advantages over other molecules in clinical practice [Citation9].
Biomarker discovery in the blood is divided into three different types of samples such as serum, plasma, and whole blood. Although past research has reported some concerns with using whole blood to measure miRNA, as the red blood cells might affect the miRNA expression levels [Citation25], using whole blood has some advantages. Previous reports have suggested that serum/plasma preparation methods affect the yield of total RNA [Citation26]. Moreover, most of the RNA in whole blood releases from blood cells which reflects the RNA of white blood cells in the research. Former researches have reported a difference in the immunity status of healthy individuals and patients with malignant lesions. For instance, T-lymphocytes in tumour patients are functionally defective and fail to control the disease [Citation27].
It is essential to know that the overall expression pattern of each immune cell type showed considerable closeness between patients and controls. However, for each immune cell, Petra Leidinger et al. identified miRNAs that were deregulated in lung cancer patients, including hsa-miR-21 that was up-regulated in all immune cell comparisons of cancer versus controls. Their research also indicates the miRNome of the adaptive immune cells showed weak discriminative potential between patients and controls; however, cells of the innate immune system offer accurate classification. Moreover, the cancer-specific miRNA expression pattern of whole blood samples is determined by all cell types [Citation28]. The data reveal that erythrocytes, platelets, or exosomes might play an essential role in the disease specificity of a miRNA signature [Citation28,Citation29]. To maintain RNA stability and capture possible clues from taken blood, we directly used the whole blood to achieve a higher miRNA level.
With recent efforts, miRNAs application in cancer detection and therapy is not far from reach. However, in addition to the clinical information about miRNAs (e.g. their expression profile), fundamental knowledge about the biology of miRNAs (e.g. their mechanism(s) of action) must be expanded to transfer their bench-based applications into clinical application. It has been shown that the expression profile of a single miRNA does not have a consistent diagnostic potential in BC [Citation30], so combining a set of miRNAs in a multi-marker panel may elevate the precision of miRNA-based diagnostic tests in human cancers.
In this study, we aimed to introduce a multi-marker panel consisting of several blood-based miRNAs for discrimination of NC and BBD from BC patients. One of the most important aspects of this approach is providing a minimally-invasive and affordable clinical test that could be applied as an auxiliary test for early detection of BC with high accuracy, even in asymptotic individuals.
Several detection approaches such as massively parallel sequencing and qRT-PCR could help in evaluation of deregulated miRNAs in different diseases, including BC. While these methods have some limitations in accurate detection of cancers and there are controversies about their results [Citation31], in the current study, we took advantage of some other complementary approaches (e.g. bioinformatics analysis) to eliminate probable errors.
Besides the advantages of bioinformatics, blood samples were safely collected using PAXGene blood RNA tubes, which preserve the expression profile of the genes (including miRNAs) during the sampling process [Citation32]. Besides, the data of TCGA tissues and blood miRNome data (GSE31309) were used to achieve accurate results. After selection of the most appropriate miRNAs for BC detection, the expression level of miRNAs was analysed by qRT-PCR in whole blood samples of BC patients and NCs.
Preceding progress in BC diagnosis showed that a panel of seven circulating miRNAs (miR-127-3p, miR-148b, miR-376a, miR-376 c, miR-409-3p, miR-652, and miR-801) have an AUC of 0.81 for detection of malignant breast tumours [Citation33]. Another study suggested that assessment using a combination of miR-145, miR-155, and miR-382 in serum has a performance value of 97.6% sensitivity, and 100% specificity among 61 BC patients and 10 healthy individuals [Citation34]. Furthermore, Zaleski et al. reported that a combination of circulating miR-34a with two crucial protein markers, carcinoembryonic antigen (CEA) or carbohydrate antigen 15–3 (CA 15–3), had AUCs of 0.844 and 0.800, respectively [Citation35]. Unfortunately, there is few evidence exploring the comparative potential of miRNAs in distinguishing BC from BBD. However, the reported panels are not reliable due to the small population size of the studies or lack of supportive results from independent cohorts, which pave the way for investigations on the BC research area.
In the current study, we could not find any significant difference in the expression pattern of the studied miRNAs among 70 BC patients, 21 individuals with no lesion, and 39 individuals with benign lesion. Since several studies have shown that a single miRNA has a low discriminative potential in BC diagnosis, we conducted a comprehensive analysis of the miRNA profile of BC cases in multiple publicly available datasets. Accordingly, ML analysis using the random forest algorithm was performed to boost the BC detection capability. We successfully developed a multi-marker panel of five miRNAs namely, hsa-miR-106b-5p, −126-3p, −140-3p, −193a-5p and −10b-5p, for BC detection with performance values of 0.79 sensitivity, 0.86 specificity and 0.82 accuracy. It is worth mentioning that our defined multi-marker panel could not only detect BC patients from normal ones but also discriminate BBD individuals from BCs with an acceptable performance value (sensitivity = 0.67, specificity = 0.80, and accuracy = 0.74).
To have a better understanding of the molecular mechanisms of the blood deregulated miRNA, enrichment analysis of their targets was considered. Thus, we performed miRNA enrichment analysis to realize whether our selected miRNAs (hsa-miR-106b-5p, −126-3p, −193a-5p, and −10b-5p) are enriched in a specific pathway. To this end, we applied a ‘custom heat map calculator’ in the miRPath database. According to this analysis, PI3K/AKT signalling pathway was highlighted by KEGG, WikiPathway, and Reactome databases. The PI3K/AKT is one of the most crucial signalling pathway in BC progression, which can accelerate migration and proliferation of cancerous cells. Activation of the PI3K-AKT pathway by mutations in PIK3CA and suppression of PTEN as molecular characteristics, has been detected in some subtypes of BC [Citation36]. In particular, hsa-miR-126-3p, hsa-miR-10b-5p and hsa-miR-193-5p are main regulator of PI3K gene in this pathway [Citation37,Citation38,Citation39]. There is also strong experimental evidence on the suppressive role of hsa-miR-106b-5p and hsa-miR-10b-5p on the PTEN, a protein that suppresses PI3K activation [Citation37,Citation40]. AKT1 as another modulator of PI3K/AKT signalling pathway, is directly targeted by hsa-miR-126-3p, and hsa-miR-10b-5p [Citation37,Citation38].
Since no target gene was found for hsa-miR-140-3p based on our criteria, we hypothesized that this miRNA might play a role in the progression of BC through influencing other pathways. Previous studies approved the tumour suppressive role of hsa-miR-140-3p in BC stem cells with SOX9 and ALDH1, two activating factors of stem-like cells, being direct targets of this miRNA. Moreover, hsa-miR-140-3p restoration by genetic engineering approaches could reduce tumour growth in vivo [Citation41]. Further, Wang et al. found a high correlation between down regulation of hsa-miR-126-3p and tumour grade or hormone expression in BC patients [Citation42]. Another study revealed that hsa-miR-126-3p strongly controls angiogenesis and vascular integrity in various models [Citation43].
In conclusion, the current study assessed a novel miRNA multi-marker panel involving blood-born and tissue-born miRNome data for detection of BC and BBD. Applying miRNA profile in cancer diagnosis is controversial. However, the combination of various data could provide a robust panel with enhanced accuracy rate. Importantly, the expression value of some miRNAs in this study was not similar to the initial analysed high-throughput data. As previous studies have shown there are some racial/ethnic differences for various biomarkers [Citation44,Citation45,Citation46,Citation47]. Based on this fact, this contradiction could probably to be linked to racial/ethnic differences of high-throughput and low-throughput data and the existence of genetic heterogeneity among populations. Although our panel could potentially detect early-stage breast cancer patients, conducting a large-scale comprehensive study is mandatory.
Supplemental Material
Download Zip (1.2 MB)Acknowledgments
We would appreciate all medical staffs and technicians at Royan Institute who agreed to participate in this study. Further, we would like to express our deep gratitude to Dr. Hamidreza Chitsaz, Dr. Safa Najafi, and Dr.Parisa Sahranavard for their generous support during this work and Cancer Charity for its financial support.
The results shown here are in part based upon data generated by the TCGA Research Network: https://www.cancer.gov/tcga.
Disclosure statement
The authors declare that they have no competing interests.
Data availability
The initial high-throughput datasets are available in The Cancer Genome Atlas (TCGA) and Gene Expression Omnibus (GEO) databases. Moreover, the experimental data are available as Supplementary Table S7. More information are available upon request to Marzieh Lashkari at [email protected] or Mehdi Totonchi at [email protected].
Supplementary material
Supplemental data for this article can be accessed here.
Additional information
Funding
Related Research Data
References
- Fitzmaurice C, Allen C, Barber RM, et al. Global, regional, and national cancer incidence, mortality, years of life lost, years lived with disability, and disability-adjusted life-years for 32 cancer groups, 1990 to 2015: a systematic analysis for the global burden of disease study. JAMA Oncol. 2016;388:1459–1544.
- Dent R, Trudeau M, Pritchard KI, et al. Triple-negative breast cancer: clinical features and patterns of recurrence. Clin Cancer Res. 2007;13(15):4429–4434.
- Lei J, Yang P, Zhang L, et al. Diagnostic accuracy of digital breast tomosynthesis versus digital mammography for benign and malignant lesions in breasts: a meta-analysis. Eur Radiol. 2014;24(3):595–602.
- Inoue K, Fry EA. Novel molecular markers for breast cancer. Biomark Cancer. 2016;8:BIC.S38394.
- Danova M, Delfanti S, Manzoni M, et al. Tissue and soluble biomarkers in breast cancer and their applications: ready to use?. JNCI Monogr. 2011;2011(43):75–78.
- Prat A, Perou CM. Deconstructing the molecular portraits of breast cancer. Mol Oncol. 2011;5(1):5–23.
- Harris L, Fritsche H, Mennel R, et al. American Society of Clinical Oncology 2007 update of recommendations for the use of tumor markers in breast cancer. Clin Oncol. 2007;25(33):5287–5312.
- Santangelo A, Tamanini A, Cabrini G, et al. Circulating microRNAs as emerging non-invasive biomarkers for gliomas. Ann Transl Med. 2017;5(13): 277-277.
- Mitchell PS, Parkin RK, Kroh EM, et al. Circulating microRNAs as stable blood-based markers for cancer detection. Proc Natl Acad Sci. 2008;105(30):10513–10518.
- Calin GA, Dumitru CD, Shimizu M, et al. Frequent deletions and down-regulation of micro-RNA genes miR15 and miR16 at 13q14 in chronic lymphocytic leukemia. Proc Natl Acad Sci U S A. 2002;99(24):15524–15529.
- Hébert SS, Horré K, Nicolaï L, et al. Loss of microRNA cluster miR-29a/b-1 in sporadic Alzheimer’s disease correlates with increased BACE1/beta-secretase expression. Proc Natl Acad Sci U S A. 2008;105(17):6415–6420.
- Paul P, Chakraborty A, Sarkar D, et al. Interplay between miRNAs and human diseases. J Cell Physiol. 2007;233(3):2007–2018.
- Negrini M, Ferracin M, Sabbioni S, et al. MicroRNAs in human cancer: from research to therapy. J Cell Sci. 2007;120(11):1833–1840.
- Fehlmann T, Kahraman M, Ludwig N, et al. Evaluating the use of circulating MicroRNA profiles for lung cancer detection in symptomatic patients. JAMA Oncol. 2020;6(5):714–723.
- Hamam R, Ali AM, Alsaleh KA, et al. microRNA expression profiling on individual breast cancer patients identifies novel panel of circulating microRNA for early detection. Sci Rep. 2016;6(1). DOI:10.1038/srep25997
- Wang K, Zhang S, Marzolf B, et al. Circulating microRNAs, potential biomarkers for drug-induced liver injury. Proc Natl Acad Sci U S A. 2009;106(11):4402–4407.
- Shen J, Todd NW, Zhang H, et al. Plasma microRNAs as potential biomarkers for non-small-cell lung cancer. Lab Invest. 2011;91(4):579–587.
- Wang G-K, Zhu J-Q, Zhang J-T, et al. Circulating microRNA: a novel potential biomarker for early diagnosis of acute myocardial infarction in humans. Eur Heart J. 2010;31(6):659–666.
- Livak K, Methods TS. undefined analysis of relative gene expression data using real-time quantitative PCR and the 2− ΔΔCT method. Elsevier; 2001;25(4):402–408.
- Cohen JD, Li L, Wang Y, et al. Detection and localization of surgically resectable cancers with a multi-analyte blood test. Science. 2018;3247:eaar3247.
- Vaidya VS, Ramirez V, Ichimura T, et al. Urinary kidney injury molecule-1: a sensitive quantitative biomarker for early detection of kidney tubular injury. Am J Physiol Physiol. 2006;290(2):F517–F529.
- Petricoin EF, Liotta LA. SELDI-TOF-based serum proteomic pattern diagnostics for early detection of cancer. Curr Opin Biotechnol. 2004;15(1):24–30.
- Hanash SM, Baik CS, Kallioniemi O. Emerging molecular biomarkers—blood-based strategies to detect and monitor cancer. Nat Rev Clin Oncol. 2011;8(3):142–150.
- Strissel PL, Schrauder MG, Strick R, et al. Circulating Micro-RNAs as potential blood-based markers for early stage breast cancer detection. 2012;7(1):e29770.
- Gyoba J, Shan S, Roa W, et al. Diagnosing lung cancers through examination of Micro-RNA biomarkers in blood, plasma, serum and sputum: a review and summary of current literature. Int J Mol Sci. 2016;17(494):494.
- Calderone HM, Westerhuis JJ, Winn ME, et al. Critical analysis of the potential for microRNA biomarkers in breast cancer management. 2015;7: 59–79.
- Baitsch L, Fuertes-Marraco SA, Legat A, et al. The three main stumbling blocks for anticancer T cells. Trends Immunol. 2012;33(7):364–372.
- Leidinger P, Backes C, Dahmke IN, et al. What makes a blood cell based miRNA expression pattern disease specific? - A miRNome analysis of blood cell subsets in lung cancer patients and healthy controls. Oncotarget. 2014;5(19):9484.
- Backes C, Meese E, Keller A. Specific miRNA disease biomarkers in blood, serum and plasma: challenges and prospects. Mol Diagnosis Ther. 2016;206(20):509–518.
- Adhami M, Haghdoost AA, Sadeghi B, et al. Candidate miRNAs in human breast cancer biomarkers: a systematic review. Breast Cancer. 2018;25(2):198–205.
- Git A, Dvinge H, Salmon-Divon M, et al. Systematic comparison of microarray profiling, real-time PCR, and next-generation sequencing technologies for measuring differential microRNA expression. RNA. 2010;16(5):991–1006.
- Backes C, Leidinger P, Altmann G, et al. Influence of next-generation sequencing and storage conditions on miRNA patterns generated from PAXgene blood. Anal Chem. 2015;87(17):8910–8916.
- Cuk K, Zucknick M, Madhavan D, et al. Plasma microRNA panel for minimally invasive detection of breast cancer. PLoS One. 2013;8(10):e76729.
- Mar-Aguilar F, Mendoza-Ramírez JA, Malagón-Santiago I, et al. Serum circulating microRNA profiling for identification of potential breast cancer biomarkers. Dis Markers. 2013;34(3):163–169.
- Zaleski M, Kobilay M, Schroeder L, et al. Improved sensitivity for detection of breast cancer by combination of miR-34a and tumor markers CA 15-3 or CEA. Oncotarget. 2018;9(32):22523–22536.
- Goncalves A, Sabatier R, Charafe-Jauffret E, et al. Triple-negative breast cancer: histoclinical and molecular features, therapeutic management and perspectives. Bull Cancer. 2013;100:453–464.
- Bahena‐Ocampo I, Espinosa M, Ceballos‐Cancino G, et al. miR-10b expression in breast cancer stem cells supports self-renewal through negative PTEN regulation and sustained AKT activation. EMBO Rep. 2016;17(5):648–658.
- Zhu N, Zhang D, Xie H, et al. Endothelial-specific intron-derived miR-126 is down-regulated in human breast cancer and targets both VEGFA and PIK3R2. Mol Cell Biochem. 2011;351(1–2):157–164.
- Zhang Y, Huang B, Wang HY, et al. Emerging role of MicroRNAs in mTOR signaling. Cell Mol Life Sci. 2017;74(14):2613–2625.
- Li N, Miao Y, Shan Y, et al. MiR-106b and miR-93 regulate cell progression by suppression of PTEN via PI3K/Akt pathway in breast cancer. Cell Death Dis. 2017;8(5):e2796.
- Li Q, Yao Y, Eades G, et al. Downregulation of miR-140 promotes cancer stem cell formation in basal-like early stage breast cancer. Oncogene. 2014;33(20):2589–2600.
- Wang F, Zheng Z, Guo J, et al. Correlation and quantitation of microRNA aberrant expression in tissues and sera from patients with breast tumor. Gynecol Oncol. 2010;119(3):586–593.
- Wang S, Aurora AB, Johnson BA, et al. The endothelial-specific MicroRNA miR-126 governs vascular integrity and angiogenesis. Dev Cell. 2008;15(2):261–271.
- Morimoto Y, Conroy S, Ollberding N. Ethnic differences in serum adipokine and C-reactive protein levels: the multiethnic cohort. Int J Obesity. 2014;38(11):1416–1422.
- Brown M, Feairheller D, Thakkar S, et al. Racial differences in tumor necrosis factor-α-induced endothelial microparticles and interleukin-6 production. Vasc Heal Risk Managem. 2011;7:541.
- Nazmi A, Victora CG. Socioeconomic and racial/ethnic differentials of C-reactive protein levels: a systematic review of population-based studies. BMC Public Health. 2007;7(1). DOI:10.1186/1471-2458-7-212
- Hu JJ, Urbanic JJ, Case LD, et al. journal of clinical oncology association between inflammatory Biomarker C-reactive protein and radiotherapy-induced early adverse skin reactions in a multiracial/ethnic breast cancer population. J Clin Oncol. 2018;36(24):2473–2482.