
ABSTRACT
Subcellular localization of transcripts is highly associated with regulation of gene expression, synthesis of protein, and also the development of the human brain cortex. Although many mechanisms are prevalent in the occurrence of neuroinflammation, the mechanisms based on differences in subcellular localization of transcripts have not been explored. To characterize the dynamic profile of nuclear and cytoplasmic transcripts during the progress of haemorrhage-induced neuroinflammation, we isolated nucleo-cytoplasmic RNA fractions of oxyhaemoglobin (oxy-Hb) treated microglia cells and sequenced both fractions. We discovered that cytoplasmic retained genes were the major forces to maintain the neuroinflammatory microenvironment with 10 hub genes and 40 conserved genes were identified. Moreover, antisense RNA Gm44096 and lincRNA Gm47270, which co-expressed with a crowd of inflammatory genes in the cytoplasm, were discovered as regulatory strategies for sustaining the neuroinflammatory microenvironment. Thus, our study provides a new perspective on understanding haemorrhage-induced neuroinflammation and also reveals a mechanism of lncRNA responsible for maintaining the neuroinflammatory microenvironment.
Background
The transport of RNAs between the nucleus and cytoplasm has been recognized as a crucial determinant of cellular fate both at physiologically and pathologically state. Previous studies have determined that nucleocytoplasmic transport transpires through very subtle and sophisticated mechanisms involving chromatin state, RNA processing, RNA export, and RNA stability [Citation1–3]. A growing number of researches have shown that RNAs exert different roles between the nucleus and cytoplasmic parts [Citation1,Citation4–6]. Abundant enrichment of nuclear transcripts have been identified in the central nervous system (CNS) involving in transcripts associated with the neurodevelopmental process and CNS disorders [Citation7,Citation8]. However, conventionally, a large number of studies focusing on gene expression using total RNA extracts were carried out, and therefore neglecting the contribution of nuclear RNAs in both neurodevelopmental process and CNS disorders [Citation9].
Haemorrhagic stroke is a subtype dreadful stroke with high mortality (of ~40% at 1 month), high disability, and low survival quality, leading to not only considerable suffering to patients but also an immense burden to their family and society [Citation10,Citation11]. There are compelling shreds of evidence providing an understanding of microglia and its role in haemorrhagic stroke as functionally predominant resident immune cell in the brain. With the onset of haemorrhage, microglia are immediately exposed to erythrocytes and its cellular components such as haemoglobin, thus undergoing complex pathological processes and inflammatory responses in this compartment is heavily regulated [Citation12]. The rapid change of transcriptional profile happened once microglia are activated, consequently, a large collection of inflammation-related transcripts that boost inflammatory cascade are produced namely tumour necrosis factor-alpha (TNF-α), interleukin-1 (Il1), and interleukin-6 (Il6) [Citation13–15]. Although the role of microglia in determining inflammation has been generally accepted, different contributions of subcellular components and concurrent RNA processing events remain elusive. This concern provides an incentive to discovery of transcriptional mechanisms underlying subcellular compartments regulating microglial functions.
The mammalian genome contains an extensive unexplored long noncoding RNAs (lncRNAs), some of which are functional. The existing research on lncRNA suggests their role in diverse cellular and disease process and their biomarker implications [Citation16–18]. Emerging studies have demonstrated the highly expressive features of lncRNAs in brain tissues [Citation19,Citation20]. Moreover, it has been studied that lncRNA H19 was abnormal expressed and promotes neuroinflammation by mediating histone deacetylases (HDACs) in an oxygen-glucose deprivation (OGD) model of microglia [Citation21]. However, the mechanism by which differentially subcellular localized lncRNAs in haemorrhagic stroke has not been established. Research into lncRNA-mRNA co-expression patterns could help explain some unsolved puzzles and disclose potential therapeutic targets. Therefore, we investigated the expression patterns of lncRNAs from both cytoplasmic and nuclear subcellular libraries.
Here, we focus on emergencies following haemorrhage, looking for evidence of microglial gene changes at the early stage of haemorrhage, and systematically depicted functional differential changing between nucleocytoplasmic parts of transcriptome results. In this study, we distinguished cytoplasmic retained genes out of total transcripts and identified their crucial function in maintaining the neuroinflammatory microenvironment during haemorrhage-induced neuroinflammation. Moreover, we also revealed co-expression patterns of antisense RNA Gm44096 and lincRNA Gm47270 with cytoplasmic mRNAs, which play a role in sustaining neuroinflammatory microenvironment.
Results
Efficient isolation of nuclear and cytoplasmic fractions from microglia
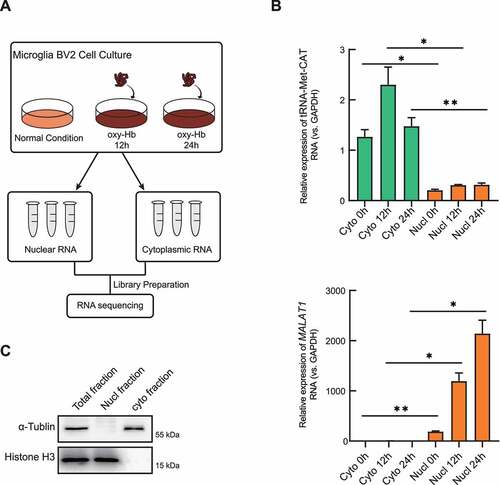
An optimized protocol for isolation of nuclear-cytoplasmic fractions from cultured cells has been performed in our research based on Keith T Gagnon et al. [Citation22]. (see methods for details). These optimizations have helped us in isolating the cellular components at the highest purity level. Oxy-Hb stimulation is widely-used for establishing haemorrhage-induced neuroinflammatory response in microglia [Citation17,Citation23,Citation24]. Mouse microglial cell line BV2 were cultured as controls (normal condition) or under conditions of 10 µM oxy-Hb stimulation (for 12 h and 24 h respectively), which were separated into nuclear and cytoplasmic fractions using our optimized isolation protocol ()). To identify the high purity of the separated fractions, DAPI (4ʹ,6-Diamidino-2-Phenylindole, Dihydrochloride) staining was firstly performed to verify the devoid of intact nuclei in cytoplasmic fractions and confirmed the integrity of the nuclei in nuclear fractions (Supplementary Figure. S1A). The lncRNA metastasis-associated lung adenocarcinoma transcript 1 (MALAT1) was identified to be predominantly in the nucleus and tRNA-Met-CAT and was confirmed to be a cytoplasm-enriched transfer RNA [Citation25]. As expected, MALAT1 transcripts were primarily detected in the nucleus and tRNA-Met-CAT in the cytoplasm by RT-qPCR assay respectively, which have successfully verified the accuracy of our methodology ()). Furthermore, performing Western blot using nuclear and cytoplasmic marker proteins (histone H3 or α-tubulin) also confirmed faction purity of the acquired samples (), Supplementary Figure S1B).
Figure 1. Successful isolation of nuclear and cytoplasmic fractions in vitro. (A) Workflow of the experimental design. Microglia BV2 cells were treated with oxyhaemoglobin (oxy-Hb) for 12 h (12 h) or 24 hours (24 h). Nuclear and cytoplasmic RNA fractions were extracted and submitted to RNA sequencing after the library preparation. (B) Cytoplasm-enriched tRNA (tRNA-Met-CAT) and nuclear-enriched lncRNA (MALAT1) mRNA expression detected by reverse transcriptase quantitative real-time PCR (RT-qPCR) (n = 3). (C) Total, nuclear, and cytoplasmic fractions were employed and identified by Western blotting using nuclear (histone H3) and cytoplasmic (α-tubulin) protein markers. Purified cellular fractions were enriched exclusively in nuclear or cytoplasmic marker. RT-qPCR results were normalized using housekeeping gene GAPDH and fold change of each gene in 12 h or 24 h treated group was calculated with untreated control (ctl) group by the (2−ΔΔCt) method (n = 3). Error bars represent mean ± SEM of N ≥ 3 independent experiments (biological replicates) and P-values are calculated by unpaired t-test with Welch’s correction. *P < 0.05, ** P < 0.01, and ***P < 0.001
Subcellular regulatory heterogeneity of haemorrhage-induced neuroinflammatory response
Having established the subcellular fractionation procedure, we intended to illustrate the relationship between phenotypic differences and subcellular localization of pro-inflammatory marker genes during the progress of haemorrhage-induced neuroinflammation. First, the cell viability of microglia was gradually decreased from 12 h to 48 h during the effect of extracellular haemoglobin stimulation compared with the control group ()). Next, the production of NO was dramatically increased in the oxy-Hb-treated group and peaked at 12 h time point that corresponded to the cell viability ()). Taking together, these data indicated that haemoglobin induced cytotoxicity and activation of microglia in the early progress of haemorrhage-induced neuroinflammation which decreased over time.
Figure 2. Haemoglobin mediated cytotoxicity, NO production and neuroinflammation cytokine production. (A) Cell viability in the process of neuroinflammtion was tested by MTT assay. Microglia BV2 cells were treated with oxyhaemoglobin (oxy-Hb) for 12 hours (12 h), 24 hours (24 h) or 48 hours(48 h). Result was calculated with untreated control (ctl) group and presented as mean ± SEM (n = 4). (B) Production of nitric oxide (NO) was measured. Result was calculated with untreated control (ctl) group and normalized with cell number (n = 3). (C, D, E) RT-qPCR detection of Il1β, Il6, and TNF-α mRNA expression levels in subcellular fractions of microglia in response to 12 h or 24 h of oxy-Hb treatment were measured. RT-qPCR results were normalized using housekeeping gene GAPDH and the fold change in each gene in 12 h or 24 h treated group was calculated with untreated control (ctl) group by the (2−ΔΔCt) method (n = 3). Error bars represent mean ± SEM of N = 3 independent experiments (biological replicates) and P-values are calculated by unpaired two-tail t-test with Welch’s correction. *P < 0.05, ** P < 0.01, and ***P < 0.001
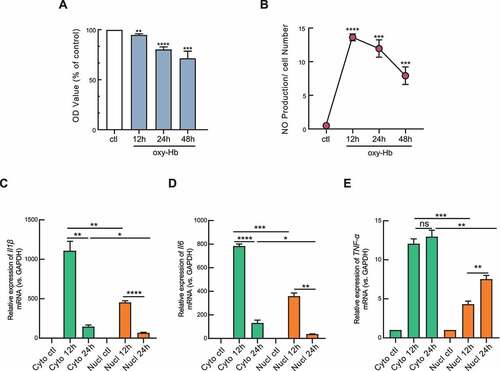
Given regulating neuroinflammation as a primary role of microglia in many CNS disorders, we turned to detect the expression of pro-inflammatory genes in total, cytoplasmic, and nuclear fractions. The total mRNA expression level of classical pro-inflammatory marker genes (e.g. TNF-α, Il1β, Il6, and CD16) were dramatically increased over time after haemoglobin stimulating, while anti-inflammation markers (e.g. CD206, arg1) were remarkably decreased, which is indicative of the accuracy of our neuroinflammation model (Supplementary Figure S2). However, only the fold change of TNF-α in the nucleus was up-regulated compared with control over the time as nuclear and cytoplasmic RNA fractions were considered separately. In contrast, no significant difference was identified in the cytoplasm over time (P < 0.05). This suggests that TNF-α transcripts in the nucleus play a major role in promoting the development of neuroinflammation. Notably, we found that the fold change of mRNA expression of Il1β and Il6 in the cytoplasm was significantly higher than that in the nucleus regardless of different time points, which hardly be revealed from their expression pattern in total RNA ()). Together, we suspected that TNF-α likely regulates the nuclear process, and Il1β or Il6 was responsible for the cytoplasmic process in haemorrhage-induced neuroinflammatory response. Overall, our results link neuroinflammatory phenotypes with the subcellular localization of pro-inflammatory transcripts, which have been overlooked in total RNA analysis, and summarized their regulatory heterogeneity of haemorrhage-induced neuroinflammatory response.
Dynamic characters of subcellular transcriptional profile in haemorrhage-induced neuroinflammation progress
Microglia were cultured in either normal conditions (control) or oxy-Hb stimulated conditions (for 12 h and 24 h) and subcellular RNA fractions were used to construct RNA-seq libraries (n = 3) ()). 723 million clean reads were generated in total, and library size, repeatability, and quality have been confirmed to be comparable and reproducible between samples (Supplementary Figure 3(a-c)). Interestingly, libraries have been separated by subcellular location through Principal Component Analysis (PCA) based on the gene expression value (Supplementary Figure 3(d)).
Significant differentially expressed genes (DEGs) were identified using DESeq226, and the nuclear and cytoplasmic enriched genes were determined by these DEGs of nuclear libraries compared with cytoplasmic libraries. By a rigorous threshold (|log2FC| > 1 & FDR < 0.05), 9336 genes, on average, were determined as DEGs (11,850, 8424, and 7734 for control, 12 h and 24 h of oxy-Hb stimulation respectively) and then visualized by volcano plots and cluster heatmap (; Supplementary Figure S4A, B, C). The number of DEGs also decreased with the progression of neuroinflammation, suggesting a more balanced gene expression between the nucleus and cytoplasm. It is worth to note that DEGs of 12 h oxy-Hb stimulation, regardless of nucleus or cytoplasm, was more than that in 24 h, indicating more sensitivity in response to haemorrhage-induced neuroinflammation in the early stage (Supplementary Figure S4A). Briefly, 3162 (37.54%) cytoplasm and 5262 (62.46%) nucleus enriched genes have been determined in the condition of 12 h oxy-Hb stimulation, indicating the importance of the nucleus enriched genes in early neuroinflammatory processes ()).
Figure 3. Distinct gene expression patterns of subcellular fractions. (A) Volcano Plot for DEGs of microglia subcellular fractions exposed to 12 h of 10 μM oxy-Hb. Scattered points represent genes: the x-axis corresponds to the log2 fold change, whereas the y-axis displays the mean expression value of log10 (q-value). Red dots represent up-regulated expressed genes; blue dots represent genes whose expression down-regulated. (B) Gene Ontology (GO) biological process (BP) enrichment of subcellular DEGs in microglia treated with 10 μM oxy-Hb for 12 h. (C) Annotation (left) and detailed percentage (right) of nuclear (nucl-) or cytoplasmic (cyto-) enriched DEGs. (D) Lengths distribution of nuclear or cytoplasmic enriched genes. (E) Annotation of 0–10k, 10–20k, 20–40k, and over 40k length genes. (F) Heatmap shows the expression pattern of all DEGs in each sample, the expression values were coloured in reference to z-scores transformed from transcripts per million (TPM)
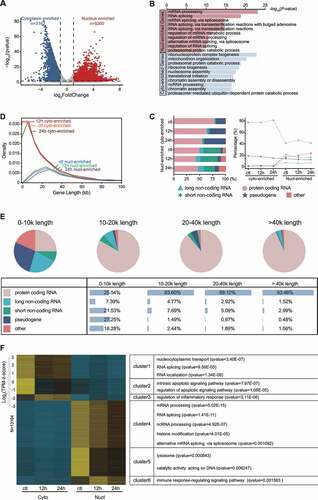
Further analysis in Gene Ontology (GO) revealed that cytoplasm-enriched genes were readily involved in ribonucleoprotein complex biogenesis (P = 1.56E-23) and mitochondrion organization (P = 4.49E-19), suggesting these genes mainly mediated post-transcriptional control mechanisms in the cytoplasm through the mature mRNA-protein complex, which can regulate the activity of mature mRNAs [Citation26]. However, nuclear enriched genes were significantly enriched in the biological process of mRNA processing (P = 7.89E-24) and mRNA splicing (P = 1.59E-19) ()), while cytoplasmic enriched genes were chiefly concentrates at rRNA processing GO terms, such as ribonucleoprotein complex biogenesis (P = 1.56E-23) and ribosome biogenesis (P = 4.49E-19), indicating the occurrence of mRNA processing was closely related to in nuclear enriched genes and rRNA processing was mainly related to cytoplasm in early stage of neuroinflammation. Also, by comparing the gene classification, we found that the basic characteristics of the transcriptional distribution of nucleus and cytoplasm enriched genes fluctuated greatly with the progress of haemorrhage-induced neuroinflammation. Succinctly, the majority of enriched genes in both compartments were protein-coding genes (41.06%–81.17%), but more in the cytoplasm, which is consistent with a previous study (P < 0.0001) [Citation27]; while a higher percentage of short non-coding RNA (sncRNA) and long non-coding RNA (lncRNA) was detected in the nucleus than those in the cytoplasm (17.81% vs 1.62% of sncRNA and 6.54% vs 1.61% of lncRNA in an average of three-time points) ()). Furthermore, there were differences in length between genes enriched in the nucleus and cytoplasm, which again confirmed that genes enriched in the nucleus played an important role in the occurrence of neuroinflammation, especially in the early stage (), Supplementary Figure 5A). The findings of more long-length genes and intronic sequences (Supplementary Figure S5B) in the nucleus than those in the cytoplasm were consistent with previous research of more pre-mRNA in the nucleus than cytoplasm [Citation28,Citation29]. Interestingly, it was obvious that protein-coding genes tend to be proportionally superior as the increase of gene length within the range of 0–10 kb (25.54%), 10–20 kb (83.6%), 20–40 kb (89.12%), and >40 kb (93.46%) in nucleus enriched genes under the condition of 12 h oxy-Hb stimulation ()). Additionally, we also found under the same conditions that the longer the gene length, the larger proportion of exon number distribution (Supplementary Figure S5C). For example, the genes of 10–20 kb had exons with a median of 17 (less than 20–40kb’s and over 40kb’s), and their functional pathway was also very prominent in RNA splicing, indicating a greater likelihood of splicing events (Supplementary Figure 5D).
Finally, to characterize the dynamic expression profile during the haemorrhage-induced neuroinflammation progression, we visualized all 13,164 DEGs (subcellular specifically enriched genes) by k-means clustering into six clusters ()). After summarization of the GO enrichment analysis results, we found that cytoplasm enriched genes significantly associated with inflammation-related terms (Cluster 1, 2, and 3), whereas nucleus enriched genes mainly played roles in mRNA-related functions, such as ‘mRNA processing’, ‘RNA splicing’, and ‘histone modification’ (cluster 4). It is worth noting that nucleus enriched genes also performed the functions of the lysosome (cluster 5) and ‘immune response-regulating signaling pathway’ (cluster 6) ()). These findings indicated that the subcellular distribution of mRNAs in cellular components may be necessary for functions required by the progress of cellular response to neuroinflammation.
Cytoplasm retained genes are required for maintaining the neuroinflammatory microenvironment during haemorrhage-induced neuroinflammation
Given that the cytoplasm specifically enriched genes were mainly involved in inflammatory response-related pathways ()), we have conducted a more detailed analysis to illustrate the mechanism of subcellular localization of mRNAs on the microglia-mediated inflammatory response by haemoglobin stimulation, which can represent, to some extent, the haemorrhage-induced neuroinflammation. When compared with the time points of the same libraries, 195 (59.09%) and 521 (65.8%) overlapping DEGs (compared with control) were determined in cytoplasm and nucleus, respectively (here defined as cytoplasm retained genes and nucleus retained genes), which were both mainly exerted functions of the immune system process, inflammatory response and external stimulus, which again confirmed our hypothesis (Supplementary Figure S6A, B, C). To clarify the subcellular regulation mechanism during the process of haemorrhage-induced neuroinflammation, the protein–protein interaction (PPI) network analysis for these retained genes indicated a total of 156 (in the cytoplasm) and 347 (in the nucleus) were neuroinflammation-related genes (Supplementary Table 2). Briefly, 71.79% and 80% of the nuclear and cytoplasmic retained genes belong to the neuroinflammation network genes ()).
Figure 4. Differentially expressed genes were in closely relevant to the inflammatory response. (A) Percentage of genes forming neuroinflammation network from subcellular-retained DEGs in microglia exposed to 10 μM oxy-Hb stimulation for the indicated time. (B) Heatmap showing the log10(Counts) for enriched GO terms of down-regulated genes in the comparisons of different subcellular localization and time course. The colour intensity indicates the enrichment level of each GO term. (C) Protein–protein interaction (PPI) network analysis of inflammation-related genes. 254 inflammation-related genes were performed PPI network analysis using the STRING database. The top 10 hub genes were identified and ranked by the maximal clique centrality (MCC) method. (D) GO enrichment analysis of top 10 hub genes in (C) using ClueGO plugin in Cytoscape software, each node represents a statistically significant GO term (P < 0.05). The edge between the nodes shows overlapping genes. (E, F) Expression patterns of genes in the RNA-seq (left) and RT-qPCR (right) data in the subcellular components. Figure (E) shows samples collected from the cytoplasm and (F) from the nucleus. RNA-seq data were normalized with TPM and relative expression levels of RT-qPCR were normalized to GAPDH with three biological replicates
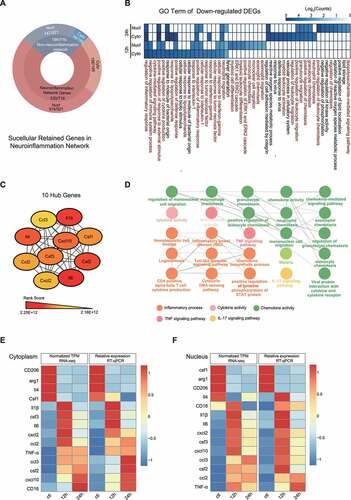
To inquire into the mechanism of maintaining the inflammatory microenvironment, we integrated the GO terms of nucleus and cytoplasm enriched genes and found that the cytoplasm retained genes were the main force to maintain the stability of the neuroinflammatory microenvironment not the nucleus enriched genes (), Supplementary Figure S7A). To explore the biological interplay among these inflammation-related genes, we used the PPI network based on the STRING online database and identified a total of 231 nodes with 1681 edges (PPI enrichment P < 1.0E-16) (Supplementary Figure S7B). Further, sub-network analysis of all nodes by Molecular Complex Detection (MCODE) and cytoHubba plugin in Cytoscape software, we identified top 2 ranked clusters (Supplementary SFigure 7 C, D) and 10 hub genes among inflammation-related genes: ccl3, Il1b, Il4, ccl2, cxcl2, Il6, csf2, csf1, cxcl10, and csf3 (), Supplementary STable 3). Next, ClueGO analysis revealed that these hub genes are associated with the TLR-TNF signalling pathway (TNF signalling pathway, P = 1.02E-14; Toll-like receptor signalling pathway, P = 8.38E-08), the IL-17 signalling pathway (IL-17 signalling pathway, P = 3.12E-18), the immune system (granulocyte chemotaxis, P = 2.63E-14) and the cytokine production (cytokine activity, P = 2.09E-20) ()). Differential distribution pattern of 10 hub genes and other inflammatory genes was confirmed by RT-qPCR, most genes show the consistency of expression patterns between RNA-seq and RT-qPCR, except Il4 in nucleus. (, Supplementary Figure 8A, B). Thus, our results illustrate that the cytoplasm retained genes are required for the neuroinflammatory microenvironment during haemorrhage-induced neuroinflammation.
Conserved genes in maintaining neuroinflammatory microenvironment in response to haemorrhage-induced inflammation
We depicted overlapping and the intersection between DEGs in all potential comparisons and found that 40 genes with an interaction between fractions and time course. Out of which 27 genes have been published in the field of inflammatory responses and were confirmed by our GO enrichment analysis, which provides significant statistical values (, Supplementary Table 4). Given the numerical superiority of these 40 interaction genes in GO results, we hypothesized that cytokine-related inflammatory response is the main pathology process underlying haemoglobin toxicity and involving subcellular transcripts localization. PPI network further visualized the correlation of inflammation-related interaction genes based on the STRING database and also emphasized the significant status of the inflammatory microenvironment in the progress of haemorrhage-induced inflammatory response (Supplementary Figure S9A).
Figure 5. Conserved DEGs were primarily contributed to inflammation. (A) Venn diagram displaying common or uniquely DEGs under seven comparisons ‘ctl (nucl vs cyto)’, ‘12 h (nucl vs cyto)’, ‘24 h (nucl vs cyto)’, ‘Nucl (ctl vs 12 h)’, ‘Nuc (ctl vs 24 h)’, ‘Cyto (ctl vs 12 h)’, and ‘Cyto (ctl vs 12 h)’. Nucl and Cyto represent the subcellular localization. Ctl, 12 h and 24 h represent the normal condition, 12 h or 24 h of oxy-hb treatment respectively. The grey arrow points to pie chart where 40 conserved genes whose expression varied in both fractions and time course is divided into non-coding genes (7/40), inflammation-related genes (27/40) and inflammation-unrelated genes (6/40). (B) Top 10 GO biological process enrichment for 40 conserved genes in (A). (C) Heatmap displaying pairwise correlation values of 40 conserved genes, in which red represents a positive correlation for a given gene pair and blue represents a negative correlation. (D) Length distribution of interaction genes. (E) Gene annotation of 40 conserved genes. (F) The t-distributed stochastic neighbour embedding (t-sne) analysis of 40 conserved genes
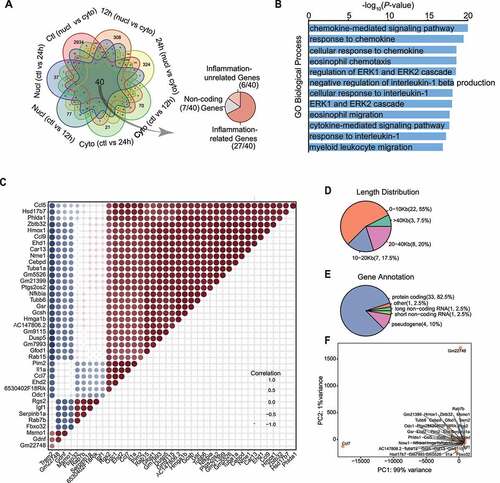
Also, these 40 genes were highly co-expressed with each other such as the chemokine (C-C motif) ligand 5 (ccl5) presented a positive correlation with 30 other genes (e.g. nfkbia, ccl7, Il1α, and hmox1) and trem2 expressed a negative correlation with others (e.g. nfkbia, ccl7, Il1α, and hmox1), indicating they form an inflammation regulatory network with each other to maintaining neuroinflammatory microenvironment ()). Furthermore, the cytoplasmic mRNA expression of ccl5 increased in 12 h, going against the tendency for the decline of trem2 in the nucleus (Supplementary Figure S9B), which indicates an antagonistic action between them. Consistent with previous conclusions, the majority of these 40 interacting genes were with shorter length (0–10 kb and 10–20 kb) occupied a percentage of 55 and 17.5, respectively ()). On the other hand, 33 out of 40 genes were protein-coding genes (accounting for 82.5%) ()). The similarity of these 40 interacting genes was also tested by PCA analysis. PC1 accounted for 99% of the total variance and PC2 for 1% of the variance in the PCA plot, which displayed only three isolated parts of interaction genes. This signifies consistency of expression in these 40 conserved genes ()).
lncRNAs are called for maintaining neuroinflammatory microenvironment
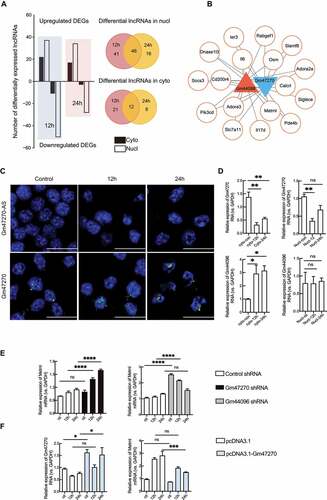
To investigate the role of differential subcellular localized lncRNAs in neuroinflammation, we analysed the correlation of expression patterns between lncRNAs and mRNAs during neuroinflammation processing. Among lncRNAs and mRNAs studied based on RNA-seq data, the number of altered RNAs showed a decrease tendency as time passed. In general, lncRNAs were more abundant in the nuclear components. Numbers of nuclear lncRNAs were 87 in 12 h and 62 in 24 h, while the numbers of lncRNAs in the cytoplasm were 33 and 20 in the 12 h and 24 h ()). On the other hand, the numbers of significantly upregulated lncRNAs in the nucleus at the 12 h and 24 h were 37 and 34, and numbers of significantly reduced lncRNAs were 50 and 28. The significantly altered lncRNAs in the cytoplasm were 33 lncRNAs in 12 h (22 up-regulated and 11 down-regulated) and 20 in 24 h (17 elevated and 3 repressed) ()). Among these lncRNAs, the intergenic lncRNA subfamily showed the sharpest increment or decrement in both subcellular fractions at every time point (Supplementary Figure S10A). The entire lncRNA expression levels from all the study groups are illustrated in Supplementary Table6.
Figure 6. Co-expression network of lncRNAs and mRNAs. (A) Total number of differentially expressed lncRNAs detected by RNA-seq. (B) Co-expression pattern of Gm44096 and Gm47270. Each mRNA is represented by a circle, and lncRNA by a triangle. Up-regulated lncRNA is labelled with red while down-regulated with blue. (C) RT-qPCR detection of Gm47270 and Gm44096 in the cytoplasmic (Cyto) and nuclear (Nucl) fractions of microglia in response to oxy-Hb (12 h or 24 h). (D) Fluorescence in situ hybridization (FISH) using probes against lncRNA Gm47270 (Green) in microglia exposed to 10 μM oxy-Hb for the indicated time. Negative controls in the first column for each target mRNA, hybridized with lncRNA Gm47270 antisense probes (Gm47270-AS), revealed no signal. The nucleus was stained with DAPI. Scale bar, 20 μm. (E) RT-qPCR detection of Metrnl mRNA in microglia transfected with Gm47270 shRNA (left) and Gm44096 shRNA (right). Microglia were treated with 10 μM Oxy-Hb for indicating time. (F) RT-qPCR detection of Gm47270 lncRNA and Metrnl mRNA in microglia overexpressing Gm47270. Microglia were treated with 10 μM Oxy-Hb for indicated time. RT-qPCR results were normalized using housekeeping gene GAPDH and the fold change in each gene in 12 h and 24 h treated groups was calculated with respect to untreated control (ctl) group by the (2−ΔΔCt) method (n = 3). Error bars represent mean ± SEM of N = 3 independent experiments (biological replicates) and P-values are calculated by unpaired two-tail t-test. *P < 0.05, ** P < 0.01, and ***P < 0.001
Pearson correlation analysis showed co-expression patterns of lncRNAs and mRNAs in which lncRNAs are associated with the most abundant mRNAs. Among them, Gm14275, B930036N10Rik, Gm44096, and Gm47270 were differential expressed in cytoplasm after 12 h of neuroinflammation, while 4933432I03Rik was up-regulated in 24 h (Supplementary Figure 10E). No similar phenomenon was found in the nucleus.
Surprisingly, many protein coding genes, which are enriched in the ‘regulation of inflammatory response’ GO term, have shown a strong correlation with Gm44096 and Gm472709 (Supplementary Figure S10B, C). Gm44096 is an antisense RNA consisting of 504 base pairs and located in chromosome 6 nearby the c1rl gene, which codes Complement C1r subcomponent-like protein (C1r-LP); while Gm47270 is a lincRNA located in chromosome 9 with 791 base pairs neighbouring the spg21 gene encoding ACP33 protein (Supplementary Figure S10E). Using co-expression analysis, gene networks were constructed that pointed to key nodal lincRNAs Gm44096 and Gm47270, which contains 17 proteins co-expressed ()). According to our RNA-seq data, the heatmap of these differentially expressed lncRNAs and mRNAs at each time point revealed the relevance of lncRNA-mRNA in expression patterns (Supplementary Figure 10D). RT-qPCR of nuclear and cytoplasmic fractions revealed that Gm44096 is remarkably up-regulated and Gm47270 down-regulated in the cytoplasm at 12 h after oxy-Hb treatment ()), in combination with RNA fluorescent in situ hybridization (FISH) ()). To discern possible lncRNA-mRNA interaction modes, loss-of-function and gain-of-function experiments were performed. First, we interfered with the expression of lncRNA Gm47270 and Gm44096 using lentivirus shRNA knockdown vector system. Gm47270 and Gm44096 knock down resulted in significant changes in Il6, Cd200r4, Ler3, Calcrl, Osm, and Adora3 with a similar expression pattern in response to oxy-Hb, whereas Siglece and Socs3 were unaffected (Supplementary Figure S11A, B). Interesting, we found a reverse interaction of Metrnl with these lncRNAs. Expression of Metrnl upon oxy-Hb stimulation was elevated by Gm47270 knockdown, whereas attenuated by Gm44096 knockdown ()). Meanwhile, overexpression of lncRNA Gm47270 had an opposite effect on Metrnl mRNA expression ()). Moreover, Gm47270 overexpression led to down-regulation of Osm, Socs3, Adora3 and Calcrl3 mRNA expression (Supplementary SFigure 11 C). Here, we confirmed Metrnl, an important inflammation mediator, showing a positive relevance to Gm47270 and a negative relevance to Gm44096. Taken together, we identified a batch of protein coding genes co-expressing with lncRNA Gm47270 and Gm44096. These findings could imply that mRNA cellular fractional distribution is closely related to co-expressed lncRNAs.
Discussion
Next-generation RNA sequencing has empowered the analysis of differentially expressed genes at the transcriptional level [Citation30]. However, whole transcriptome analysis using total RNA extracts may swamp the information of gene regulation and expression related to subcellular localization. Our study, which focused on accounting for the role of nucleocytoplasmic components on the progress of haemorrhage-induced inflammation, identified firstly that subcellular localization of transcripts is essential to maintain the haemorrhage-induced neuroinflammation microenvironment.
Neuroinflammation, which accounts for the dominant pathological change in microglia, is not only over disease progression but also across subcellular localization. Given the numerical superiority of DEGs at an early stage of neuroinflammation in our study, one rational conjecture is that genes mentioned above play a primary role in regulating the progress of haemorrhage-induced inflammation. Our implication, which we obtained through these results is the case that, cytoplasm enriched genes at the early stage of the condition might sense the primary signals of neuroinflammatory response, and thus creating an inflammatory microenvironment in response to a range of external stimuli. Besides, haemoglobin stimulation from the cerebral haemorrhage may be a persistent process, the early expressed inflammation-related transcripts will be selectively retained in the nucleus or cytoplasm to unceasingly maintain the inflammatory microenvironment.
Interestingly, in line with preceding studies revealing LPS-induced activated microglia accompanied by reducing histone deacetylation, which worsens inflammatory burden [Citation31], through our study we identified nuclear DEGs in the background of inflammatory microenvironment markedly enriched in the histone deacetylation process. Accumulated evidence suggests that histone deacetylases (HDACs) inhibition stimulates microglia towards its defensive phenotype, thus mitigating inflammatory response, which opens up a new avenue of intervening therapy based on epigenetic regulations [Citation32–34]. However, it is unclear whether HDACs' participation in the inflammatory response is through histone modification. A prior study has shown that histone deacetylase 6 (HDAC6) facilitated the assembly and activation of NLRP3 and pyrin inflammasomes by ubiquitylation, not by deacetylase activity, resulting in cytokine secretion and inflammatory response [Citation35]. Therefore, in future studies on the inflammatory microenvironment, more attention should be paid on epigenetic aspects.
This study also illustrates the lncRNA-mRNA co-expression pattern after haemorrhagic injury and found that the number of differentially expressed lncRNAs decreased as disease processing in which lincRNAs undergo the most dynamic expression turnover during neuroinflammation. The interaction analysis of these lncRNAs and mRNAs revealed an opposite expression pattern between antisense RNA Gm44096 and lincRNA Gm47270 and predicted that a bunch of mRNAs participating in the inflammatory response were co-expressed with Gm44096 and Gm47270 in the cytoplasm, suggesting a potential key role of the regulation lncRNA-mRNAs.
In recent years, researchers have believed that lncRNAs have a huge potential to develop into suitable diagnostic and prognostic biomarkers in various diseases, such as cancer and CNS diseases because they are detectable in body fluids and of excellent tissue specificity [Citation36,Citation37]. A study from AD patients reported that the expression of plasma lncRNA BACE1 in AD patients is much higher, with high specificity in AD, than that of healthy controls [Citation38]. Antisense lncRNA usually transcriptional or post-transcriptional, regulates its sense RNA and can be used as treatment strategies caused by inhibiting the expression of disease genes. KCNA2, potassium voltage-gated channel subfamily A member 2, is a key driver of neuropathic pain genesis [Citation39,Citation40]. The mRNA and protein levels of KCNA2 in dorsal root ganglion neurons are down-regulated by their antisense RNA KCNA2-AS in response to peripheral nerve injury. Elevated KCNA2-AS induced neuropathic pain symptoms after nerve injury, which can be relieved by blocking the expression of KCNA2-AS [Citation41]. Although the detailed mechanism is still unclear, KCNA2- AS shows a potential therapeutic target for treating neuropathic pain.
Many lncRNAs have the ability to regulate their neighbouring genes [Citation42]. In our results, Gm47270 in an intergenic lncRNA neighbouring spg21. Previous study showed that ACP33, a protein encoded by spg21, is located in the cytoplasm and suppresses the activation of CD4 T cell [Citation43]. So far, the evidence from this study suggests that Gm47270 is of great possibility for regulating immune response.
In our study, we demonstrated that Gm44096 positively and Gm47270 negatively regulate Metrnl mRNA expression. We also illustrated that expression of mRNAs belong to the inflammatory response GO terms including Cd200r4, Ler3, Calcrl, Osm, and Adora3 are susceptible to Gm47270 and Gm44096, which can hardly be explained by the paradigm. Therefore, instead of serving as effecters downstream of Gm47270 and GmA44096 directly, we suspect that these lncRNAs probably co-expressed with inflammation-related mRNAs through a mechanism of regulating subcellular distribution of transcripts.
Nonetheless, our study has several limitations mainly given the absence of experiments in vivo. Although normal conditions or oxy-Hb stimulation provide controlled environments for microglia in vitro testing, they cannot replicate the conditions that occur inside a living brain. Since lncRNA-mRNA co-expression pattern in microglia has been proved, underlying mechanism requires further studies to explore this new cellular regulation mode.
In conclusion, findings from this study broaden our understanding of the mechanisms of neuroinflammation by differences of subcellular transcripts localization, and for the first time introduce the concept of inflammatory microenvironment into the haemorrhage-induced inflammatory response study. We provide these data as a public resource and highlight the difference of nucleo-cytoplasmic RNAs function in the microglia to emphasize their potential importance to the understanding of neuroinflammation development. At present, we have little evidence on the characteristics of subcellular RNA expression of microglia. Thus, a future goal of the field should emphasize the function and epigenetic modification characteristics of specific subcellular RNAs of microglia, which will enable us to gain insight into the early neuroinflammatory process.
Materials and Methods
Cell culture
The mouse microglial cell-line BV2 was cultivated in Dulbecco’s Modified Eagle’s Medium (DMEM) (#C11995500BT, Gibco) containing 10% foetal bovine serum (FBS) (#04-001-IACS, Biological Industries) and 1% penicillin-streptomycin, and maintained under the normal environment with 37°C and 5% CO2. The experimental group of BV2 cells was treated with 10 μM oxy-Hb (#JP0200, Jinpin Chemical Technology Co., Ltd.) for 12 and 24 h, and the control group BV2 cells were cultivated in a 6-well plate and harvested during log-phase growth. Each group was cultivated in three biological replicates.
Cell Viability Assay
The 3-[4,5-dimethylthiazol-2-yl]-2,5-diphenyl tetrazolium bromide (MTT) assay was performed using an MTT detection kit (#C0009S, Beyotime) according to the manufacturer’s instruction to test cell viability. In brief, microglia were plated in a 96-well plate at 1 × 10⁵ cells/well and treated with 10 µM oxy-Hb. Next, 10 μL of MTT solution (5 mg/mL) was in addition to the cell culture medium and incubated at an incubator for another 4 h. The Formazan lysates (100 μL) were added and cultured for 4 h until formazan dissolved completely. The absorbance was measured at 570 nm using a microplate reader. The results of the treatments were given in a percentage of the control.
Nitric oxide (NO) Measurement
Microglia cell-line BV2 cells were seeded in 96-well plates at a density of 1 × 10⁵ cells/well and treated with 10 μM oxy-Hb for 12 and 24 h. Then the culture supernatants were collected and the concentration of NO was determined by a commercially available kit (#S0021S, Beyotime) according to the manufacturer’s instruction. In brief, each 50 μL of culture supernatant was reacted with an equal volume of Griess reagent. The absorbance was detected in a microplate reader at 540 nm, and a series of known concentrations of NaNO2 was utilized as a standard.
Extraction of nuclear and cytoplasmic RNA
The separation method of nuclear and cytoplasmic RNA was referred to as Keith T. Gognon et al. [Citation22] and optimized. The experimental and control BV2 were digested by trypsin (0.25%) without ethylenediaminetetraacetic acid (EDTA) and phenol sulfonphthalein (PSP), and cells were harvested by centrifuged with 800 × g for 5 minutes and incubated for 10 min on ice with 380 μl of ice-cold hypotonic lysis buffer (HLB) (10 mM pH 7.5 Tris, 3 mM MgCl2, 10 mM NaCl, 0.3% (vol/vol) NP-40 and 0.3% (vol/vol) glycerol) supplemented with 100 U of RNaseOUT™ Recombinant Ribonuclease Inhibitor (#10,777,019, Invitrogen™). The nuclear pellet and supernate were centrifuged for 20 min at 8000 × g at 4°C. The supernate, containing cytoplasmic RNA fraction, was mixed by 1 mL of RNA precipitation solution (0.5 mL of 3 M pH 5.5 sodium acetate with 9.5 mL of ethanol) and stored at −20°C for 1 h, then, the cytoplasmic pellet was centrifuged at 18,000 × g at 4°C for 15 min. The nuclear pellet was washed three times with 1 mL of ice-cold HLB. The nuclear and cytoplasmic pellets were followed by extraction with RNA-easy Isolation Reagent (#R701-02, Vazyme Biotech Co., Ltd.) according to the manufacturer’s instructions, and nuclear and cytoplasmic RNA samples were experimented with immediately or stored at −80°C. DAPI (4ʹ,6-diamidino-2-phenylindole) (#C0060, Solarbio) was added to a part (20 μl) of pellet and supernate and incubated for 30 min at room temperature, then treated pellet and supernatant samples were observed with the fluorescence microscope (IX73, OLYMPUS).
Library preparation and sequencing
The Universal V6 RNA-seq Library Prep Kit for Illumina (#NR604-02, Vazyme Biotech Co., Ltd.) was used for library preparation. Briefly, the samples were normalized at a concentration of 500 ng/ml. Samples were first subjected to a tagmentation reaction, indexed, and PCR amplified. Libraries were then purified with VAHTS DNA Clean Beads (#N411-02, Vazyme Biotech Co., Ltd.). QC checks for the library preparations included electrophoresis (Agilent Technologies 2100 Bioanalyzer) or library quantification. Samples were sequenced in the Novogene (Beijing CN) on an Illumina HiSeq 1500 high-throughput sequencing system.
Data Processing and Quality Control
FASTQ files were trimmed using trim galore and aligned to GRCm38 mouse reference genome using hisat2 (v2.2.0) using default parameters [Citation44] and further filtered by samtools-1.7 (parameters: samtools view -F 1804 -f 2 -q 10) [Citation45]. Gene-level quantification based on Ensembl GTF annotation (version mm10) was run on aligned reads using featureCounts (v2.0.1) [Citation46]. Read distribution was calculated using the read distribution.py function in the RSeQC suite [Citation47]. As a quality control check, raw FASTQ files were run through FastQC software [Citation48], and all samples passed quality statistics including GC content, adapter content, and overall quality. After pre-processing, all samples passed additional QC checks for alignment rate, gene assignment rate, and mitochondrial mapping rates.
Gene Expression Analysis
The principal component analysis was done using the plot PCA function from the DESeq2 Bioconductor package [Citation49]. Read distribution was calculated using the read_distribution.py function in the RSeQC suite [Citation47]. Gene expression differences were measured using the DESeq2 Bioconductor package [Citation49]. Samples were segregated by fraction and medication time and compared using several linear models. For subsequent gene expression analyses, a gene was considered significantly differentially expressed if the absolute value of the log2 fold change in expression was greater than or equal to one and if the false discovery rate (FDR) was less than or equal to 5%. Gene ontology enrichment and the Kyoto Encyclopaedia of Genes and Genomes (KEGG) enrichment were performed using the clusterProfiler Bioconductor package. Venn diagrams were drawn using the VennDiagram package. Principal component analysis and heatmaps were done in R.
Protein–protein Interaction (PPI) Network and Module Analysis
The online STRING tool (http://string-db.org) was used to potential correlations among the inflammation-related genes [Citation50]. An interaction with a combined score >0.4 was considered as statistically significant. Cytoscape software (version 3.7.1; http://cytoscape.org) was used to build the PPI network and visualize molecular interaction networks. The Molecular Complex Detection (MCODE) plugin of Cytoscape was used to identify the densest and significant module in the PPI networks with a standard degree cut-off of 2, a node score cut-off of 0.2, a max depth of 100 and a k-score of 2 [Citation51]. The cytoHbba plugin and the maximal clique centrality (MCC) method were used to screen out the top 10 hub genes. Hub genes were selected with degrees ≥10 (each node had more than 11 connections/interactions).
Co-expression Analysis
Gene co-expression analysis was constructed using python script. The correlation coefficients or R values between each lncRNA and each mRNA at 0 h, 12 h and 24 h in cytoplasm and nucleus were calculated using the Pearson correlation analysis to identify lncRNA-mRNA co-expression pairs. The pair of lncRNA and mRNA with R2 > 0.5 and p-value < 0.05 are considered as positive correlations, while R2<-0.5 and p-value <0.05 as negative correlations, and the rest are uncorrelated. The top 200 lncRNAs with the most related mRNAs were screened out and overlapped with cytoplasmic and nuclear DEGs. The lncRNA positively or negatively correlated mRNAs were used for GO enrichment analysis using clusterprofiler software.
Western blot
The nuclear and cytoplasmic pellets were incubated for 30 min on ice with 300 μl of RIPA mixture (mix with RIPA, protease inhibitor, and phosphatase inhibitor as 50:1:1) and centrifuged at 12,000 rpm at 4°C for 15 min to collect protein samples. The concentration of protein was measured by the Enhanced BCA Protein Assay Kit (#P0012S, Beyotime) according to the manufacturer’s instructions. Equal amounts of extracted protein were separated on 10% SDS-PAGE gel and subsequently transferred to nitrocellulose membranes. The membranes were probed using antibodies against the proteins of interest. Primary antibodies against proteins of interest were used for fractionation samples: a known nuclear protein histone H3 (1:4000; #A2348, ABclonal) and a cytoplasmic protein α-tubulin (1:8000; #AC007 ABclonal). And secondary antibodies horseradish peroxidase (HRP) goat Anti-Rabbit IgG (H + L) (1:8000; #AS014, ABclonal). Membranes were analysed using PierceTM ECL Plus Western blotting Substrate (#32,132, Thermo Scientific).
RT-qPCR
cDNA was synthesized by HiScript III-RT SuperMix for qPCR (+gDNA wiper) (#R323, Vazyme Biotech Co., Ltd.) according to the manufacturer’s instructions. Reactions were performed on LightCycle®96 (Roche) using ChamQ Universal SYBR qPCR Master Mix (#Q711, Vazyme Biotech Co., Ltd.). The result was analysed using the 2−ΔΔCq or 2−Cq (validation of nuclear-cytoplasmic fractionation) methods, and gene expression was normalized to Gapdh and presented as a fold change relative to control. Primers are described in Supplementary Table 1.
lncRNA fluorescent in situ hybridization (FISH)
For lncRNA FISH, the probe and negative control sequence of target genes were synthesized using T7 RNA polymerase (NEB, #M0251) and Fluorescein RNA Labelling Mix (Roche, #11,685,619,910) by in vitro transcription. The synthesized sequence labelled with fluorescein was directly used as FISH probe. Microglia BV2 cells were seeded on poly lysine-coated slides and cultured with culture medium or 10 μM oxy-Hb for 12 h or 24 h. Cell were fixed with 4% paraformaldehyde (in PBS) for 10 min and permeabilized for another 10 min using 20ug/ml proteinase K and 0.3% TritonX-100. Permeabilized samples were hybridized at 50°C for 12 h with 100ul hybridization solution (4 x SSC;50% formamide; 100 mg/ml Dextran sulphate; 10 mM RNaseout; 0.25 mg/ml salmon sperm DNA; 0.2 mg/ml yeast tRNA; 0.1% Tween-20) mixed 1ul probe. Next, the slides were washed using 4x SSC solution (mixed 50% formamide and 0.1% Tween-20) at 50°C for 20 min and then using 4x, 2x, and 1x SSC solution at 50°C for 10 min, respectively. Air-dry the surface of the slide and the add 10 μl DAPI, cover the cover slides. The pictures were taken using an Olympus BX63 fluorescence confocal microscope using 60× oil objectives and merged using cellSens Dimension 1.9 software. Final image adjustments were performed with Adobe Photoshop 8.0.
Plasmid constructions
The recombinant vectors encoding mouse Gm47270 or Gm44096 were constructed by PCR-based amplification from cDNA of mouse microglia BV2 cells and then subcloned into the pcDNA3.1 eukaryotic expression vector. The lncRNA expression vector was constructed by PCR-based amplification from cDNA of and then subcloned into Lentiviral knockdown plasmid pLKO.1 and Expression Lentivectors. All constructs were confirmed by DNA sequencing.
lncRNA Knockdown and Overexpression
Target sequences of lncRNA knockdown were 5′- GACAGCCAGGGCTACACAGA −3′ for Gm47270 and 5′- GCCTTCTCTCAGAGCTTGGT −3′for Gm44096; the scrambled control sequence was 5′- TTCTCCGAACGTGTCACGT −3′. And these sequences were cloned into lentivirual shRNA expression vector pLKO.1. Then, lentivirual vector and expression vectors co-transfected 293 T cells using liposomal transfection reagent LipoFiter3 (HANBIO, CN). Culture supernatant containing virus was collected every 24 h. After purification, lentiviruses were transfected into mouse microglia BV2 cells, knockdown efficiency was measured by qPCR. For overexpression assay, the full-length sequence of lncRNA Gm47270 was 5′- AGAGACCCTGCCTGAGAAAG −3′ (Forward) and 5′- ATGTTGAGGGGGTATACTCA −3′ (Reverse), which cloned into pCDNA3.1 vector and transfected into mouse microglia BV2 cells.
Statistical analysis
GraphPad Prism 7 was used for statistical analysis. We used an unpaired two-tailed t-test with Welch’s correction. Wilcoxon-Mann-Whitney test was used to compare two groups, and a one-way ANOVA was applied to compare three or more independent groups. Bar graphs were described as mean ± Standard error of the mean (SEM) of at least three independent experiments. Statistically significant changes relative to a negative control were represented with P < 0.05.
Data availability
The sequence data generated in this study have been submitted to the NCBI GEO database under accession number GSE160934. Supplementary information is supplied as a separate file.
Authors contribution
Y.L. and C.K. conducted all the RNA-seq libraries construction, RT-qPCR assays, FISH, Western blot, cell viability assay, NO measurement assay and cell culture work; Y.L., C.K. and K.X. performed the extraction of nuclear and cytoplasmic RNA; Z.B. performed all bioinformatics analysis; Y.H. and L.G. helped to performed the statistics and some data visualization; Y.L., C.K., Q.T. and X.Q. conducted lncRNA knockdown and overexpression assays; L.Z. supervised experiments regarding plasmid construction and analysis of the data. G.D. helped for co-expression analysis and manuscript proofreading; J.P. supervised the experiment regarding extraction of nuclear and cytoplasmic RNA; Y.J. and S.Y. conceived the project. C.K., J.P., Y.J. and S.Y. designed the study, analysed the data, and wrote the manuscript with input from all authors. All authors read and approved the final manuscript.
Supplemental Material
Download Zip (3.6 MB)Acknowledgments
This work was supported by the Young Elite Scientist Sponsorship Program by the China Association for Science and Technology, the National Natural Science Foundation of China (81771278, 81801176, 81971132), the Sichuan Science and Technology Program (2019JDTD0004, 2021031), the Luzhou Science and Technology Program (2020-RCM-68, 2019LZXNYDZ06), and the Southwest Medical University Program (2020ZRQNB072, 2020ZRQNB022).
Disclosure statement
No potential conflict of interest was reported by the author(s).
Supplementary Material
Supplemental data for this article can be accessed here
Additional information
Funding
Related Research Data
References
- Kohler A, Hurt E. Exporting RNA from the nucleus to the cytoplasm. Nat Rev Mol Cell Biol. 2007;8(10):761–773.
- Kuhn TM, and Capelson M. Nuclear Pore Proteins in Regulation of Chromatin State. Cells. 2019;8(11).
- Strasser K, Masuda S, Mason P, et al. TREX is a conserved complex coupling transcription with messenger RNA export. Nature. 2002;417(6886):304–308.
- Quinodoz S, Guttman M. Long noncoding RNAs: an emerging link between gene regulation and nuclear organization. Trends Cell Biol. 2014;24(11):651–663.
- van Heesch S, van Iterson M, Jacobi J, et al. Extensive localization of long noncoding RNAs to the cytosol and mono- and polyribosomal complexes. Genome Biol. 2014;15(1):R6.
- Ha M, Kim VN. Regulation of microRNA biogenesis. Nat Rev Mol Cell Biol. 2014;15:509–524.
- Reddy AS, O’Brien D, Pisat N, et al. A Comprehensive Analysis of Cell Type-Specific Nuclear RNA From Neurons and Glia of the Brain. Biol Psychiatry. 2017;81(3):252–264.
- Gallo JM, Jin P, Thornton CA, et al. The role of RNA and RNA processing in neurodegeneration. J Neurosci. 2005;25(45):10372–10375.
- Trask HW, Cowper-sal-lari R, Sartor MA, et al. Microarray analysis of cytoplasmic versus whole cell RNA reveals a considerable number of missed and false positive mRNAs. RNA. 2009;15(10):1917–1928.
- van Asch CJ, Luitse MJ, Rinkel GJ, et al. Incidence, case fatality, and functional outcome of intracerebral haemorrhage over time, according to age, sex, and ethnic origin: a systematic review and meta-analysis. Lancet Neurol. 2010;9(2):167–176.
- Macdonald RL, Schweizer TA. Spontaneous subarachnoid haemorrhage. Lancet. 2017;389(10069):655–666.
- Aronowski J, Zhao X. Molecular pathophysiology of cerebral hemorrhage: secondary brain injury. Stroke. 2011;42(6):1781–1786.
- Nakagawa Y, Chiba K. Diversity and plasticity of microglial cells in psychiatric and neurological disorders. Pharmacol Ther. 2015;154:21–35.
- Nimmerjahn A, Kirchhoff F, Helmchen F. Resting microglial cells are highly dynamic surveillants of brain parenchyma in vivo. Science. 2005;308(5726):1314–1318.
- Glass CK, Saijo K, Winner B, et al. Mechanisms underlying inflammation in neurodegeneration. Cell. 2010;140(6):918–934.
- Omura J, Habbout K, Shimauchi T, et al. Identification of Long Noncoding RNA H19 as a New Biomarker and Therapeutic Target in Right Ventricular Failure in Pulmonary Arterial Hypertension. Circulation. 2020;142(15):1464–1484.
- Tan DSW, Chong FT, Leong HS, et al. Long noncoding RNA EGFR-AS1 mediates epidermal growth factor receptor addiction and modulates treatment response in squamous cell carcinoma. Nat Med. 2017;23(10):1167–1175.
- Pandey GK, Mitra S, Subhash S, et al. The risk-associated long noncoding RNA NBAT-1 controls neuroblastoma progression by regulating cell proliferation and neuronal differentiation. Cancer Cell. 2014;26(5):722–737.
- Quinn JJ, Chang HY. Unique features of long non-coding RNA biogenesis and function. Nat Rev Genet. 2016;17(1):47–62.
- Mercer TR, Dinger ME, Sunkin SM, et al. Specific expression of long noncoding RNAs in the mouse brain. Proc Natl Acad Sci U S A. 2008;105(2):716–721.
- Wang J, Zhao H, Fan Z, et al. Long Noncoding RNA H19 Promotes Neuroinflammation in Ischemic Stroke by Driving Histone Deacetylase 1-Dependent M1 Microglial Polarization. Stroke. 2017;48(8):2211–2221.
- Gagnon KT, Li L, Janowski BA, et al. Analysis of nuclear RNA interference in human cells by subcellular fractionation and Argonaute loading. Nat Protoc. 2014;9(9):2045–2060.
- Zhang X, Lu Y, Wu Q, et al. Astaxanthin mitigates subarachnoid hemorrhage injury primarily by increasing sirtuin 1 and inhibiting the Toll-like receptor 4 signaling pathway. FASEB J. 2019;33(1):722–737.
- Gram M, Sveinsdottir S, Cinthio M, et al. Extracellular hemoglobin - mediator of inflammation and cell death in the choroid plexus following preterm intraventricular hemorrhage. J Neuroinflammation. 2014;11(1):200.
- Chow EY, Zhang J, Qin H, et al. Characterization of Hepatocellular Carcinoma Cell Lines Using a Fractionation-Then-Sequencing Approach Reveals Nuclear-Enriched HCC-Associated lncRNAs. Front Genet. 2019;10:1081.
- Bailey-Serres J, Sorenson R, Juntawong P. Getting the message across: cytoplasmic ribonucleoprotein complexes. Trends Plant Sci. 2009;14(8):443–453.
- Price AJ, Hwang T, Tao R, et al. Characterizing the nuclear and cytoplasmic transcriptomes in developing and mature human cortex uncovers new insight into psychiatric disease gene regulation. Genome Res. 2020;30(1):1–11.
- Fasken MB, Corbett AH. Mechanisms of nuclear mRNA quality control. RNA Biol. 2009;6(3):237–241.
- Cullen BR. Connections between the processing and nuclear export of mRNA: evidence for an export license? Proc Natl Acad Sci U S A. 2000;97(1):4–6.
- Stark R, Grzelak M, Hadfield J. RNA sequencing: the teenage years. Nat Rev Genet. 2019;20(11):631–656.
- Alqinyah M, Maganti N, Ali MW, et al. Regulator of G Protein Signaling 10 (Rgs10) Expression Is Transcriptionally Silenced in Activated Microglia by Histone Deacetylase Activity. Mol Pharmacol. 2017;91(3):197–207.
- Qin H, Wilson CA, Lee SJ, et al. LPS induces CD40 gene expression through the activation of NF-kappaB and STAT-1alpha in macrophages and microglia. Blood. 2005;106(9):3114–3122.
- Kannan V, Brouwer N, Uk H, et al. Histone deacetylase inhibitors suppress immune activation in primary mouse microglia. J Neurosci Res. 2013;91(9):1133–1142.
- Wang G, Shi Y, Jiang X, et al. HDAC inhibition prevents white matter injury by modulating microglia/macrophage polarization through the GSK3beta/PTEN/Akt axis. Proc Natl Acad Sci U S A. 2015;112(9):2853–2858.
- Magupalli VG, Negro R, Tian Y, et al. HDAC6 mediates an aggresome-like mechanism for NLRP3 and pyrin inflammasome activation. Science. 2020;369(6510).
- Bolha L, Ravnik-Glavac M, Glavac D. Long Noncoding RNAs as Biomarkers in Cancer. Dis Markers. 2017;2017. doi:10.1155/2017/7243968.
- Briggs JA, Wolvetang EJ, Mattick JS, et al. Mechanisms of Long Non-coding RNAs in Mammalian Nervous System Development, Plasticity, Disease, and Evolution. Neuron. 2015;88(5):861–877.
- Feng L, Liao YT, He JC, et al. Plasma long non-coding RNA BACE1 as a novel biomarker for diagnosis of Alzheimer disease. BMC Neurol. 2018;18(1):18.
- Li ZS, Gu XY, Sun LL, et al. Dorsal root ganglion myeloid zinc finger protein 1 contributes to neuropathic pain after peripheral nerve trauma. Pain. 2015;156(4):711–721.
- Zhao JY, Liang L, Gu X, et al. DNA methyltransferase DNMT3a contributes to neuropathic pain by repressing Kcna2 in primary afferent neurons. Nat Commun. 2017;8(1):14712.
- Zhao X, Tang Z, and Zhang H, et al. A long noncoding RNA contributes to neuropathic pain by silencing Kcna2 in primary afferent neurons. Nat Neurosci. 2013;16 (8) :1024–1031.
- Marques AC, Ponting CP. Intergenic lncRNAs and the evolution of gene expression. Curr Opin Genet Dev. 2014;27:48–53.
- Zeitlmann L, Sirim P, Kremmer E, et al. Cloning of ACP33 as a novel intracellular ligand of CD4. J Biol Chem. 2001;276(12):9123–9132.
- Kim D, Langmead B, Salzberg SL. HISAT: a fast spliced aligner with low memory requirements. Nat Methods. 2015;12(4):357–360.
- Li H, Handsaker B, Wysoker A, et al. The Sequence Alignment/Map format and SAMtools. Bioinformatics. 2009;25(16):2078–2079.
- Liao Y, Smyth GK, Shi W. featureCounts: an efficient general purpose program for assigning sequence reads to genomic features. Bioinformatics. 2014;30(7):923–930.
- Wang L, Wang S, Li W. RSeQC: quality control of RNA-seq experiments. Bioinformatics. 2012;28(16):2184–2185.
- Wingett SW, FastQ Screen: AS. A tool for multi-genome mapping and quality control. F1000Res. 2018;7:1338.
- Love MI, Huber W, Anders S. Moderated estimation of fold change and dispersion for RNA-seq data with DESeq2. Genome Biol. 2014;15(12):550.
- Szklarczyk D, Gable AL, Lyon D, et al. STRING v11: protein-protein association networks with increased coverage, supporting functional discovery in genome-wide experimental datasets. Nucleic Acids Res. 2019;47(D1):D607–D613.
- Bandettini WP, Kellman P, Mancini C, et al. MultiContrast Delayed Enhancement (MCODE) improves detection of subendocardial myocardial infarction by late gadolinium enhancement cardiovascular magnetic resonance: a clinical validation study. J Cardiovasc Magn Reson. 2012;14(1):83.