
Abstract
Immune cells are known as the most sensitive tissue for ionizing radiation. Numerous reports relating with the effect of low-dose ionizing radiation (LDIR) on immune activities showed that LDIR can induce immune-potentiation via modulating the activity of B-, T-, and NK cells, or macrophages, whereas high-dose radiation induces genome-wide apoptotic/necrotic tissue injury and immune suppression. Generally, CD4+ T-cells play pivotal roles in immune systems via cytokines and cell-surface molecules to activate other types of immune cells to eliminate the pathogen. In spite of the significance of CD4+ T-cells in the immune system, mechanism of how LDIR regulates CD4+ T-cell gene expression is poorly investigated. Thus, RNA-Seq and Gene-Set Enrichment Analysis (GSEA) analysis were done with low-dose irradiated (γ-radiation, 50 mGy, 204 mGy/h)/anti-CD3/CD28-stimulated CD4+ T-cells to explore the LDIR-specific regulation of CD4+ T-cell gene expression. The results indicated that the genes related to mRNA translation processes, mitochondrial function, cell cycle regulation, and cytokine induction were upregulated in irradiated cells. Moreover, this study showed that the expression of T-helper cell Type 1 (TH1) or type 2 (TH2) cytokine genes, such as those for interferon (IFN)-γ, interleukin (IL)-4, and IL-5 were increased by at least 1.4-fold in acute (204 mGy/h) or chronic (10 mGy/h) low-dose (10 or 50 mGy) irradiated/anti-CD3/CD28 stimulated CD4+ T-cells, whereas the T-regulatory (Treg) cell cytokine gene, transforming growth factor (TGF)-β was decreased. Overall, these findings demonstrated that LDIR could cause an upregulation of selected immune product genes and, in turn, might modulate the activity of CD4+ T-cells undergoing activation via an impact on cytokine gene regulation.
Introduction
According to many previous studies on the biological effects of ionizing radiation, it has been shown that high-dose radiation was clearly harmful for living organisms due to genome-wide apoptotic/necrotic tissue injury induced by DNA damage as well as due to immunosuppression (Dainiak Citation2002; McFarland et al. Citation2012). On the other hand, the biological risk from low-dose ionizing radiation (LDIR), i.e. <100 mGy, has not been fully determined and still remains controversial. Nevertheless, based on a recommendation by the United Nations Scientific Committee on the Effects of Atomic Radiation (UNSCEAR), a linear-no-threshold (LNT) model whereby the risk of harm increases linearly without a threshold is used to establish radiation protection guidelines for nuclear workers and the general public (Scott Citation2005).
Despite the risks from high-dose radiation, many scientists have suggested LDIR is beneficial to human health or in cases of specified biological conditions, such as an adaptive response models (Cohen Citation1994; Cai and Wang Citation1995; Feinendegen et al. Citation1996; Feinendegen Citation2005; Calabrese et al. Citation2007; Vaiserman Citation2010). In fact, some showed LDIR increased cellular metabolic activities, DNA repair, anti-oxidant activity, adaptive protection against DNA damage, as well as immune-potentiation. In one study, LDIR prevented spontaneous/toxicant-induced cancers as well as other adverse health effects (Calabrese et al. Citation2007). Moreover, LDIR is also known to possibly induce immune-potentiation via modulating the activity of B-, T-, and NK cells or macrophages, based on the radiation hormesis theory (Parsons Citation2000; Cheda et al. Citation2004; Pandey et al. Citation2005; Nowosielska et al. Citation2006). These results indicate that LDIR might exert cellular effects different from those of high-dose radiation (such as DNA damage, cell death, and cancer development).
As a defense against foreign pathogens such as microbe or viruses, a host immune system can utilize innate and/or adaptive immunity responses. Adaptive immune responses are coordinated by T- and B-cells with the support of antigen-presenting cells (APC) such as macrophages and dendritic cells (DC). To exert effector functions, naive T-cells need to be activated by recognition of protein antigens presented by APC along with activation signals via surface molecules such as CD3, CD28, etc. Activated CD4+ T-cells, known as T-helper (TH) cells, can then help promote cell-mediated responses against pathogens, produce formation/release of various cytokines to help further regulate the differentiation of TH subsets, and activate APC and B-cells (Jenkins et al. Citation2001).
Recent investigations have tried to assess CD4+ T-cell-specific effects of LDIR and explore if CD4+ T-cell-specific regulators (or effector) molecules were impacted upon by LDIR. One report showed that CD4+ cell populations in the spleen were increased in C57BL/6 mice following whole-body low-dose γ-irradiation (Song et al. Citation2015). Another study undertook gene screening using microarrays to identify LDIR-specific genes in splenic CD4+ T-cells isolated from whole-body-irradiated mice (Gridley, Rizvi, et al. Citation2009). That study found Il27 and Tcfcp2 genes were significantly upregulated by 100 mGy γ-irradiation. In addition to this, another study showed Ccr4, Cd40, Cebpb, Cxcr3, Socs5, Stat4, Tbx21, Tnfrsf4, and Tnfsf4 genes were upregulated by 100 mGy γ-irradiation (Gridley, Pecaut, et al. Citation2009). An additional report noted that expression of genes related to cell respiration, ATP metabolism, and chromatin organization were modulated in CD4+ T-cells isolated from whole blood that was irradiated by LDIR ex vivo (Nosel et al. Citation2013).
Though these previous studies identified several putative LDIR-specific (impacted) genes, a more comprehensive analysis using mass-screening data is required to more clearly identify LDIR-responsive genes. Accordingly, the present study was undertaken to perform transcriptome analysis (using RNA-Seq as a mass-screening tool) to specifically identify LDIR-responsive genes in CD4+ T-cells undergoing activation that are irradiated ex vivo.
Materials and methods
Naive CD4+ cell purification from spleen andT-cell activation
Spleens from naïve C57BL/6N (male, n = 5, 6-wk-of-age; Central Laboratory Animal, Inc. [Seoul, Korea]) were aseptically isolated after host euthanasia via CO2 asphyxiation. Each spleen was then disrupted using the plunger of a syringe and single-cell suspensions obtained by passing the cell mixture through a cell strainer, using phosphate-buffered saline (PBS, pH 7.2) as a rinse. To remove red blood cells, splenocytes were pelleted (300 × g, 10 min, room temperature [RT]) and then re-suspended in lysis buffer (150 mM NH4Cl in PBS) for 5 min on ice. The now RBC-free splenocytes were then washed twice by centrifugation and re-suspended in RPMI 1640 containing 10% fetal bovine serum (both from ThermoFisher Scientific Waltham, MA). After pooling and counting in a hemocytometer, CD4+ cells were purified from the total final mixture using a Dynabeads Untouched Mouse CD4 cell kit (ThermoFisher), according to manufacturer protocols.
To activate the resting CD4+ T-cells, the cells (2 × 10⁶/well [at 106 cells/ml]) were seeded into anti-mouse CD3e (Clone 145-2C11, BD Biosciences, San Jose, CA)-coated 6-well plates in 2 ml RPMI 1640 media supplemented with 10 μg/ml soluble anti-mouse CD28 antibody (Clone 37.51, BD Biosciences) and were incubated at 37 °C in 5% CO2/95% air for 1 h prior to use in the experiments below. For Treg polarization of CD4+ T-cells, cells (2 × 10⁶/well [at 106 cells/ml]) were seeded into anti-mouse CD3e-coated 6-well plates in 2 ml of RPMI1640 media supplemented with 10 μg/ml soluble anti-mouse CD28 antibody, 50 ng TGFβ (transforming growth factor-β)/ml (ThermoFisher, Waltham, MA), 20 U interleukin (IL)–2/ml (ThermoFisher), and 20 nM retinoic acid (Sigma, St. Louis, MO). The cells were then incubated at 37 °C in 5% CO2/95% air for 3 days prior to use in the flow cytometry experiments described below.
Irradiation of cells
For acute radiation, CD4+ T-cells undergoing activation were uniformly irradiated at RT with various doses of a 137Cs γ-source (Gammacell 40 Exactor, Best Theratronics, Ottawa, Canada) at a dose rate of 204 mGy/min. Control cells were simultaneously sham-irradiated by incubating sets of cells in parallel at RT. For chronic radiation, the cells undergoing activation were irradiated with 10 or 50 mGy of a 137Cs γ-source (Fuji Electric Systems Co., Tokyo, Japan) at a 10 mGy/h dose-rate. During chronic radiation, both control and irradiated cells undergoing activation were maintained in RPMI 1640 media containing 10% FBS (at 37 °C in a humidified atmosphere of 5% CO2).
Note: For RNA Seq analysis, only 50 mGy acute irradiation was used as a screening step. For subsequent qRT-PCR confirmation of LDIR-mediated impacts on cytokine genes in cells undergoing activation, 10 and 50 mGy acute irradiation or 10 and 50 mGy chronic irradiation were used. To analyze potential impact of irradiation on TGFβ expression (mRNA and protein), anti-CD3/CD28-stimulated cells were irradiated with 10, 20, 50, 200, or 1000 mGy acute irradiation. Lastly, to study potential effects on regulatory T-cell (Treg) levels among the cells (flow cytometry), anti-CD3/CD28-stimulated cells were sham-irradiated or irradiated with 50 mGy acute irradiation.
RNA preparation for RNA-Seq analysis
For the screening assay, at 24 h after irradiation, total RNA was isolated from the CD4+ cells (107 total; pooled from several wells) using TRIzol reagent (ThermoFisher) according to manufacturer protocols. Quality of all isolated RNA was assessed with an Agilent 2100 bioanalyzer and RNA 6000 Nano Chip (Agilent Technologies, Amstelveen, the Netherlands). RNA quantification was performed using a NanoDrop-2000 Spectrophotometer (ThermoFisher). For subsequent analyses of LDIR-mediated impact on cytokine genes in the cells undergoing activation, cells were harvested 24 h after irradiation and total RNA isolated as above. For analyses of potential impact of irradiation on TGFβ expression, both culture medium and cells were harvested 24 h after irradiation, and total RNA from the cells was isolated as above.
Library preparation and RNA sequencing
A library was constructed using SENSE mRNA-Seq Library Prep Kit (Lexogen, Vienna, Austria) as per manufacturer recommendations. High-throughput sequencing was then performed as paired-end 100 sequencing using a HiSeq 2000 system (Illumina, San Diego, CA). RNA-Seq reads were mapped using TopHat software to obtain the alignment file. The alignment file was used for assembling transcripts, estimating abundances, and detecting differential expression of genes/isoforms using cufflinks. Gene classification was based on searches done by DAVID (david.abcc.ncifcrf.gov) and Medline databases (www.ncbi.nlm.nih.gov). The library preparation and RNA sequencing were performed as the NGS services provided by Ebiogen Inc. (Seoul, Republic of Korea).
Gene ontology (GO) analysis and GSEA
GO analysis was performed using a PANTER classification system (www.pantherdb.org). Gene-Set Enrichment Analysis (GSEA) was performed using GSEA v2.2.2 software and a c5.all.v5.1. symbols.gmt (gene ontology)-gene set matrix (BROAD Institute) (Subramanian et al. Citation2005).
Quantitative reverse transcription-polymerase chain reaction (qRT-PCR)
Total RNA was isolated from each set of cells (3 × 10⁶/sample) using TRIzol reagent (ThermoFisher). A total of 1 μg total RNA/sample was then used to synthesize cDNA using iScript Reverse Transcription Supermix (ThermoFisher) according to manufacturer protocols. Quantitative PCR was then performed using a GoTaq SyBr Green qPCR master mix (Promega, Madison, WI) and a 7500 Real-Time PCR system (ThermoFisher). Relative levels of mRNA expression were determined using the ΔΔCt method (Livak and Schmittgen Citation2001). Information about target genes, primer sequences, and annealing temperatures is provided in .
Table 1. Information for the qRT-PCR experiments performed here.
Flow cytometry
Unlike the other protocols mentioned here, to quantify the levels of FoxP3+ regulatory T-cells (Treg) among the cells, at 3 days after exposure, all cells were harvested and evaluated with a mouse TH17/Treg cell phenotype kit (according to manufacturer recommendations; BD Pharmingen) and flow cytometry. In brief, cells (106 total) from each treatment set were prepared in kit Stain Buffer and then were fixed with cold kit Mouse FoxP3 Fixation Buffer. The cells were then permeabilized for 30 min at 37 °C with freshly-prepared pre-warmed kit Mouse FoxP3 Permeabilization Buffer. Cells were then stained (in dark) with kit mouse TH17/Treg phenotyping cocktail containing PerCP-Cy5.5-conjugated anti-mouse CD4 (clone: RM4-5), phycoerythrin (PE)-anti-mouse IL-17A (clone: TC11-18H10.1), and Alexa Fluor (AF) 647-anti-mouse FoxP3 (clone: MF23) monoclonal antibodies, or isotype control. For flow cytometric analysis, the stained cells were then analyzed in a Gallios flow cytometer using related Kaluza software (Beckman Coulter, Brea, CA). A minimum of 5000 events/sample was acquired.
Measures of released TGFβ
Harvested culture media TGFβ protein levels were measured using a TGFβ1 ELISA Ready-SET-Go Kit (ThermoFisher). To activate latent TGFβ1 to an immunoreactive form, each sample (100 µl) was first acidified using 1 N HCl (20 µl) and then neutralized using 1 N NaOH (20 µl). Aliquots of now-diluted materials (100 μl/sample) were then loaded into ELISA plates pre-coated with capture antibody. The plates were incubated for 2 h at RT before well contents were aspirated and each well was washed five times with kit Wash Buffer. Thereafter, 100 μl diluted kit detection antibody was added to each well and the plate was incubated for 1 h at RT. After five aspirations/washings, kit avidin-horseradish peroxidase solution (100 μl) was added to each well and the plate was incubated 30 min at RT. After five aspirations/washings, 100 μl kit-provided 3,3',5,5'-tetramethylbenzidine (TMB) substrate solution was added to each well and the plate was incubated for 15 min at RT before the addition of 50 μl kit Stop Solution to each well. The absorbance (at 450 nm) in each well was then measured using a TriStar2 S LB 942 multimode plate reader (Berthold Technologies, Bad Wildbad, Germany). Levels of TGFβ in each sample were extrapolated from a standard curve generated in parallel using kit standards; starting values from each well were readjusted after accounting for the acidification/neutralization steps.
Statistical analysis
Data represent means of three independent experiments. For qRT-PCR and ELISA, data are presented as means ± SD of triplicate samples (wells). Significance of any differences between/among groups was determined using a one-way analysis of variance (ANOVA) and a two-tailed Students t-test. p values < 0.05 were considered significant. All data were analyzed using SigmaPlot software (Systat, London, UK). For RNA-Seq analysis, a two-tailed Students t-test was used to determine significance.
Results
RNA-Seq\GO analysis of LDIR-impacted genes in CD4+ cells undergoing activation
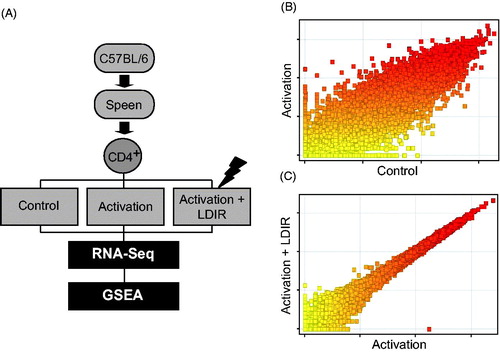
In a previous report (Cho et al. Citation2016), it was noted that LDIR could regulate B-cell lympho-proliferation in an Ikaros-dependent manner. In particular, LDIR <100 mGy specifically induced Ikaros phosphorylation to regulate cell cycle progression. To assess if LDIR might also regulate T-cell gene expression, anti-CD3/CD28-stimulated CD4+ T-cells were irradiated (50 mGy radiation, at 204 mGy/min) and RNA-Seq analysis and GSEA were then performed as described in . Total RNA from resting (Control, non-stimulated, non-irradiated), anti-CD3/CD28-stimulated (Activation), or anti-CD3/CD28-stimulated/LDIR (50 mGy)-treated CD4+ T-cells were used. As shown in scatter-plot analyses, gene expression profiles were greatly altered in CD4+ T-cells undergoing activation compared with the control cells (). To verify T-cell activation by anti-CD3/CD28 stimulation, expression levels of typical T-cell activation marker genes were checked (Shipkova and Wieland 2012). The levels of markers such as IL2RA, CD69, CD70, and TNFRSF4 were increased ≈ 2-fold by anti-CD3/CD28 stimulation; expression levels were maintained after LDIR-treatments (Table S1). LDIR-treated anti-CD3/CD28-stimulated cells showed moderate alterations in gene expression profiles compared with those in non-irradiated anti-CD3/CD28-stimulated counterparts (). RNA-Seq analysis indicated that 5506 genes were differentially-expressed in LDIR-exposed stimulated CD4+ T-cells compared with non-irradiated stimulated cells. Of these, 3089 were upregulated and 2417 down-regulated.
Figure 1. (A) Overview of transcriptome analysis and GSEA for identification of LDIR-impacted genes in CD4+ cells undergoing activation. (B) Scatter-plots: differential expression pattern between untreated (control) and anti-CD3/CD28-stimulated (Activation) cells, or (C) unirradiated/anti-CD3/CD28-stimulated (Activation) and LDIR/anti-CD3/CD28-stimulated (Activation + LDIR) cells.
GSEA for LDIR-impacted genes in CD4+ cells undergoing activation
To investigate the functional classification of LDIR-regulated genes, GSEA was performed with the list of genes seen as significantly changed in the level of expression (p < 0.01) during the RNA-Seq analysis. It was found that 205/487 gene-sets were upregulated in the LDIR-treated/anti-CD3/CD28-stimulated CD4+ cells compared with sham-irradiated stimulated cells. A list of the top 20 significantly-enriched gene-sets is provided in . Critical keywords used were Structural Constituent of Ribosome, Cytokine Activity, Extracellular Space, and Cation Homeostasis (). It was also seen that 282/487 gene-sets were down-regulated in LDIR-treated/anti-CD3/CD28-stimulated CD4+ cells compared with sham-irradiated stimulated counterparts. The top 20 significantly-enriched sets, using critical keywords Adenyl Nucleotide Binding, Anatomical Structure Morphogenesis, Adenyl Ribonucleotide Binding, Purine Ribo-nucleotide Binding, and ATP Binding, are listed in .
Figure 2. GSEA for LDIR-regulated genes in CD4+ T-cells undergoing activation. (A) Top four enrichment plots of gene expression signatures for Structure constituent of Ribosome, Cytokine activity, Extracellular space, Cation homeostasis, with a list of genes upregulated in LDIR/anti-CD3/CD28-stimulated CD4+ T-cell (LDIR) compared against unirradiated/anti-CD3/CD28-stimulated CD4+ T-cells (ACT). Barcode plot indicates positions of genes in each gene-set. ES, enrichment score; FDR, false discovery rate. (B) Enrichment map of gene-sets from GSEA listed in and . Cytoscape Plug-In used to visualize enrichment map. Nodes represent differentially upregulated and down-regulated networks in LDIR-treated cells. Lines represent genetic overlap between networks. Size of each node reflects relative level of gene number included in the network.
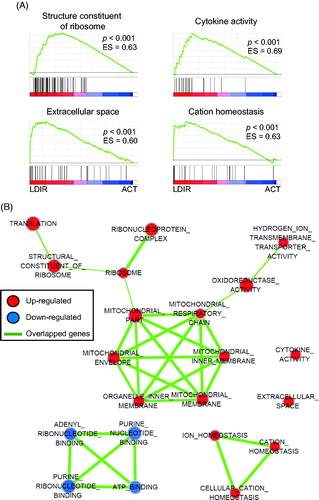
Table 2. The list of top 20 enriched gene-sets which were upregulated in LDIR/anti-CD3/CD28-stimulated CD4+ T-cell (LDIR) compared against unirradiated/anti-CD3/CD28-stimulated CD4+ T-cells (ACT) from GSEA.
Table 3. The list of top 20 enriched gene-sets which were down-regulated in LDIR/anti-CD3/CD28-stimulated CD4+ T-cell (LDIR) compared against unirradiated/anti-CD3/CD28-stimulated CD4+ T-cells (ACT) from GSEA.
To investigate how enriched gene-sets functionally correlated with each other, network enrichment analysis was performed. The list of overlapped gene-sets between enriched gene-sets was obtained from GSEA and the data were visualized using the Cytoscape program. In the groups of upregulated gene-sets in low-dose irradiated CD4+ T-cells, the gene-sets related with ribosomal (e.g. ribosome, ribonucleoprotein complex, structural constituent of ribosome, translation) and mitochondrial (e.g. mitochondrial inner membrane, respiratory chain, membrane, part, envelope, and organelle inner membrane) functions were highly overlapped (). In the groups of down-regulated gene-sets in low-dose irradiated CD4+ cells, the nucleotide binding function-related gene-sets (e.g. adenyl ribonucleotide binding, purine ribonucleotide binding, ATP binding, purine nucleotide binding) were highly overlapped. Names of genes that were overlapped in the networks are listed in Table S2. These data suggested a finding that LDIR could mediate ribosomal and mitochondrial functions as well as cytokine production.
LDIR-mediated impact on cytokine genes in CD4+ cells undergoing activation
Changes in gene-sets related to cytokine/chemokine production highly correlated with LDIR (). The data indicated genes for IL-2, -3, -4, -5, -21, and -17 A, and IFNγ and CCL14, CCL24, CXCL9, and XCL1 [chemokines] were upregulated by LDIR treatment of the T-cells undergoing activation (). To confirm the effects on cytokine gene expression, mRNA levels for select cytokines in the CD4+ cell mixtures were evaluated by qRT-PCR. The analyses showed that mRNA IFNγ (interferon-γ, signature TH1 cytokine) levels were significantly increased as a result of 10 and 50 mGy acute irradiation (IR) or 50 mGy chronic irradiation compared with that in sham-irradiated/anti-CD3/CD28-stimulated cells, outcomes consistent with the RNA-Seq data (). IL-4 (TH2 signature cytokine) mRNA was also increased with 50 mGy of acute or chronic irradiation (). Interestingly, the mRNA level of TH2 cytokine IL-5 was increased by 10 or 50 mGy chronic irradiation, but not acute irradiation (). In addition, while IL-17A (inflammatory cytokine) mRNA was significantly decreased by 10 mGy acute irradiation (compared with that in sham-irradiated stimulated cells) it was increased by 50 mGy chronic irradiation (). mRNA levels of TGFβ1 (mainly produced by Treg cells) were significantly decreased by 50 mGy acute and chronic irradiation compared with sham-irradiated stimulated cells (). IL-10 mRNA levels were increased by 50 mGy acute irradiation, but not chronic irradiation (). The results suggest LDIR could positively-regulate TH1 and TH2 cytokines (IFN-γ, IL-4, IL-5) and negatively-regulate at least one Treg cytokine, i.e. TGFβ1.
Figure 3. LDIR effects on cytokine gene expression in CD4+ T-cells undergoing activation. Purified cells were stimulated with anti-CD3 (5 μg/ml) and anti-CD28 (5 μg/ml) antibodies for 1 h, then exposed to γ-irradiation (Acute: 204 mGy/min, Chronic: 10 mGy). At 24 h after exposure to either regimen, cells were harvested for qRT-PCR to determine mRNA levels for genes corresponding to (A) IFNγ, (B) IL-4, (C) IL-5, (D) IL-17A, (E) TGFβ1, and (F) IL-10. *p < 0.05, **p < 0.01
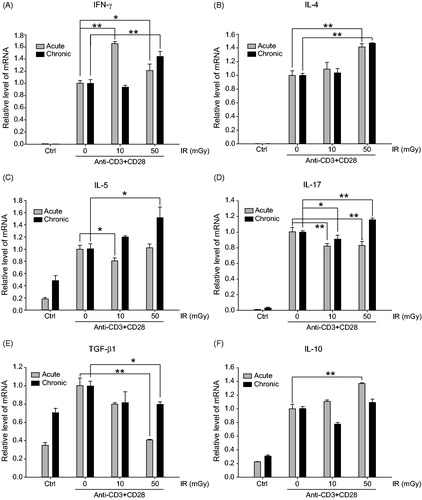
Table 4. The list of genes in CYOKINE_ACTIVITY gene-set from GSEA data in .
LDIR impact upon Treg cell differentiation as well as TGFβ1 gene expression
Given the importance of TGFβ in suppressive and homeostatic function of Treg cells, this study also analyzed potential impact of LDIR on TGFβ expression in the CD4+ cells undergoing activation. First, to determine if LDIR induced any down-regulation of TGFβ due to decreases in FoxP3+ Treg cell levels or by direct impact on TGFβ mRNA expression, the levels of FoxP3+ cells were evaluated after 50 mGy γ-irradiation. The data showed total levels of FoxP3+ cells were decreased from 3.2% to 2.3% by irradiation (, left panel). Considering FoxP3+ cells constitute 3–5% of the total splenic CD4+ T-cells, a 1% decrease would likely translate to a 30% decrease in FoxP3+ CD4+ T-cells.
Figure 4. LDIR effects on FoxP3+ Treg cell differentiation and expression of TGFβ1. (A) Purified mouse CD4+ cells stimulated with anti-CD3/CD28, incubated without or with TGFβ1/IL-2/retinoic acid for 1 h, then exposed to γ-irradiation. After 3 days, cells were harvested for flow cytometry to determine FoxP3+ cell levels. (B–C) Purified mouse CD4+ cells were stimulated with anti-CD3/CD28 antibodies for 1 h, then irradiated as indicated. After 24 h, cells and medium were harvested for (B) qRT-PCR and (C) ELISA, respectively, to determine levels of TGFβ1 mRNA or TGFβ1 protein. *p < 0.05, **p < 0.01.
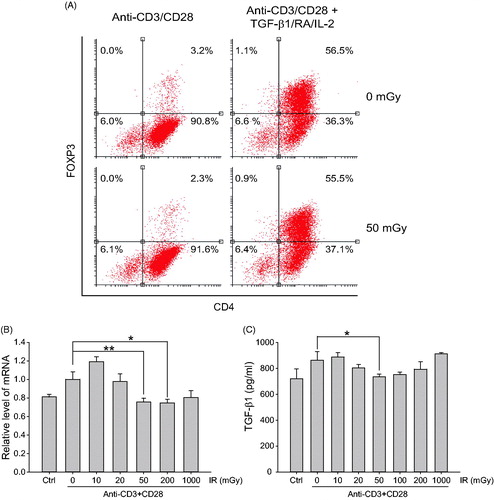
Note: TGFβ1, retinoic acid, and IL-2 treatment can create a Treg cell-polarized (enriched) condition during T-cell activation with anti-CD3/CD28 antibodies. Unlike in non-stimulated/resting CD4+ cells, FoxP3+ cell levels were not changed by irradiation under any Treg cell polarization state (, right panel). Thus, it would seem LDIR might mediate Treg cell differentiation among naïve CD4+ T-cells.
To further investigate the effects of LDIR on TGFβ1 expression, TGFβ1 mRNA levels and those of the secreted protein in CD4+ T-cells undergoing activation and irradiated with various doses of γ-irradiation were examined. The data showed TGFβ1 mRNA levels were significantly decreased in cells treated with 50 or 200 mGy irradiation compared with levels in sham-irradiated/anti-CD3/CD28-stimulated cells (). Secreted TGFβ1 levels were decreased only by 50 mGy irradiation of anti-CD3/CD28-treated cells (). Taken together, the results suggest LDIR could impact both Treg cell differentiation and TGFβ1 expression in CD4+ T-cells undergoing activation.
Discussion
As effector cells, CD4+ T-cells play central roles in the immune system by using cytokine secretion or cell-surface molecule-mediated signaling to activate other immune cells to eliminate pathogens or negatively regulate immune cells to prevent autoimmune diseases. Thus, CD4+ T-lineage cells are classified into various types of functional cells whose functions vary. The major function of T-helper type 1 (TH1) lineage cells is to activate macrophages to remove microbes, indirectly help B-cells produce high-affinity antibodies [against microbes], and promote development of functional cytotoxic T-lymphocytes to fight intracellular microbes. Counterpart TH2 cells stimulate IgE- and eosinophil-mediated immune reactions against helminthic and bacterial infections. In contrast, regulatory T-cells (Treg cells, formerly known as T-suppressor cells) modulate many aspects/functions of the immune system, help to maintain tolerance to self-antigens, and act to abrogate autoimmune reactions.
Various CD4+ T-cell lineages closely communicate to maintain the immune system. Expression of effector molecules (cytokines, cell surface molecules) in each lineage are tightly controlled by lineage-specific cellular regulators, including transcription factors (Zhu et al. Citation2010). As examples, T-bet and STAT1 are critical transcription factor regulating TH1 cell differentiation and function, and GATA3 is a master regulator of TH1 and TH2 differentiation. FoxP3 is a master transcriptional regulator of Treg cells; constitutive expression is required for suppressive activity of Treg cells. In spite of the importance of various regulators for CD4+ T-cells, it is not clear how LDIR regulates these factors. The current study shows that genes associated with RNA translation, mitochondrial function, cell cycle regulation, and cytokine activity were upregulated by LDIR in CD4+ cells undergoing activation. Moreover, cytokine genes mainly produced by TH1\TH2 cells were upregulated by LDIR, whereas one from Treg cells was negatively regulated.
Based on a 2007 International Commission on Radiological Protection (ICRP) decision, the recommended maximum effective occupational doses for workers are 50 mSv/year and 100 mSv/5 years (Wrixon Citation2008). Thus, a radiation dose < 100 mGy is considered low-dose ionizing radiation. Previous reports showed LDIR induces negligible levels of single- or double-strand DNA breaks that are rapidly (within 24 h) removed by DNA repair mechanisms (Asaithamby and Chen Citation2009; Grudzenski et al. Citation2010). Thus, if one might rule out DNA damage effects from LDIR, the question remains – how does LDIR impact on immune cells, particularly CD4+ T-cells?
The current study using transcriptome analysis found that LDIR induced changes in at least three major cellular functional gene categories. (1) Gene-sets related to mRNA translation processes and ribosomal function were upregulated. Those gene-sets contain large or small ribosomal proteins (RPL, RPS) known as components of 60S or 40S ribosomes (Zhou et al. Citation2015). Since ribosomal proteins are closely correlated with protein translation, the data suggested that LDIR possibly regulated protein translation through modulating ribosomal proteins. (2) Gene-sets related to mitochondria (such as mitochondrial part, membrane, and respiratory chain), were upregulated. In particular, many genes such as Ndufss and NdufAs in these groups are subunits of complex I (NADH dehydrogenase: ubiquinone oxidoreductase) (Table S2) (Vinothkumar et al. Citation2014). Complex I is a multimeric enzyme complex of mitochondrial respiratory chains (catalyzing transfer of electrons from NADH to Coenzyme Q10), and generates a proton gradient across the energy-transducing mitochondrial inner membrane to drive ATP production (Mimaki et al. Citation2012). In addition, the analyses here found that genes that encode subunits of mitochondrial ATP synthase (i.e. ATP5D, ATP5B, and ATP5Gs) were overlapped in gene-sets related with mitochondrial function. Thus, we postulate that LDIR positively-regulated ATP energy metabolism, in part, by modulating mitochondrial enzymes. (3) The mRNA expression of several cytokines produced by CD4+ T-cells undergoing activation, mainly from TH1 (IFNγ) and TH2 (IL-4, -5) cells, were significantly increased by LDIR. These results are consistent with those of previous studies. For example, ex vivo IFNγ production was increased by splenocytes isolated from low-dose irradiated (50 mGy) group of mice after anti-CD3 activation (Rizvi et al. Citation2011). In addition, IL-3 and IL-4 levels were upregulated in the serum of chronic low-dose irradiated (200 mGy) mice (Shin et al. Citation2010).
The present data indicated that LDIR possibly impacted TH1 and TH2 cell function, in part, by impacting on cytokine gene expression. How might the LDIR cause upregulated TH1 and TH2 cytokine expression? One possible mechanism is an LDIR-mediated regulation of intracellular gene regulators such as transcription factor or kinases for these cytokines in these T-cells undergoing activation. However, this remains unknown. Another possible mechanism is a down-regulation of these cytokines by inhibitory extracellular factors. One known inhibitory factor that can suppress TH1and TH2, is TGFβ, a protein produced primarily by Treg cells that plays a critical role in the development and differentiation of FoxP3+ Treg cells (Tran Citation2012). Moreover, TGFβ blocks TH1 cell differentiation by inhibiting T-bet expression and consequently down-regulating IFNγ production (Gorelik et al. Citation2002) and inhibiting TH2 cell development via inhibiting GATA-3 expression (Gorelik et al. Citation2000; Heath et al. Citation2000). As the study here showed LDIR led to decreased TGFβ1 expression by CD4+ cells undergoing activation, we postulate LDIR upregulated TH1 and TH2 cytokine genes via an inhibition of TGFβ production. Clearly, these possible mechanisms need to be confirmed in future additional experiments.
Conclusions
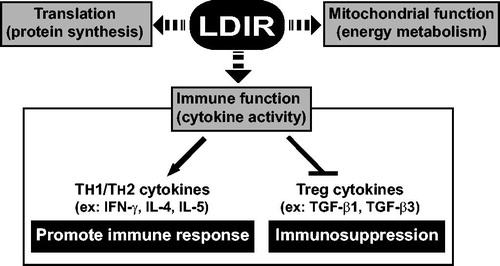
Ionizing radiation, particularly high-dose radiation, is regarded as a toxic threat to living organisms due to its ability to induce genome-wide apoptotic/necrotic tissue injury (via DNA damage) and immune suppression. The data here demonstrated that LDIR can upregulate the mRNA expression of genes related to mRNA translation, mitochondrial function, and cytokine gene expression in CD4+ T-cells undergoing activation (). These findings provide evidence of a possibility that LDIR, unlike high-dose ionizing radiation, could differentially regulate cellular processed in CD4+ T-cells undergoing activation.
Figure 5. Model for LDIR-regulated cellular functions in CD4+ T-cells undergoing activation.
Acknowledgments
The authors deeply appreciate Dr. Kwang Hee Yang’s effort and contribution to this work.
Disclosure statement
The authors declare no conflicts of interest. The authors alone are responsible for the content of this manuscript.
Additional information
Funding
References
- Asaithamby A, Chen D. 2009. Cellular responses to DNA double-strand breaks after low-dose γ-irradiation. Nucleic Acids Res. 37:3912–3923.
- Cai L, Wang P. 1995. Induction of a cytogenetic adaptive response in germ cells of irradiated mice with very low-dose rate of chronic γ-irradiation and its biological influence on radiation-induced DNA or chromosomal damage and cell killing in their male offspring. Mutagenesis. 10:95–100.
- Calabrese E, Bachmann K, Bailer A, Bolger P, Borak J, Cai L, Cedergreen N, Cherian M, Chiueh C, Clarkson T, et al. 2007. Biological stress response terminology: Integrating the concepts of adaptive response and preconditioning stress within a hormetic dose-response framework. Toxicol Appl Pharmacol. 222:122–128.
- Cheda A, Wrembel-Wargocka J, Lisiak E, Nowosielska E, Marciniak M, Janiak M. 2004. Single low doses of X rays inhibit the development of experimental tumor metastases and trigger the activities of NK cells in mice . Radiation Res. 161:335–340.
- Cho S, Kang H, Kim M, Lee J, Kim S, Nam S, Kim J, Kim H, Pyo S, Yang K. 2016. Site-specific phosphorylation of Ikaros induced by low-dose ionizing radiation regulates cell cycle progression of B-lymphoblast through CK2 and AKT activation. Int J Radiation Oncol Biol Phys. 94:1207–1218.
- Cohen B. 1994. Dose-response relationship for radiation carcinogenesis in the low-dose region. Int Arch Occup Environ Health. 66:71–75.
- Dainiak N. 2002. Hematologic consequences of exposure to ionizing radiation. Exp Hematol. 30:513–528.
- Feinendegen L. 2005. Evidence for beneficial low level radiation effects and radiation hormesis. Br J Radiol. 78:3–7.
- Feinendegen L, Bond V, Sondhaus C, Muehlensiepen H. 1996. Radiation effects induced by low doses in complex tissue and their relation to cellular adaptive responses. Mutat Res. 358:199–205.
- Gorelik L, Constant S, Flavell R. 2002. Mechanism of transforming growth factor of TGFβ-induced inhibition of T-helper Type I differentiation. J Exp Med. 195:1499–1505.
- Gorelik L, Fields P, Flavell R. 2000. Cutting edge: TGFβ inhibits TH type 2 development through inhibition of GATA-3 expression. J Immunol. 165:4773–4777.
- Gridley D, Pecaut M, Rizvi A, Coutrakon G, Luo-Owen X, Makinde A, Slater J. 2009. Low-dose, low-dose-rate proton radiation modulates CD4+ T-cell gene expression . Int J Radiat Biol. 85:250–261.
- Gridley D, Rizvi A, Luo-Owen X, Makinde A, Pecaut M. 2009. Low-dose, low-dose rate photon radiation modifies leukocyte distribution and gene expression in CD4+ T-cells. J Radiation Res. 50:139–150.
- Grudzenski S, Raths A, Conrad S, Rube C, Lobrich M. 2010. Inducible response required for repair of low-dose radiation damage in human fibroblasts. Proc Natl Acad Sci USA. 107:14205–14210.
- Heath V, Murphy E, Crain C, Tomlinson M, O'Garra A. 2000. TGF-β1 down-regulates TH2 development and results in decreased IL-4-induced STAT6 activation and GATA-3 expression. Eur J Immunol. 30:2639–2649.
- Jenkins M, Khoruts A, Ingulli E, Mueller D, McSorley S, Reinhardt R, Itano A, Pape K. 2001. In vivo activation of antigen-specific CD4 T-cells. Annu Rev Immunol. 19:23–45.
- Livak K, Schmittgen T. 2001. Analysis of relative gene expression data using real-time quantitative PCR and the 2(-ΔΔC(T)) Method. Methods. 25:402–408.
- McFarland H, Puig M, Grajkowska L, Tsuji K, Lee J, Mason K, Verthelyi D, Rosenberg A. 2012. Regulatory T cells in γ-irradiation-induced immune suppression. PLoS One. 7:e39092
- Mimaki M, Wang X, McKenzie M, Thorburn D, Ryan M. 2012. Understanding mitochondrial Complex I assembly in health and disease. Biochim Biophys Acta. 1817:851–862.
- Nosel I, Vaurijoux A, Barquinero J, Gruel G. 2013. Characterization of gene expression profiles at low and very low doses of ionizing radiation. DNA Repair. 12:508–517.
- Nowosielska E, Wrembel-Wargocka J, Cheda A, Lisiak E, Janiak M. 2006. Enhanced cytotoxic activity of macrophages and suppressed tumor metastases in mice irradiated with low doses of X-rays. J Radiation Res. 47:229–236.
- Pandey R, Shankar B, Sharma D, Sainis K. 2005. Low-dose radiation induced immunomoculation: Effect on macrophages and CD8+ T-cells. Int J Radiat Biol. 81:801–812.
- Parsons P. 2000. Hormesis: An adaptive expectation with emphasis on ionizing radiation. J Appl Toxicol. 20:103–112.
- Rizvi A, Pecaut M, Gridley D. 2011. Low-dose γ-rays and simulated solar particle event protons modify splenocyte gene and cytokine expression patterns. J Radiation Res. 52:701–711.
- Scott B. 2005. Stochastic thresholds: A novel explanation of non-linear dose-response relationships for stochastic radiobiological effects. Dose Response 3:547–567.
- Shin S, Lee K, Kang Y, Kim K, Kim C, Yang K, Jin Y, Kim C, Kim H. 2010. Alteration of cytokine profiles in mice exposed to chronic low-dose ionizing radiation. Biochem Biophys Res Commun. 397:644–649.
- Song K, Kim M, Kang S, Jung S, Ahn J, Woo H, Nam S, Hwang S, Ryu S, Song J. 2015. Analysis of immune cell populations and cytokine profiles in murine splenocytes exposed to whole-body low-dose irradiation. Int J Radiation Biol. 91:795–803.
- Subramanian A, Tamayo P, Mootha V, Mukherjee S, Ebert B, Gillette M, Paulovich A, Pomeroy S, Golub T, Lander E, et al. 2005. Gene set enrichment analysis: Knowledge-based approach to interpret genome-wide expression profiles. Proc Natl Acad. Sci USA 102:15545–15550.
- Tran D. 2012. TGFβ: the sword, the wand, and the shield of FOXP3+ regulatory T-cells. J Mol Cell Biol. 4:29–37.
- Vaiserman A. 2010. Radiation hormesis: Historical perspective and implications for low-dose cancer risk assessment. Dose Response 8:172–191.
- Vinothkumar K, Zhu J, Hirst J. 2014. Architecture of mammalian respiratory complex I. Nature. 515:80–84.
- Wrixon A. 2008. New ICRP recommendations. J Radiol Prot. 28:161–168.
- Zhou X, Liao W, Liao J, Liao P, Lu H. 2015. Ribosomal proteins: Functions beyond the ribosome. J Mol Cell Biol. 7:92–104.
- Zhu J, Yamane H, Paul W. 2010. Differentiation of effector CD4 T-cell populations. Annu Rev Immunol. 28:445–489.