Abstract
In Europe, the 2003 summer heat wave damaged forested areas. This study aims to compare two approaches of NDVI time series analysis to monitor forest decline. Both methods analyze the trend of vegetation activity from 2000 to 2011. The first method is based on a phenometric related to spring vegetation activity, calculated for each year during the 2000–2011 period. In the second method (BFAST), the trend comes from the decomposition of the NDVI time series into three additive components: trend, seasonal and remainder. The two approaches gave similar results for estimated trends. The main advantage of BFAST is its ability to detect breakpoints in the linear trend. It allowed to highlight here the impact of exceptional events, like 2003 summer drought, on the development of forest stands. In the last part of our study, we implemented a validation based on in situ observations. Health status of silver fir stands was estimated analyzing the trees architecture. Significant relationships were highlighted between the indicator of spring vitality derived from remote sensing images and the observed status of forest stands.
1. Introduction
In France and in most of Europe, exceptional climatic conditions characterized by very high temperatures associated with drought prevailed for most of the summer 2003 and, in some areas, drought and high temperatures continued until spring 2004 (Rebetez et al. Citation2006). Among the vegetation impacted by the stress induced (Allen et al. Citation2010), forests located in mountainous areas of southern France were particularly damaged. In these areas, some species of economic interest like spruce fir, Douglas fir and Vancouver fir have recently shown signs of decline. Consequently, from 2000 to 2007, beforehand logging due to climate-induced drought stress and increased attacks by insects and pathogens, covered more than 10% of the planted area.
In the French Mediterranean region, silver fir, which is also a mountain species, is growing at the southern limit of its habitat and is therefore more vulnerable. Hence, since 2003, severe decline has been observed in several stands (Asse Citation2012; Nourtier Citation2011). On the limestone plateau of Sault (site 2 in our study) in the Pyrenees mountain range, the most affected stands were growing at altitudes lower than 1000 m, on south facing slopes or crests (Boutte and Girard Citation2008). In this context, maps of forest decline can be useful for forest management as a decision tool for planting and numerous examples of mapping and monitoring forest disturbance using remotely sensed data exist in literature (Coppin et al. Citation2004; Hansen et al. Citation2008; Masek et al. Citation2008; Wulder et al. Citation2009).
Annual cycles of vegetation indices such as NDVI (a standard “greenness” index) describe the vegetation phenology. Indeed, seasonality affects vegetation status in a relatively predictable and reproducible manner with “greening” in spring and senescence at the end of summer. Abnormal climatic conditions or pest attacks impact the phenology and it can significantly change the spectral characteristics of the vegetation. Therefore, NDVI variations can be used to characterize decrease in spring activity and/or acceleration in senescence during summer. The consistency of the use of NDVI for the detection of significant changes in vegetation activity rates has already been demonstrated (Pettorelli et al. Citation2005). Analysis of trends in time series of NDVI images such as Moderate Resolution Imagery Spectroradiometer (MODIS) NDVI time series can therefore be used for the detection and monitoring of gradual or sudden changes in forest health.
Developing robust validation approaches associated with forest disturbance monitoring, is still a challenge (Brink and Eva Citation2009; Huang et al. Citation2010; Kennedy, Yang, and Cohen Citation2010). Chéret et al. (2006) used a time series of MODIS Terra NDVI images to estimate and map forest damages over our first study area. The wide area covered by the coarse spatial resolution of MODIS images enabled homogeneous processing of large regions and the analyze of time series are well appropriate to monitor forest health (Solberg et al. Citation2007). Daily data available for periods of several years enable phenological monitoring. This approach was based on the calculation of a phenological indicator linked to spring vegetation activity (phenometric: spring greenness (SG)) based on the work of (Reed Citation2006).
When analyzing inter-annual variations in the SG indicator, Chéret et al. 2006 observed an unusual decrease in SG that was assumed to be due to a reduction in vegetation vitality associated with forest decline. In this work, we extracted the trend by decomposition of NDVI time series into trend, seasonal, and remainder components using the BFAST (Break For Additive Season and Trend) procedure (Verbesselt, Hyndman, Newnham, et al. Citation2010, Verbesselt, Hyndman, Zeileis, Citation2010).
The first goal of the present study was to compare the trends estimated by each method. In addition, we assessed the ability of BFAST to detect and to map the timing of abrupt changes within the time series. The effect of the 2003 drought on forest stand development is highlighted. The first step was conducted using data from study area 1.
Then, a second goal was to implement a validation procedure of NDVI time series-derived metrics informing annually the forest stand vitality and its dynamics. Tree vitality status was recorded on observation plots according to the ARCHI method (Drénou, Bouvier, and Lemaire Citation2011; Drénou, Bouvier, and Lemaire Citation2012). The ARCHI method analyses tree architecture (whole tree, crown, axes and branches) to establish a diagnosis of tree health status. Originally developed for oak trees (Quercus robur L.) it has recently been adapted and applied to silver fir (Giraud Citation2012) in the framework of a climate observatory program in the Pyrenees mountains (http://www.opcc-ctp.org). The reference area of this study was the Sault limestone plateau (site 2 in the present study), making ground data available to validate our NDVI-derived indicators over another area.
2. Material
2.1. Study sites
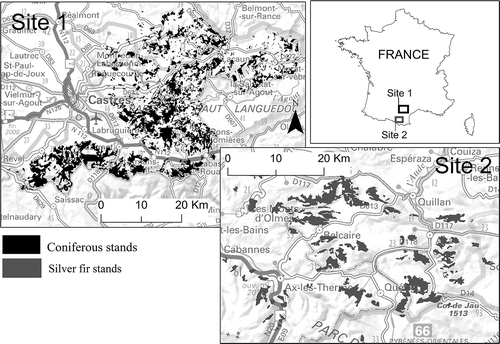
Study site 1 is located in the south-western Massif Central Mountains, France (). Coniferous stands cover approximately 40,000 hectares (400 km2) with a very fragmented distribution. The main species are silver fir Abies Alba, spruce fir Picea abies, and Douglas fir Pseudotsuga menziessii. According to an assessment conducted in 2007, thousands of hectares have been affected by forest decline.
The second study site (Site 2) is located in the eastern Pyrenees Mountains, France (). Silver fir stands cover approximately 30,000 ha. The elevations of these stands range from 850 to 2000 m asl.
2.2. Spatial data
In this study, we used time series of MODIS Terra vegetation index produced at 250 × 250 m resolution and 16-day compositing periods (MOD13Q1 collection 5 product). These images were generated using the constrained view maximum value compositing method to limit the effects of residual cloud, atmospheric effects, and to constrain the angles (Huete et al. Citation2002). A total of 276 images were acquired from the Land Processes Distributed Active Archive Center (https://lpaac.usgs.gov/) covering the period from February 2000 to February 2012. Dataset pre-processing included clipping the images to the study area, re-projecting the images onto the French geodesic system, and correcting data errors using the adaptive Savisky–Golay algorithm with TIMESAT Software (Jönsson and Eklundh Citation2004). MODIS NDVI values, originally coded from −0.2 to +1.0, were resampled between 0 and 12,000 in order to facilitate informatics processes. The 12,000 value corresponds to the maximum NDVI. For the analysis, only pixels within forest stand boundaries were selected. Detailed forest maps from the French National Forest Inventory (IFN) are available at a scale of 1:50,000, and can be used to map coniferous forest stands.
3. Methods
3.1. Description of the two time series analyses
3.1.1. Phenological indicator approach
This first approach (phenological approach) consists in monitoring intra-annual and inter-annual variations of NDVI to identify coniferous areas characterized by atypical vegetation activity (Chéret et al. Citation2011). NDVI profiles over several years can be averaged to establish a mean phenological profile for each forest stand and to identify successive phases of vegetation phenology: onset of greenness, maximum greenness, senescence. To focus on spring vegetation activity, a SG phenological metric was designed to express the annual level of vegetation activity during the growth period. This metric corresponds to the sum of NDVI calculated over a fixed period of MODIS images from the onset of SG (end of April) to the maximum NDVI (in end of June) before the dry season (Reed Citation2006). Then, from 2000 to 2011, for each pixel, trend analysis was performed by testing the slope of the linear regression fitted line of the 12 SG values ().
The statistical significance of the SG trend was assessed by testing the slope of the trend against the null slope using a Student's t-test.
Using field data, the trend of SG indicator values were classified in four classes:
– Class 0: Increase or no significant decrease in vegetation activity, probably healthy stands | |||||
– Class 1: Limited decrease in vegetation activity, stand development remains uncertain | |||||
– Class 2: Significant decrease in vegetation activity, most forest stands are in the process of declining | |||||
– Class 3: Very high decrease in vegetation activity, declining stands, usually cut down | |||||
3.2. BFAST approach
3.2.1. BFAST, trend analysis
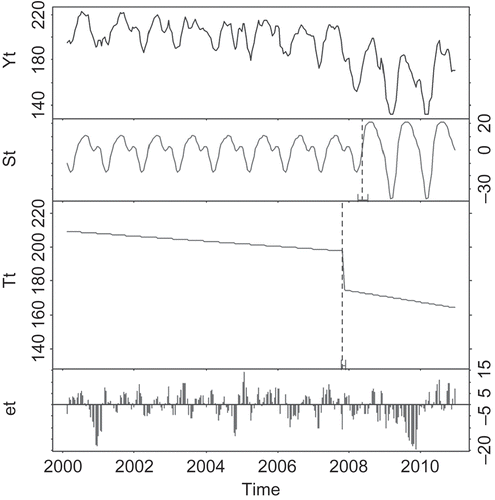
The second approach used the BFAST model (Breaks For Additive Seasonal and Trend) which is based on the locally weighted regression smoother temporal decomposition method (Verbesselt, Hyndman, Zeileis, et al. Citation2010). The original time series is decomposed into three additive components: 1) trend (pluri-annual linear), 2) season (seasonal variations), and 3) remainder (considered as noise) (). Each of these terms can be related to vegetation behavior at different time scales. We chose the harmonic model to fit the seasonality because it is considered to be the most appropriate for natural vegetation (Verbesselt, Hyndman, Zeileis, et al. Citation2010). These analyses were performed using the BFAST package in the statistical environment R (http://cran.r-project.org/package=bfast).
Figure 3. BFAST decomposition of NDVI time series from 2000 to 2011 for a single pixel containing coniferous stands. Yt = original time series, St = seasonal component, Tt = trend component, and et = remainder component.
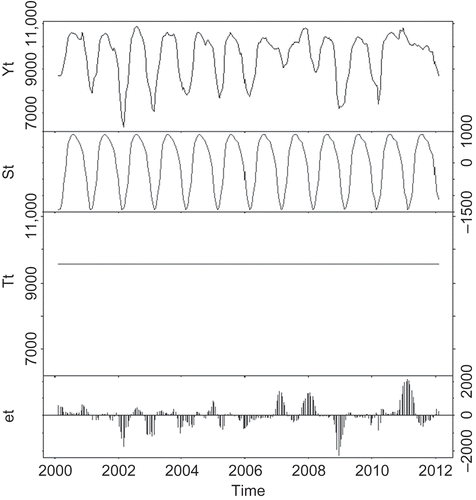
Trends were first calculated using the whole time series and then by selecting only the spring images (from April to June) for the 12 years. The significance of these trends was assessed as explained in the preceding paragraph, and the trend values are grouped in the previously defined four classes.
3.2.2. BFAST, breakpoints detection
Futhermore, BFAST was then used to extract a linear trend with a breakpoint for each pixel. The factor (h) defining the minimum distance between detectable breaks was set to 0.10, meaning there was at least one complete phenological cycle between two breakpoints. For each of the MODIS pixels at site 1, we extracted the date and the magnitude of the major breakpoint detected. A positive magnitude value indicates an abrupt increase in activity, and a negative magnitude value indicates an abrupt decrease in activity, possibly due to clear cutting. shows the BFAST decomposition of a NDVI time series over the 2000–2010 period, for a single pixel, with the major breakpoint detected.
3.3. Comparison of the two methods
To make it possible to compare the two methods, the slopes of the trends calculated with the two approaches were standardized by dividing the values by their standard error, after which the coefficients of determination and significance levels were used to quantify their statistical relationship. Class values were used to build error matrices to analyze their correspondence level.
3.4. Validation procedure
The phenological method based on the SG indicator was validated using the silver fir stands. It was applied to silver fir stands located in the Pyrenees (site 2 in our study). We analyzed the linear relationship between SG indicator values derived from the MODIS images and in situ observations of the condition of the trees obtained using the ARCHI diagnostic method.
The first difficulty we faced was the mismatched spatial scales of the two informations to compare (Liang, Schwartz, and Fei Citation2011). Ground observations of stand status generally concern individual trees in small plots. For example, the French Department of Health Forest (DSF) set up a network based on the systematic observation of 20 trees per plot. Moreover, it has been shown that diffuse forest dieback, usually observed in our study area, is more difficult to detect than dense continuous damage (Deshayes et al. Citation2006).
Recently, many validation procedures have been implemented to validate MODIS-derived products or analytic. Authors generally agree on the difficulty involved in validating MODIS data products by comparing them with field measurements. To allow the up scaling of ground observations, some authors use satellite images at an intermediate resolution, such as Landsat (Fisher and Mustard Citation2007), while others develop survey procedure adapted to the resolution of the images to validate (De Kauwe et al. Citation2011; Fang, Wei, and Liang Citation2012).
Here, sampling strategy was adjusted, first, to take into account enough reference pixels to reflect the variability of indicators derived from MODIS images, then to select, in each pixel, sufficient trees to represent the status of the stand. This trees health status was qualified using the ARCHI method presented in the paragraph 3.4.2.
3.4.1. Sampling design
To define the reference pixels, we set up an oriented-type sampling. An equal number of pixels were selected for each class of SG trends, in order to reflect its variability. Only pixels that were located entirely within the boundaries of forest silver fir stands were picked out. Three checks were implemented: (1) Areas with a significant risk of human intervention such as clear cutting were excluded by analyzing sudden decreases in the NDVI profiles. (2) After checking using ortho-photographs, only pixels corresponding to dense mature forest were selected. (3) Finally, to facilitate access to the plots, areas with a slope greater than 45 degrees and a distance to a forestry road of more than 1 kilometer were excluded.
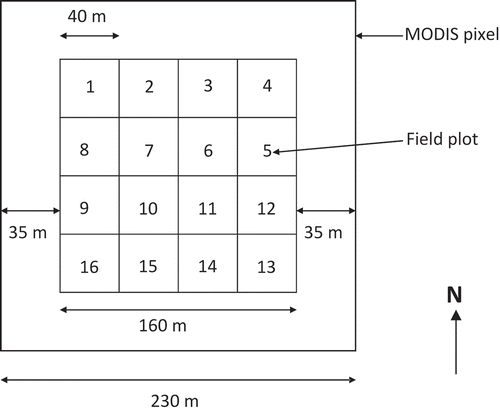
The sampling had to assess the health status of the trees in an entire MODIS pixel. Sampling thus required choosing a substantial number of homogeneously spatially distributed trees. Given our limited resources for field observations due to topographic and climatic constraints, we were able to sample a total of 27 MODIS pixels. shows the intra-pixel sampling designed to assess the health status of the trees for the whole pixel. An inside buffer of 35 meters was defined to limit hedge effects. Each central area was regularly subdivided in 16 sub-areas. Each sub-area was surveyed, beginning from the centroid localized by GPS. Staring from the center of each field plot, the seven most dominant trees were chosen for observation. A total of 112 trees were observed in each pixel, i.e., a total of 3024 trees in the whole study area.
3.4.2. ARCHI observations
The goal of the ARCHI observation campaign is to provide consistent information about tree health state. This method is based on the architecture of trees, it uses simple criteria, easily and rapidly observable, which is a prerequisite to survey a large number of trees. By providing information on the developmental sequences of each species, as well as deviations from the normal growth pattern caused by stress, this method based on architecture can be used to diagnose tree health (Rutishauser et al. Citation2011) and for the analysis of the impact of environmental factors on the growth and branching of trees (Barthélémy, Caraglio, and Sabatier Citation2009; Grosfeld, Barthélémy, and Brion Citation1999; Sabatier, Baradat, and Barthelemy Citation2003; Taugourdeau and Sabatier Citation2010).
Observations at different levels of crown architecture inform of two components of decline: symptoms of degradation, especially foliar deficits, branches mortality or abnormal coloration of foliage, and resilience processes (i.e., recovery processes) brought by the type and the vigor of epicormic branches. Then, the combination, in a decision tree, of these criteria allows characterizing the observations in four health status classes: HEAlthy tree, RESilient tree, STRessed tree, and DEAd or dying tree ().
Table 1. Typology of the health status of silver fir as a function of the extent of the symptoms of decline of the crown and/or the recovery process
Originally, the method was designed for oak (Quercus robur L.) (Drénou, Bouvier, and Lemaire Citation2011; Drénou, Bouvier, and Lemaire Citation2012) but has since also been used for silver fir (Giraud Citation2012). Among the many organizational levels of a tree, our observations concerned three levels (see ): (1) the whole tree, (2) the top surface of the crown exposed to the light, and (3) the axes. In silver fir, this entails four types of axes (A1, A2, A3, and A4; ). These axes are arranged in an orderly manner in the tree structure and appear in a precise sequence during the development of the tree. The function of each axis also differs. For example, the A3 axis is essentially concerned with the assimilation of light.
Figure 6. Illustrations of the four main ARCHI type: (a) HEAlthy tree, (b) STRessed tree, (c) RESilient tree, and (d) DEAd or dying tree.
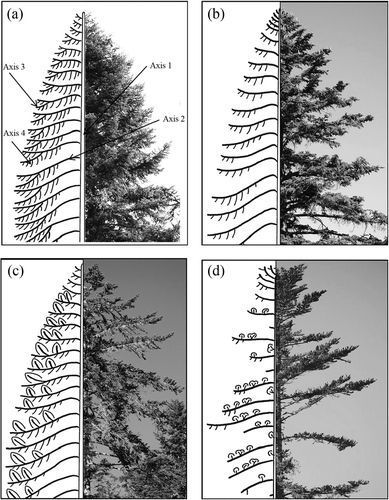
Table 2. Level and type of observations recorded with the ARCHI method
Epicormic branches are not included in the axes described above. An epicormic branch is considered to be vigorous when it presents strong apical dominance (existence of a dominant main axis), strong growth, and absence of (or limited) sexuality (only a few female cones). At the top of the crown, epicormic branches were recorded by the observer when many such branches were present in more than half the A2 axes, and when they covered over more than 25% of the length of these axes.
So, the observation of epicormic branches allow essentially dissociating declining trees with an apparent recovery process (resilient tree) and trees with a loss of vitality without significant recovery processes (stressed tress). In both cases, the photosynthetic activity is less important than a healthy tree. The activity of a dead or dying tree reaches null. At this step of declining, the recovery of trees is impossible. So, we can place the four ARCHI types in order according to their activity capacity. Healthy trees present the most important vitality. Vitality capacity decrease on resilient tree, stressed to reach null on dead or dying trees.
illustrates examples of tree architecture (photography and theoretical representation) of the four main ARCH types.
Each surveyed pixel was characterized by the percentage of healthy trees (% HEAlthy), of resilient trees (% RESilient), of trees under stress (%STRessed), and of dead or dying trees (% DEAd or dying). Theses ARCHI composition metrics allow to estimate the global health state inside a pixel MODIS. These four synthetic metrics are used for the validation of MODIS time series-derived metrics.
3.4.3. Data analysis: relationships between pixel-level MODIS time series-derived metrics and pixel's ARCHI composition metrics
We analyzed the relationships between in situ observations of stand condition (proportions of the four major ARCHI types) with three types of MODIS time series-derived metrics:
(1) SG trends over the period 2000–2011 (phenological approach) | |||||
This first pixel-level metric corresponds to the value of the slope of linear trends of SG values between 2000 and 2011. The hypothesis bellow this metric is that the forest health at the end of the series (ground-based campaigns in spring 2012) reflects 10 years vitality dynamics expressed by 2000–2011 SG trends.
(2) The 12 annual spring greenness values | |||||
For each year in the study period, the linear relationship between the proportions of the main ARCHI types and annual SG values were determined by linear correlations. We will test the hypothesis that ARCHI 2012 survey observations is higher with late years SG values (2009, 2010, and 2011) than with early years (2000, 2001, 2002, …).
(3) MaxSG indicator: maximum SG values of years 2010 and 2011 | |||||
For each pixel, the maximum value of SG for the years 2010 and 2011 is calculated. We can consider that there is a part of variability in the annual SG value linked to the annual climatic conditions and that the forest health state does not greatly change between 2010 and 2011. The proposed indicator, based on the max values for the last two years of the series, reflects more the intrinsic photosynthetic capacity that we must consider. We assumed that the relationship between forest health state (characterized by the ARCHI composition) is better reflected by the 2010–2011 MaxSG than by the annual SG values of these years taken separately. In all cases, the relationships were estimated by linear relations:
The coefficient of determination (r-squared – r 2) gives the strength of the linear relationships tested. The higher is the r 2 value, the stronger is the relationship between MODIS-NDVI derived metrics and ARCHI composition. The comparisons of r 2 from different analysis allow exploring the potential of each of the MODIS-NDVI metrics to monitor the forest health state.
4. Results
4.1. Comparison of the trends processed with the two methods
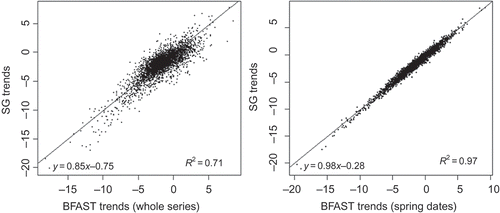
presents the relationships between the slopes of the trends calculated with the two methods, taking the whole series or only the spring season into account. All the coefficients of determination were highly significant (respectively, r 2 = 0.71 and r 2 = 0.97 for the whole series and for spring dates only).
Figure 7. Scatterplots of the standardized slope of the trends processed using spring greenness (x-axis) and BFAST (y-axis) for (a) the whole series and for (b) for spring dates only.
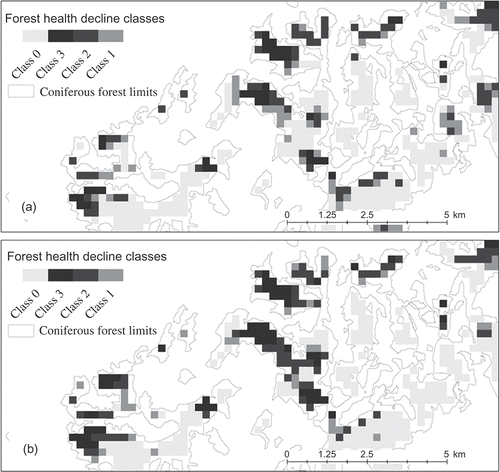
shows an extract of the trend classification map (see section 3.1.1). With both methods, the extent of some areas subject to forest decline areas could be seen, especially class 2 and class 3.
Figure 8. Map of trends (a) produced with the spring greenness method and (b) with the BFAST method (site 1).
The contingency matrices () revealed strong correspondences between the classes produced with the two methods, particularly classes 0 and 3. However, when the whole cycle was taken into account, the correlation between classes 1 and 2 was weak. This could be due to erroneous threshold values or due to the high variability of NDVI values in winter and summer.
Table 3. Contingency matrices between classes of (a) SG and BFAST trends for the whole series and (b) SG and BFAST trends for spring dates only
4.2. Breakpoint detection (site 1)
For every pixel of fir on the first site, a major breakpoint was searched through 2001 to 2009 using BFAST. On the study site, 93.2% of pixels are characterized by the detection of a breakpoint, 71.1% of them present a negative breakpoint, representing a sudden decrease of activity. We focus on these negative breakpoints to analyze their temporal distribution () and annual average magnitudes () during the studied period. Three well-marked periods are highlighted:
– During 2001–2002 period, only a limited number of negative breakpoints were detected. Neither extreme climatic event nor clear-cutting activities were observed. | |||||
– The 2003–2004 period was characterized by a high count of breakpoints, with low mean magnitudes. These numerous breakpoints might be related to the impact of the 2003 summer drought, which occurred until 2004, due to the low reserves-related lack of activity during spring 2004 (Bréda et al. Citation2006). | |||||
– The 2005–2009 period was characterized by both a high count of breakpoints and a high magnitude of them. One of the plausible explanation of this distribution is the important clear-cut activity following the significant degradation of some stands caused by the 2003 summer drought. | |||||
4.3. Validation using ground level ARCHI observations (site 2)
4.3.1. Pixel-level ARCHI indicators
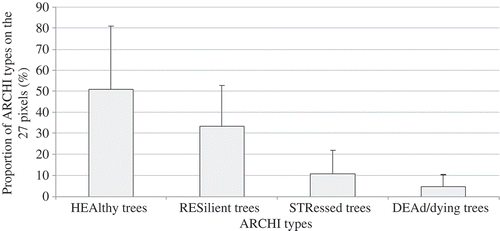
shows the average proportion of healthy trees, resilient tree, stressed trees, and dead or dying trees per pixel. On average, more than half (51%) of all the observed trees were classified as healthy. The proportion of trees classified as resilient was 33% that of the stressed trees was 11%, and that of the dead or dying trees was about 5%. For each of the four main ARCHI types, standard deviations show the variable composition of the pixels studied. For example, the intra-pixel proportion of stressed trees was highly variable, ranging from 0% to 40%.
4.3.2. Relationships between MODIS time series-derived metrics and ARCHI composition
Linear relationships between the ARCHI composition of the 27 pixels studied and the three types of MODIS time series-derived metrics were separately analyzed.
| other | (a) Spring greenness trends over the period 2000–2011 | ||||
As shown in , there was no significant linear relationship between the SG trends in 2000–2011 period and the proportions of the main ARCHI types (low r 2 values).
Figure 11. Relations between proportions of the main ARCHI types and measured spring greenness trends in the period 2000–2011.
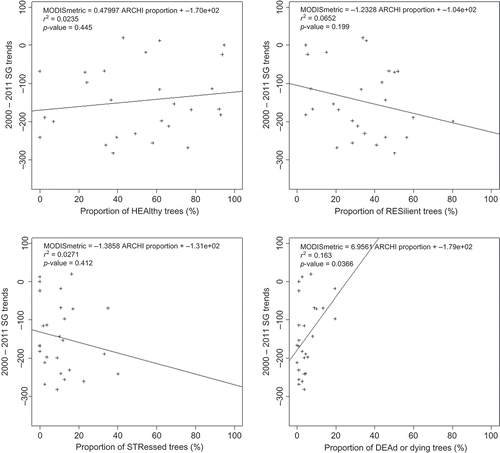
Weak-linear relationships between the dynamics derived from the time series of NDVI images (2000–2011 trends) and the ground level observations can be explained by the few predictive properties of the SG trends. Indeed, the variations of NDVI values may mostly be related to limitations of activity due to climatic limitations during the spring period than the intrinsic activity capacity of stands, related to their health status. Another possible explanation is that the ARCHI observation, even integrating the recovery process of vegetation cannot reflect the global vitality dynamics of stands for 12 years before ground-based observations.
| other | (b) Annual values of the SG indicator | ||||
For each year in the study period, the linear relationship between the proportions of the main ARCHI types and annual SG values were determined by linear correlations ().
Figure 12. Variations in r 2 values between spring greenness and the proportion of main ARCHI types as a function of the year.
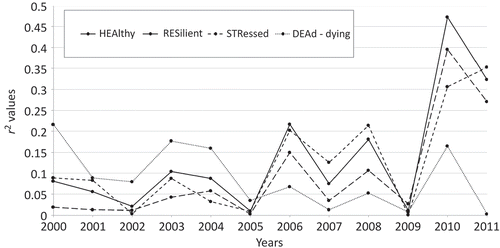
shows the variations in the coefficients of determination (r -squared) according to the year. For the year 2011, there was a significant correlation between the SG and the proportion of healthy, resilient, and stressed tree (respectively r 2 = 0.47, r 2 = 0.39, and r 2 = 0.307) (). Overall, for these three main types, the further we went back in time, the more the relationship between field observations and SG values decreased, until it became almost zero in 2000. However, the relationship between the proportion of dead or dying trees and SG values were very low throughout the study period (r 2 < 0.25). Moreover, very weak relationships on for the year 2009 show the possible inconsistency of the SG metrics bellow particular conditions for some years. Exploring the impact of annual climatic condition might allow for the estimation of the pertinence use of annual metrics.
| other | (c) MaxSG indicator: pixel-level maximum SG values (years 2010–2011) | ||||
Figure 13. Relationships between the proportions of the main ARCHI types and spring greenness values in 2010.
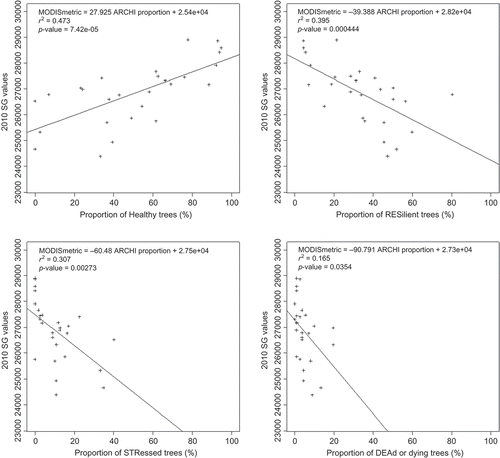
Figure 14. Relationships between the proportion of ARCHI types and the MaxSG indicator (maximum of SG values of years 2010 and 2011).
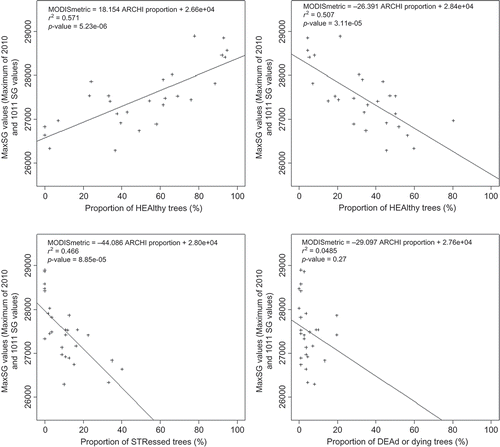
Relationships between the MaxSG indicator and the ARCHI composition are better than the annual values of SG (2010 and 2011 SG values taken separately). shows linear relationships between the MaxSG indicator and proportions of the four ARCHI types. R-squared values for proportions of HEAlthy, RESilient, STRessed, and DEAd or dying trees are respectively 0.571, 0.507, 0.466, and 0.048. Relations are significant, except with the DEAd or dying proportion (p-value = 0.27).
| other | (d) Comparison of relationships strength, according to the types of MODIS time series-derived metrics | ||||
summarizes r 2 values from the relationships between MODIS time series-derived metrics and ARCHI proportions. As presented above, there is no significant relationship between SG trends and ARCHI composition.
Table 4. R 2 values of the relationships between MODIS time series-derived metrics and ARCHI proportions of the four ARCHI type with p-values (*p < 0.05, **p < 0.01, ***p < 0.001)
Several hypotheses are rejected or confirmed: (1) the comparison of SG trends with ARCHI observations cannot allow validating forest vitality dynamics for a 12-year period; (2) Annual values of SG 1 or 2 years before in situ observation campaigns allow for the estimation of the forest health state, and (3) Relationships with MaxSG are better than with individual SG values.
5. Discussion and conclusion
5.1. Trend analysis
When only the NDVI spring series were used, both approaches (SG and BFAST) gave similar results. Differences appeared when the whole series was processed with BFAST. The BFAST method is useful because there is no need for the prior definition of a period of interest to characterize vegetation activity. Phenological metrics, like the start of a growing season or the date of maximum vegetation activity, are known to vary both over time and in space. However, it was difficult to assess the impact of the variability of vegetation activity (and NDVI values) on the measured trends during summer. As a matter of fact, the rate of senescence is highly influenced by annual climatic conditions, particularly in the case of severe drought.
Here, the main interest of using the BFAST is its ability to detect breakpoints, which we used to demonstrate the impact of the exceptional climatic conditions in 2003 on forest stand development. A further study is currently underway, using field references and NDVI time series, to identify clear-cut areas in order to avoid confusion with declining stands. In our study area, 99% of clear cutting is due to forest decline and can be included in class 3 (), but this cannot be generalized to other regions.
5.2. Validation
Satellite images are currently used to estimate growth (Turner et al. Citation2006), tree mortality in stands, (Fraser and Latifovic Citation2005; Meigs, Kennedy, and Cohen Citation2011; Verbesselt et al. Citation2009) or tree defoliation caused by a pathogen (de Beurs and Townsend Citation2008; Townsend et al. Citation2012). But, the validation procedures are very varied and often difficult to implement (Eklundh, Johansson, and Solberg Citation2009). It is frequently reported that quantifying the reduction in leaf area is difficult using MODIS imagery. Conversely, in the context of the analysis of a less-diffuse phenomenon, with high-change magnitude (as clear-cut for example), the relationship between spectral data and in situ measurements is stronger (Hais et al. Citation2009).
In addition, the ARCHI method has various advantages compared to others tree health estimation methodologies. First, ARCHI method is not based on difficult estimations of foliar loss, which helps to mitigate differences of appreciation between observers. On the other hand, the distinction between the stressed trees and resilient trees seems to reflect differences in photosynthetic activity, even if the foliar deficits degrees are the same. So, the ARCHI method provides an additional level of information compared to health inventory methods based on foliar-deficit assessment.
The highlights of the validation procedure implemented in this study are both the use of a method that diagnoses the health status of trees based on a detailed interpretation of the architectural characteristics of the trees, and the development of a sampling procedure that is appropriate for the resolution of MODIS images.
In this study, we assumed a strong relationship between SG vitality trends measured over a period of 12 years and stand health status observed on the ground at the end of the time series (spring 2012). The results showed that linear relationships were weak.
In addition, our results revealed significant relationships between the ARCHI observations and the SG indicator for the years 2011 and 2010, corresponding to vitality estimates a year and 2 years before in situ measurements (spring 2012). Going back in time from the in situ measurement period, there was a marked decrease in the relationship (). The same observation has already been made in the context of predicting mortality of Pinus radiata using MODIS time series (Verbesselt et al. Citation2009) when including ground level observations made 4 years earlier did not improve the predictive strength of their model.
Although the ARCHI method is based on the observation of dynamic processes (symptoms of decline but also signs of return to the normal state of the tree), the relationship between the SG indicator and ARCHI observations was significant only for the years 2010 and 2011, close to the year in which field measurements were made. We can therefore conclude that the ARCHI method cannot express the condition of trees over a period longer than the 2 years. In this period, relationships were stronger using the MaxSG metric which reflects the maximum photosynthetic activity measured during this period. These results confirm that we can establish a link between spring activity measured using MODIS-NDVI time series and architecture of trees estimated with the ARCHI method. Nevertheless, the relationship between the spring greenness indicator and ARCHI observations was poor for other years (2000–2009) suggesting that that the ARCHI method cannot express the condition of trees over a period longer than the 2 years.
Identified relationships allow perspectives for the monitoring of forest health state, particularly by taking into account resilient trees. It remains difficult to validate vitality dynamics observed at medium term (2000–2011 SG trends). For the interpretation of the relationship between these dynamics and climatic variables (precipitation–temperature), the topography (altitude–exposure) or soil water stress (water reserves for example) should give additional information. It would enable us to check if stands whose vitality is decreasing are mostly located in areas of particular topography or limited-water conditions. This has already been reported elsewhere (Jolly et al. Citation2005), and given the high-altitudinal range of our study site, we expect that the effects of the 2003 heat wave on forest stands differed with altitude, low- altitude stands being more affected by drought and hence more vulnerable. These additional studies should contribute to the development of maps of vulnerability intended for forest managers to assess the risk of accentuation of forest decline.
Acknowledgments
This work was supported by the Pyrenees Climate Change Observatory (http://www.opcc-ctp.org), with the participation of Institut du Developpement Forestier (IDF) and Centre Régional de la Propriété Forestière (CRPF) de Midi-Pyrenées. The authors thank Flore Giraud (IDF), Grégory Sajdak (CRPF), Jean Lemaire (IDF), Hermine Gravier (CRPF), and Laurent Burnel (INRA) for field surveys and help in data analysis. We thank the anonymous referees whose careful reviews resulted in a more meaningful analysis, and an improved manuscript.
References
- Allen , C. D. , Macalady , A. K. , Chenchouni , H. , Bachelet , D. , McDowell , N. , Vennetier , M. and Kitzberger , T. 2010 . A Global Overview of Drought and Heat-Induced Tree Mortality Reveals Emerging Climate Change Risks for Forests . Forest Ecology and Management , 259 ( 4 ) : 660 – 684 .
- Asse, D. 2012. Déperissement forestier et changements climatiques: Que nous enseignent les observations récentes de la forêt francaise?, Rapport d'étude, Université Paris Sud – AgroParisTech, 47 p.
- Barthélémy , D. , Caraglio , Y. and Sabatier , S. 2009 . “ Crown architecture of valuable broadleaved species ” . In Valuable broadleaved forests in Europe , Edited by: Spiecker , H. , Hein , S. , Makkonen-Spiecker , K. and Thies , M. Leiden : Brill (European Forest Institute Research Reports, Vol. 22) .
- Boutte , B. and Girard , P. 2008 . Bilan de la santé des forêts en 2007, région méditerranéenne : le point sur quelques dépérissements localisés en région méditerranéenne 10 – 11 . Département de la santé des forêts, Information Technique No. 59,
- Bréda , N. , Huc , R. , Granier , A. and Dreyer , E. 2006 . Temperate Forest Trees and Stands Under Severe Drought: A Review of Ecophysiological Responses, Adaptation Processes and Long-Term Consequences . Annals of Forest Science , 63 ( 6 ) : 625 – 644 .
- Brink , A. B. and Eva , H. D. 2009 . Monitoring 25 Years of Land Cover Change Dynamics in Africa: A Sample Based Remote Sensing Approach . Applied Geography , 29 ( 4 ) : 501 – 512 .
- Chéret , V. , Denux , J. P. , Ortisset , J. P. and Gacherieu , C. 2011 . Utilisation De Séries Temporelles D'images Satellitales Pour Cartographier Le Dépérissement Des Boisements Résineux Du Sud Massif Central . Rendez-Vous Techniques , 31 : 55 – 62 .
- Coppin , P. , Jonckheere , I. , Nackaerts , K. , Muys , B. and Lambin , E. F. 2004 . Review ARTICleDIGITAL Change Detection Methods in Ecosystem Monitoring: A Review . International Journal of Remote Sensing , 25 : 1565 – 1596 .
- de Beurs , K. M. and Townsend , P. A. 2008 . Estimating the Effect of Gypsy Moth Defoliation Using MODIS . Remote Sensing of Environment , 112 ( 10 ) : 3983 – 3990 .
- De Kauwe , M. G. , Disney , M. I. , Quaife , T. , Lewis , P. and Williams , M. 2011 . An Assessment of the MODIS Collection 5 Leaf Area Index Product for a Region of Mixed Coniferous Forest . Remote Sensing of Environment , 115 ( 2 ) : 767 – 780 .
- Deshayes , M. , Guyon , D. , Jeanjean , H. , Stach , N. , Jolly , A. and Hagolle , O. 2006 . The Contribution of Remote Sensing to the Assessment of Drought Effects in Forest Ecosystems . Annals of Forest Science , 63 ( 6 ) : 579 – 595 .
- Drénou , C. , Bouvier , M. and Lemaire , J. 2011 . La Méthode De Diagnostic ARCHI. Application Aux Chênes Pédonculés Dépérissants . Forêt Entreprise , 200 : 4 – 15 .
- Drénou , C. , Bouvier , M. and Lemaire , J. 2012 . Rôles Des Gourmands Dans La Résilience Des Chênes Pédonculés Dépérissants . Forêt Wallonne , 116 : 42 – 55 .
- Eklundh , L. , Johansson , T. and Solberg , S. 2009 . Mapping Insect Defoliation in Scots Pine with MODIS Time-Series Data . Remote Sensing of Environment , 113 ( 7 ) : 1566 – 1573 .
- Fang , H. , Wei , S. and Liang , S. 2012 . Validation of MODIS and CYCLOPES LAI Products Using Global Field Measurement Data . Remote Sensing of Environment , 119 : 43 – 54 .
- Fisher , J. I. and Mustard , J. F. 2007 . Cross-Scalar Satellite Phenology From Ground, Landsat, and MODIS Data . Remote Sensing of Environment , 109 ( 3 ) : 261 – 273 .
- Fraser , R. H. and Latifovic , R. 2005 . Mapping Insect-Induced Tree Defoliation and Mortality Using Coarse Spatial Resolution Satellite Imagery . International Journal of Remote Sensing , 26 ( 1 ) : 193 – 200 .
- Giraud, F. 2012. Suivi du dépérissement du sapin pectiné (Abies alba Mill).” dans les Pyrénées: croisement de deux méthodes, l'architecture et la télédétection, à deux échelles spatiales différentes, Rapport d'étude, ENSSA, Université de Bordeaux 1, 34 p.
- Grosfeld , J. , Barthélémy , D. and Brion , C. 1999 . Architectural Variations of Araucaria Araucana (Molina) K. Koch (Araucariaceae) in Its Natural Habitat . The Evolution of Plant Architecture , : 109 – 122 .
- Hais , M. , Jonášová , M. , Langhammer , J. and Kučera , T. 2009 . Comparison of Two Types of Forest Disturbance Using Multitemporal Landsat TM/ETM+ Imagery and Field Vegetation Data . Remote Sensing of Environment , 113 ( 4 ) : 835 – 845 .
- Hansen , M. C. , Roy , D. P. , Lindquist , E. , Adusei , B. , Justice , C. O. and Altstatt , A. 2008 . A Method for Integrating MODIS and Landsat Data for Systematic Monitoring of Forest Cover and Change in the Congo Basin . Remote Sensing of Environment , 112 ( 5 ) : 2495 – 2513 .
- Huang , C. , Goward , S. N. , Masek , J. G. , Thomas , N. , Zhu , Z. and Vogelmann , J. E. 2010 . An Automated Approach for Reconstructing Recent Forest Disturbance History Using Dense Landsat Time Series Stacks . Remote Sensing of Environment , 114 ( 1 ) : 183 – 198 .
- Huete , A. , Didan , K. , Miura , T. , Rodriguez , E. P. , Gao , X. and Ferriera , L. G. 2002 . Overview of the Radiometric and Biophysical Performance of the MODIS Vegetation Index . Remote Sensing of Environment , 83 : 195 – 213 .
- Jolly , W. M. , Dobbertin , M. , Zimmermann , N. E. and Reichstein , M. 2005 . Divergent Vegetation Growth Responses to the 2003 Heat Wave in the Swiss Alps . Geophysical Research Letters , 32 : 18
- Jönsson , P. and Eklundh , L. 2004 . TIMESAT–a Program for Analyzing Time-Series of Satellite Sensor Data . Computers & Geosciences , 30 ( 8 ) : 833 – 845 .
- Kennedy , R. E. , Yang , Z. and Cohen , W. B. 2010 . Detecting Trends in Forest Disturbance and Recovery Using Yearly Landsat Time Series: 1. LandTrendr – Temporal Segmentation Algorithms . Remote Sensing of Environment , 114 ( 12 ) : 2897 – 2910 .
- Liang , L. , Schwartz , M. D. and Fei , S. 2011 . Validating Satellite Phenology Through Intensive Ground Observation and Landscape Scaling in a Mixed Seasonal Forest . Remote Sensing of Environment , 115 ( 1 ) : 143 – 157 .
- Masek , J. G. , Huang , C. , Wolfe , R. , Cohen , W. , Hall , F. , Kutler , J. and Nelson , P. 2008 . North American Forest Disturbance Mapped from a Decadal Landsat Record . Remote Sensing of Environment , 112 ( 6 ) : 2914 – 2926 .
- Meigs , G. W. , Kennedy , R. E. and Cohen , W. B. 2011 . A Landsat Time Series Approach to Characterize Bark Beetle and Defoliator Impacts on Tree Mortality and Surface Fuels in Conifer Forests . Remote Sensing of Environment , 115 ( 12 ) : 3707 – 3718 .
- Nourtier, M. 2011. La vulnérabilité du Sapin pectiné (Abies Alba Mill.) à la sécheresse en milieu miéditerranéen selon les propriétés hydriques du sol Thesis, Université d'Avignon et des pays de Vaucluse, Avignon, 244 p.
- Pettorelli , N. , Olav Vik , J. , Mysterud , A. , Gaillard , J.-M. , Tucker , C. J. and Stenseth , N. C. 2005 . Using the Satellite-Derived NDVI to Assess Ecological Responses to Environmental Change . Trends in Ecology and Evolution , 20 ( 9 ) : 503 – 510 .
- Rebetez , M. , Mayer , H. , Dupont , O. , Schindler , D. , Gartner , K. , Kropp , J. P. and Menzel , A. 2006 . Heat and Drought 2003 in Europe: A Climate Synthesis . Annals of Forest Science , 63 ( 6 ) : 569 – 577 .
- Reed , B. C. 2006 . Trend Analysis of Time Series Phenology of North America Derived from Satellite Data . GIScience & Remote Sensing of Environment , 43 ( 1 ) : 1 – 15 .
- Rutishauser , E. , Barthélémy , D. , Blanc , L. and Eric-André , N. 2011 . Crown Fragmentation Assessment in Tropical Trees: Method, Insights and Perspectives . Forest Ecology and Management , 261 ( 3 ) : 400 – 407 .
- Sabatier , S. , Baradat , P. and Barthelemy , D. 2003 . Intra- and Interspecific Variations of Polycyclism in Young Trees of Cedrus Atlantica (Endl.) Manetti Ex. Carriere and Cedrus Libani A. Rich (Pinaceae) . Annals of Forest Science , 60 ( 1 ) : 19 – 29 .
- Solberg, S., L. Eklundh, A. K. Gjertsen, T. Johansson, S. Joyce, H. Lange, E. Naesset, H. Olsson, Y. Pang, and A. Solberg. 2007. Testing Remote Sensing Techniques for Monitoring Large Scale Insect Defoliation, ForestSat 2007 Conference, Montpellier, France, 5.
- Taugourdeau, O., and S. Sabatier. 2010. “Limited Plasticity of Shoot Preformation in Response to Light by Understorey Saplings of Common Walnut (Juglans Regia).” AoB Plants (22).
- Townsend , P. A. , Singh , A. , Foster , J. R. , Rehberg , N. J. , Kingdon , C. C. , Eshleman , K. N. and Seagle , S. W. 2012 . A General Landsat Model to Predict Canopy Defoliation in Broadleaf Deciduous Forests . Remote Sensing of Environment , 119 : 255 – 265 .
- Turner , D. P. , Ritts , W. D. , Cohen , W. B. , Gower , S. T. , Running , S. W. , Zhao , M. , Costa , M. H. , Kirschbaum , Al A. , Ham , Jay M. , Saleska , Scott R. and Ahl , Douglas E. 2006 . Evaluation of MODIS NPP and GPP Products Across Multiple Biomes . Remote Sensing of Environment , 102 ( 3–4 ) : 282 – 292 .
- Verbesselt , J. , Hyndman , R. , Newnham , G. and Culvenor , D. 2010 . Detecting Trend and Seasonal Changes in Satellite Image Time Series . Remote Sensing of Environment , 114 ( 1 ) : 106 – 115 .
- Verbesselt , J. , Hyndman , R. , Zeileis , A. and Culvenor , D. 2010 . Phenological Change Detection While Accounting for Abrupt and Gradual Trends in Satellite Image Time Series . Remote Sensing of Environment , 114 : 2970 – 2980 .
- Verbesselt , J. , Robinson , A. , Stone , C. and Culvenor , D. 2009 . Forecasting Tree Mortality Using Change Metrics Derived From MODIS Satellite Data . Forest Ecology and Management , 258 ( 7 ) : 1166 – 1173 .
- Wulder , M. A. , White , J. C. , Alvarez , F. , Han , T. , Rogan , J. and Hawkes , B. 2009 . Characterizing Boreal Forest Wildfire with Multi-Temporal Landsat and LIDAR Data . Remote Sensing of Environment , 113 ( 7 ) : 1540 – 1555 .
