Abstract
Many ecological and environmental applications require time-series data, which are collected with spatial extent from local, regional or continental levels and granularity ranging from fine to coarse spatial resolution. These types of data can be too difficult to collect using typical field surveys, but they can be derived using remote-sensing images and image-processing technologies. The common time-series normalized difference vegetation index (NDVI) data are AVHRR-derived at spatial resolutions of 1 or 8 km, MODIS-derived at 250 m, 500 m, 1 km or 8 km resolutions, and SPOT-VGT imagery at 1 km resolution. Landsat imagery-derived time-series NDVI data are often unavailable for many areas due to the difficulty of acquiring cloud-free images given the temporally infrequent coverage of this sensor. For this study, we used a closest-spectral-fit concept as the basis for a data mining model and developed a data assimilation model in order to derive 16-day time-series NDVI data. In a multidimensional spectral space, if pixel i has the closest reflectance values to pixel j, pixel i is called the closest-spectral-fit of pixel j, and pixels i and j are called closest-spectral-fit pixels. Fifteen Landsat TM images covering northern Michigan were acquired from 22 March 2010 to 1 November 2010, in a 16-day cycle. A cloud-free image is used as the reference image to predict NDVI images for the other 14 dates. The forecasted NDVI data explain 80% variation in the observed NDVI. TM band 4 is forecasted at the same performance level as NDVI, and forecasts of bands 3 and 2 are relatively highly correlated with the forecasts of observed bands. The closest-spectral-fit data assimilation method has the capability to produce historical NDVI data at finer spatial resolution as far back as 1972, which broaden and enhance potential applications to the modeling of environmental and ecological patterns and processes.
1. Introduction
Time-series normalized difference vegetation index (NDVI) data derived from the same satellite sensors are a powerful tool for both ecological and environmental studies. NDVI data have been widely applied to human and environmental interactions, monitoring the effects of hydrological erosion, analyzing climate change and carbon sequestration, assessing forest resources and other natural resources, modeling the interactions between the climate and ecosystems, and monitoring agricultural production (Maselli et al. Citation2003; Meng, Cieszewski, et al. Citation2009; Myneni et al. Citation1997; Nemani et al. Citation2003; Seelan et al. Citation2003; Yang et al. Citation1998; Wang et al. Citation2003). The applications of NDVI as a covariate have contributed to the development of new research fields in trophic interactions, such as coupled vegetation dynamics with biodiversity, animal species distribution, and the movement patterns of animals (Nagendra Citation2001; Hurlbert and Haskell Citation2003; Fairbanks and McGwire Citation2004; Moller and Merila Citation2004). As one of the main vegetation indices, NDVI has played key roles in terrestrial vegetation productivity, ameliorating habitat degradation, the assessment of reductions in biodiversity, and assessment of the fraction of absorbed photosynthetic active radiation that has been proved theoretically and empirically (Pettorelli et al. Citation2006; Sellers et al. Citation1992; Asrar et al. Citation1984). NDVI data enable scientists to differentiate the functional types of ecosystems (Soriano and Paruelo Citation1992; Paruelo, Jobbagy, and Sala Citation2001), model and predict annual net primary productivity, and classify the types of land covers regionally and globally (Knight et al. Citation2006).
Time-series remote-sensing data provide insight into past events and current conditions, and they also provide the basis for dynamic modeling of environmental trajectories, ecological changes, human–environmental interactions, and the related dynamic forecasting. Time-series NDVI data have been applied to the monitoring and analysis of ecosystems and to monitoring the feedback effects of vegetation on local climates (Zhang et al. Citation2003). Reed et al. summarized the main applications and indications of time-series NDVI data for ecological studies (Reed et al. Citation1994). For example, overall productivity can be measured using time-series NDVI data; the presence and amounts of biomass can be derived from the integrated NDVI and inter-annual comparisons of biomass also can be conducted. Time-series NDVI data can be applied to understanding vegetation phenology. The rates of increase and decrease of the NDVI, the dates when growing seasons start, peak, and end, the dates of the annual maximum NDVI, the NDVI values for a given date, and the patterns of the annual changes of NDVI provide dynamic measurements for future ecological studies. A brief summary of NDVI and NDVI derivatives that have been implemented for environmental and ecological time-series explorations and applications is listed in .
Table 1. Potential ecological and environmental applications of time-series NDVI data*
Long-term NDVI data are preferred for environmental and ecological studies. The National Oceanic and Atmospheric Administration's Advanced Very High Resolution Radiometer (NOAA-AVHRR) began in 1981 and has continued to the present time, capturing images at a spatial resolution of 1.09 km. Moderate Resolution Imaging Spectro-Radiometer (MODIS-Terra) data have relatively better quality than the data acquired by NOAA-AVHRR, but they have been available only since 2000 and have resolutions that range from 250 m to 1000 m. The Satellite Pour I'Observation de la Terre-Vegetation (SPOT-VGT) remote-sensing sensor with 1 km resolution was initiated in 1998. Landsat remote sensing began in 1972 with finer spatial resolutions of 60 m and 30 m. However, Landsat-derived NDVI data have not been applied to typical time-series analyses (e.g., 16-day, monthly, seasonal, and yearly) due to the existence of cloudy images.
In addition to the temporal dimension, spatial resolution (i.e., pixel size in remote-sensing data) is another foundation of environmental and ecological phenomena. The spatial resolution, which depends primarily on the Instantaneous Field of View (IFOV) and the distance from the ground to the sensor, is typically included as an explicit variable for ecological analysis especially for spatial pattern study, spatial process modeling, and environmental gradient analysis. Studies in geography, environmental sciences, ecology, and natural resources have recognized the critical roles of spatial resolution, such as effects of pixel size on land-cover classification, meteorological data analysis, and species habitat modeling. In atmospheric and earth sciences, the physical processes that determine local and global patterns are clearly linked (Ahnert Citation1987). Physical and biological oceanographers often relate their findings to the spectrum of physical processes, including circulation patterns in oceanic basins, large gyres, and fine-scale eddies or rips (Steele Citation1978). As we know, in many terrestrial environments, atmospheric and geological influences of tenure are obscured by biological interactions (Clark Citation1985). Vegetation distributions at fine spatial resolution controlled possibly by edaphic or microtopographic factors may influence climate locally and regionally (Wiens Citation1989). For example, global biomass and carbon measurements from space generally use 1 km and 8 km NDVI data derived from MODIS or AVHRR. This coarse spatial resolution mapping of biomass and carbon provides estimates of mean that are more constrained than the averages for entire biomes, but they are not constrained enough, which has been proved in biomass and carbon modeling (Anderson et al. Citation2009; Houghton Citation2005; Poulos Citation2009). When measuring forest biomass and carbon from space, at least we should consider the size of forest disturbances (25–100 m) and the spatial distance (100–200 m) of large trees in order to select the appropriate spatial resolution (e.g., pixel size) and the related remote-sensing data (Houghton Citation2005). Houghton (Citation2005) summarized that both types of variability are important and that measuring biomass should be of the same spatial resolution as the pixel size for measuring disturbance and that the suitable pixel size should, probably, not exceed 100 m.
Is it enough that we analyze ecological and environmental problems using the common, coarse-resolution, NDVI data (e.g., 1 or 8 km spatial resolutions)? It is quite likely that it is not enough. When variations in plant growth and the compositions of species are significant from location to location because of changing physiographic, ecological, and human-mediated factors (e.g., planting, logging, and other land-use changes), time-series NDVI data at finer spatial resolutions are needed to model biome dynamics. As we know, we cannot generalize our analysis beyond spatial extent, and, likewise, we cannot detect any features of patterns and processes below the grain, the size of individual units of observations, without accepting the assumption of scale-independent uniformitarianism of patterns and processes, which is false. No scale-independent uniformitarianism exists in the natural environment (Levin Citation1989). We would like to accept the assumption that spatial heterogeneity and spatial dependence, the two typical characteristics of ecological and environmental phenomena, change in space and time (Meng, Cieszewski, and Madden Citation2009; Meng et al. Citation2007).
In order to address the above challenging question related to remote sensing of environmental and ecological factors, first, we must derive long-term time-series NDVI data with finer spatial resolutions. Compared to current time-series NDVI data, Landsat remote sensing began in 1972, capturing images of the Earth with relatively finer spatial resolutions of 60 m (e.g., Landsat MSS) and 30 m (e.g., Landsat TM and ETM+). Completely cloud-free remotely sensed images are preferred, but they are not always available, since the average cloud coverage for the Earth is about 40%. Fortunately, Landsat sensors typically capture one or more scenes of cloud-free images for a given study area within a given period, such as one year, which gives us the potential to forecast time-series NDVI images by using a cloud-free image as the reference image to remove clouds and shadows of clouds from other images (Meng, Borders, et al. Citation2009).
In the research reported in this paper, we used Landsat TM images to develop a data assimilation model that is capable of predicting 16-day time-series NDVI data at 30 m resolution. We make the following assumptions: (1) for a given study area, one cloud-free Landsat TM image is captured within a period, such as one year and (2) the rest of the Landsat TM images have clouds of different percentages and clouds randomly scattered over the study area. Then, based on the closest-spectral-fit concept (Meng, Borders, et al. Citation2009), we developed a data assimilation model for predicting 16-day NDVI series images. The forecasted Landsat NDVI and the related TM bands 4, 3, and 2 for cloudy images were visually portrayed and quantitatively examined. The forecast performances of NDVI and TM bands 4, 3, and 2 were assessed using cloud-free Landsat TM scenes of path 21, row 29 captured on 23 April 2010, 9 May 2010, and 29 August 2010.
2. Methods
2.1. The closest-spectral-fit data assimilation model
The closest-spectral-fit concept was developed originally for the removal of clouds and shadows of clouds from satellite images and was applied successfully to multi-sensor (e.g., OrbView, Landsat, and MODIS) and multi-temporal remote-sensing images across different terrestrial ecosystems including forest, agriculture, urban, rural, and ocean areas (Meng, Borders, et al. Citation2009). Its objective was to predict spectral values accurately that can be captured by satellite sensors in case there are no clouds. In this research work, we revised and improved the closest-spectral-fit concept and forecasting process in order to predict time-series NDVI values for cloudy images that are obtained by Landsat sensors in the 16-day cycle, which forms the specific 16-day time-series imagery data sets. Given the two most similar pixels at time ki , they will be the most similar pixels at time kj (i ≠ j), which was proved using multi-sensor and multi-temporal remote-sensing data sets (Meng, Borders, et al. Citation2009). This one-step forecast is a one-stage transmission of spatial similarity of spectrum, and it is in accordance with the Markov chain random process. Combining the closest-spectral-fit and Markov chain random process and applying it to time-series remote-sensing data, we can make forecasts at time i + 1 based on available data at i, forecasts at time i + 2 based on the data at time i + 1, and so on till forecasts at time i + n based on data at time i + (n – 1). The next stage prediction only depends on the data of the current stage. We define this time-series forecasts as closest-spectral-fit data assimilation modeling, which is described in detail below using time-series Landsat TM images as examples.
Using one cloud-free Landsat TM image as the reference image and applying the closest-spectral-fit data assimilation model, we predict NDVI data that could be captured on the directly neighboring dates of the reference image. In other words, we applied a given cloud-free image to the closest-spectral-fit data assimilation model to forecast the NDVI of its neighboring cloudy images in a time-series imagery data set; then, we applied the predicted image to the forecast of its neighboring cloudy image within the Landsat TM 16-day-cycle imagery data. First, we identified the pixels of clouds and shadows of clouds in a cloudy image, and then, in a cloud-free image, we located their corresponding pixels that were location-based one-to-one counterparts. Given these corresponding pixels in the cloud-free image, we applied the closest-spectral-fit concept in order to identify their closest-spectral-fit counterpart pixels and build the closest-spectral-fit relationship in the cloud-free image. Then, we transferred this closest-spectral-fit relationship between pixels from the cloud-free image to the cloudy image, and the reflectance values of cloudy pixels were determined by the values of the cloud-free pixels that were the closest-spectral-fit to the cloudy pixels ().
Figure 1. A graphical model for one-step forecasting of 16-day time-series NDVI data.
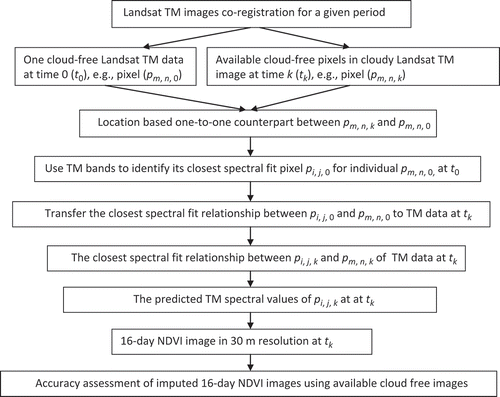
To implement the closest-spectral-fit data assimilation model and to test its robustness for time-series NDVI data forecasts, 15 TM images (path 21, row 29 covering northern Michigan), captured from 22 March 2010 to 1 November 2010 spanning vegetation growing season, with different coverage levels of clouds were applied to this research (). The steps associated with the above time-series NDVI data forecast method are as follows:
| 1. | Visually examine the cloud coverage of time-series Landsat TM images for a study area. For example, use the cloud percentage information provided at the U.S. Geological Survey (USGS) Global Visualization Viewers, the USGS Earth Resources Observation and Science Center to identify a cloud-free image and the cloud-coverage levels of the rest of the images captured in a given period. Then, download Landsat TM series images for an interesting period and a study area. | ||||
| 2. | Use a cloud-free image as the reference image and co-register the other Landsat TM images to it. It is important to minimize the root mean square error (RMSE) of co-registration, and, for example, to make sure that RMSE is around 15 m (e.g., the size of a half pixel). Convert digital numbers to top of atmosphere reflectance, and, in the process of image computation, reflectance values are converted to 8 bits in order to save memory and computation cost. These byte data are also used for additional assessment of predictions of bands and NDVI. | ||||
| 3. | Set up 16-day time-series TM data sets. Use a cloud-free TM image as the reference image and entitle it as image t 0 in order to differentiate it from other cloudy images, which are assigned as image tk following the time sequence, such as k = 1, 2, 3, …, 22 for Landsat TM in a year. Pixels within this cloud-free image are saved in a database in which an individual pixel is pm , n, 0, where m and n are pixel locations, and 0 indicates that it is a cloud-free image. Pixels of other images, tk , are saved in another database where pixels are recorded pm, n, k , where k is determined for the time sequence as mentioned earlier. Then, we need to establish a location-based one-to-one correspondence between the pixels in the cloud-free image, t 0, and the cloud-free pixels within cloudy images, tk . | ||||
| 4. | Establish location-based one-to-one counterparts between co-registrated images. For example, use the cloud-free image t 0 and one of its directly neighboring cloudy images t 1 to start the forecast. Establish a location-based one-to-one counterpart data set between the pixels pm, n , 0 (e.g., pixels within the cloud-free image t 0) and the pixels pm, n , 1 (e.g., those cloud-free pixels within the cloudy images t 1). All the counterparts are recorded accordingly. Meng, Borders, et al. (Citation2009) detailed the procedures for the identification of cloudy pixels and cloud-free pixels. | ||||
| 5. | Determine pairs of pixels that are most similar in spectrum by analyzing closest-spectral-fit one-to-one counterpart relationships within the cloud-free image. Apply the pixels pm, n , 0 recorded in the location-based one-to-one counterpart data set to the cloud-free image t 0; for any pixel pm , n, 0 that does not locate at (m, n), determine the closest-spectral-fit pixel pi , j, 0 of pixel pm , n, 0. In other words, determine the closest-spectral-fit one-to-one counterpart relationship between pixels pm , n, 0 and the rest of the pixels within the cloud-free image. Then, the location relationships of the closest-spectral-fit one-to-one counterparts are recorded and are applied to the image t 1 in the next step. In this research, we applied the closest-spectral-fit concept by using a Euclidian distance metric to quantify the pixels’ spectral difference in Landsat TM bands 4, 3, and 2. The smallest Euclidian distance identified the closest-spectral-fit relationship between pixels. | ||||
| 6. | Transfer the relationships of the closest-spectral-fit one-to-one counterparts from the cloud-free image t 0 to image t 1. After these relationships are transferred into image t 1, the closest-spectral-fit one-to-one counterparts for pixels pm, n , 1 are established. Based on the closest-spectral-fit one-to-one counterpart relationship between pm, n , 1 and pi, j , 1, then, we use the NDVI values of pixels pm, n , 1 to impute the NDVI values of other pixels pi, j , 1 in image t 1. In other words, in this step, the cloudy pixels pi, j , 1 in the image t 1 are assigned to the NDVI values that are from pixel pm, n , 1, which is the closest-spectral-fit one-to-one counterpart of pixels pi, j , 1 according to the closest-spectral-fit one-to-one counterpart relationship transferred from image t 0 to t 1. | ||||
Table 2. Landsat TM images applied to NDVI time-series derivation
After bands 4, 3, and 2 of image t 1 have been predicted using the above procedure, image t 1 is cloud-free and is used as the reference image to predict image t 2 for the related bands and NDVI by computing the above steps (3) through (6). Likewise, following the closest-spectral-fit data assimilation model, we use predicted image t 2 to predict image t 3, and so on, and we continue this forecast till the prediction of image tn at the end of a study period. We summarized the above time-series NDVI and related TM band forecasting approach into a method flowchart ().
2.2. Landsat TM time-series data set
Fifteen Landsat TM images (path 21, row 29), captured from 22 March 2010 to 1 November 2010, were ordered, downloaded from USGS (), and processed for time-series NDVI forecasts. Cloud coverage of these images is listed, and the average percentage of cloud coverage was 31%. The cloud coverage does not include the shadow areas associated with the clouds in the images. Individual images were identified according to the date they were captured, and, for example, an image captured on 7 April 2010, which had 100% cloud coverage, was named image 20100407. In , images 20100322, 20100509, and 20100829 are cloud-free.
2.3. NDVI forecast and assessment processes
Applying the above time-series NDVI forecasting method, first, we used image 20100322 as the reference image, and 20,000 cloud-free pixels were generated randomly from image 20100407 to forecast the NDVI image on 7 April. Then, we used the predicted image on 7 April as the reference image and the 20,000 cloud-free pixels that were generated randomly from image 20100423 to forecast the NDVI data on 23 April. The above procedure provides the reference data for forecasting the NDVI images at 16-day intervals from 9 May 2010 through 1 November 2010.
Completing the above NDVI imputation approach, we obtained the forecasted image 20100509, which can be applied to check NDVI forecasting accuracy, since we have the true observed image 20100509 that is cloud-free. When we acquired the predicted image 20100423, it was also applied to check NDVI forecasting accuracy, since there was only about 1% of cloudy area in this image. A total of 300,000 randomly generated pixels for the forecasted and observed images were used in assessing the forecasting.
If an image were totally cloudy, we generated the forecasted image by computing the average of its two directly neighboring images. For example, image 20100407 was totally covered by clouds, and the forecasted values of each band of a given pixel in image 20100407 were generated by the mean of the two neighboring images (e.g., images 20100322 and 20100423) in this time-series TM data set. The forecasted image 20100829 can be assessed using the true observed cloud-free image 20100829, in which 300,000 randomly generated pixels were used to evaluate predicted and observed values.
3. Results
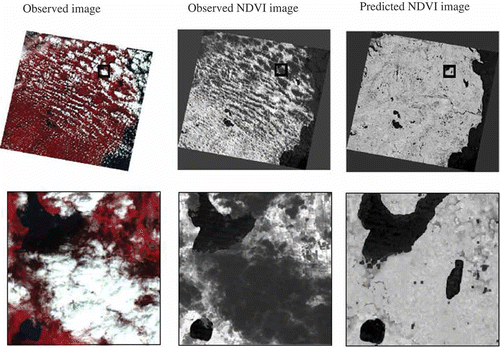
We first examined the forecasted NDVI data visually. The results of both leaf-on and leaf-off images were examined and the forecasted TM images had the features of pattern and structure that were in the observed images ( and ). We called the NDVI computed from Landsat TM images “observed NDVI” in order to distinguish it from the forecasted NDVI by predicting TM band values in clouds and cloud-shadowed areas. Both the forecasted NDVI for image 20100525 and 20100914 indicated that the features of texture, pattern, and structure in the observed images were captured in the predicted NDVI images. The forecasted NDVI image 20100829 was generated by computing the means of forecasted images 20100813 and 20100914. The predicted NDVI image 20100829 showed characteristics that were almost same as those of observed cloud-free image 20100829 ().
Figure 2. TM 20100525: observed versus predicted NDVI image.
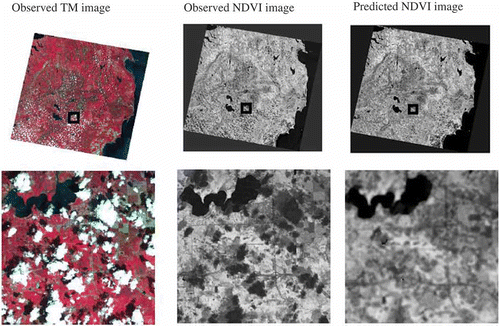
Figure 3. TM 20100914: observed versus predicted NDVI image.
Using image 20100423, which had 1% cloudy area, and cloud-free image 20100509, the accuracy of NDVI forecasts was tested by using the forecasted NDVI being regressed on the observed NDVI. A total of 300,000 randomly sampled pixels across the TM scenes were used in a linear regression analysis. Two types of simple linear models, i.e, with intercept and without intercept, were fitted to further understand the NDVI forecasting results. Also TM bands 4, 3, and 2 were assessed by fitting the two types of simple linear models; the value of R 2 for each model is shown in . We applied the same linear modeling procedure to the cloud-free image 20100829 in order to compare the forecast, the averaged NDVI of forecasted images 20100813 and 20100914, to the observed image 20100829 ().
Figure 4. The observed 20100829 NDVI image versus predicted 20100829 NDVI that was generated using predicted TM 20100813 and 20100914.
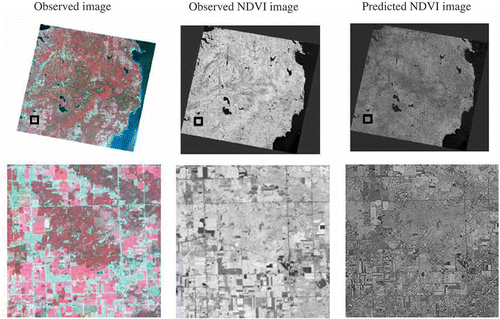
Figure 5. R 2 of linear models regressing the forecast on the observed for bands 4, 3, and 2, and NDVI using 300,000 random pixels in each image 20100423, 20100509, and 20100829.
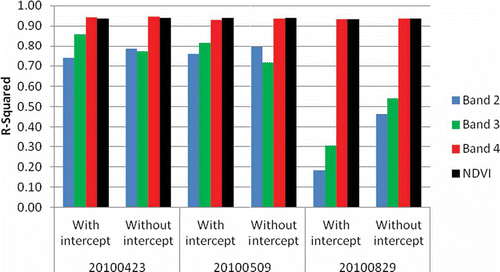
Both NDVI and band 4 forecasts showed high R 2 values of about 0.8 using the simple linear model with an intercept for all three tested TM scenes (i.e., models with intercept in ). We obtained relatively high R 2 values (e.g., between 0.4 and 0.6) for the forecasts of bands 3 and 2 for images 20100423 and 20100509 that were forecasted directly using the closest-spectral-fit data assimilation model. We obtained relatively low R 2 values for the forecasts of bands 3 and 2 for the indirectly forecasted image 20100829 that was computed as the average of pixel values of forecasted images 20100813 and 20100914.
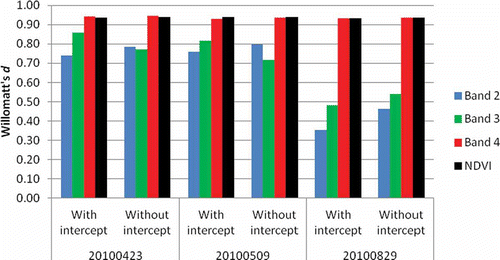
Although cloud courage is significantly different among time-series images used for NDVI prediction, we obtained very similar prediction accuracy, such as RMSE and Willmott's d, index of agreement. Given the range of band values between 0 and 255, the values of RMSE for bands 2, 3, and 4 were generally between 4 and 12 (); given the NDVI range of –1 to 1, the RMSE of NDVI was around 0.06. The spectral-closest-fit method resulted in very low prediction residuals for band 2, band 3, band 4, and NDVI. The index of agreement (d) developed by Willmott, another standardized measure of the degree of model prediction error, varied between 0 and 1, where a value of 1 indicates a perfect match between the predicted and observed values, and 0 indicates no agreement at all (Willmott Citation1981). The d values that were close to 1 indicated that we had very good predictions for both NDVI and band 4, and the d values for the forecasts of bands 2 and 3 for image 20100829 were relatively low (). We also calculated the percentage of mean prediction residuals of the mean observed values of bands 2, 3, 4, and NDVI; the percentage was all less than 6%. The forecasted image 20100829 was generated using the predicted images 20100813 and 20100914, which had relatively good predictions of bands 2 and 3. In other words, the errors of bands 2 and 3 in image 20100829 could be enlarged a little bit by the combination of uncertainty in both predicted images 20100813 and 20100914.
Figure 6. RMSE of linear models regressing the forecasted on the observed using 300,000 random pixels in each image 20100423, 20100509, and 20100829.
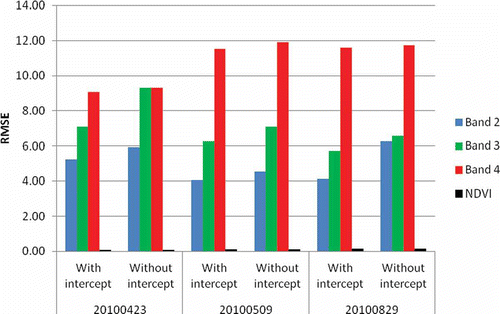
Figure 7. Willmott's index of agreement (d from 0 to 1) for assessment of the forecasted values and the observed values using 300,000 random pixels in each image 20100423, 20100509, and 20100829.
4. Discussions
The closest-spectral-fit, conceptually, is similar to nearest neighbor imputation, a robust data mining algorithm, while the latter only considers the similarity of aspatial characteristics. In this paper, the closest-spectral-fit time-series data assimilation model integrated both the similarities of aspatial characteristics (e.g., spectrum) and spatial similarity between stage one and stage two into a time-series forecasting process. Given the two most similar pixels at time ki , they will be the most similar pixels at time ki +1, which has been proved using multi-sensor and multi-temporal remote-sensing data sets covering different terrestrial areas (Meng, Borders, et al. Citation2009). This one-stage transmission of spatial similarity is in accordance with the Markov chain random process. Using this one-stage transmission-based closest-spectral-fit model, we forecasted NDVI and the related TM bands from stage ki to ki +1, from ki +1 to ki +2, from ki +2 to ki +3, and so on till the end stage of a study period in the 16-day interval of Landsat temporal resolution.
Multi-sensor NDVI continuity can be developed, but the significant inconsistency and uncertainty among different satellite sensors hinder the applications of multi-sensor-derived NDVI data (Leeuwen et al. Citation2006). In this paper, the improved closest-spectral-fit forecast was applied to predicting time-series NDVI data by first predicting TM bands 4 and 3. From the cloud-free areas in cloudy images, we generated 20,000 seed pixels randomly (i.e., about 0.0006% of the total pixels for one Landsat image) and used them as the seed data in conjunction with a cloud-free image to predict the spectral values of the rest of the pixels in cloudy images. In other words, if the cloud-free areas in a given image were not less than 0.001% of the entire scene, we could directly use this improved closest-spectral-fit forecast model to predict NDVI and the related TM bands. At each forecasting step, the seed pixels were used for forecasts in conjunction with a reference image (e.g., a cloud-free image k 0 for the first step imputation or an already predicted image for forecasting its neighboring image in a time-series imagery data set). Applying this closest-spectral-fit data assimilation model, we completed bands 4, 3, 2, and the NDVI prediction within one hour for one TM image, and its computation efficiency was significant compared to the original applications to the removals of clouds and shadows of clouds (Meng, Borders, et al. Citation2009).
When there is one image that is totally cloudy, which is not common, we cannot define the seed pixels (e.g., cloud-free pixels in a cloudy image) for forecasts, and this image and the related NDVI data cannot be directly predicted using this closest-spectral-fit data assimilation model. We used its two directly-neighboring images (i.e., the ones captured before and after this image in a time-series imagery data set) to generate the average spectral values of individual pixels that form a whole TM image, and then, the NDVI values were computed. This indirect forecasting approach resulted in high R 2 values, high d values, and low values of RMSE and mean residual percent for both NDVI and TM band 4. This indirect forecasting approach had low R 2 values and low d values for predictions of bands 3 and 2 compared to the direct forecasting approach using the closest-spectral-fit data assimilation model. We had to improve the forecasting method for a totally cloudy image, although it is not common, and the NDVI values were forecasted successfully.
A linear model fitted between the forecasted and observed values often is used to check the prediction performance, for which either a linear model with intercept or a linear model without intercept is sometimes applied. In this paper, both models were applied, but we examined the forecasting performance using the models with intercepts, although the models without intercepts resulted in higher R 2 values, i.e. close to 1 (). The R 2values in the linear models without intercepts did not really indicate the real forecasting performance. For example, RMSE values of the models without intercept resulted in larger error values compared to those of the models with intercept (), which indicated that the R 2 values in the models without intercepts were not reliable. Statistically, linear models without intercepts are appropriate only when the mean of the response variable is 0 or very close to 0. A linear model without intercept actually is fitted by forcing the mean of the response to be 0. In other words, a linear model without intercept is built on the assumption that its response varies on both sides of 0 with a mean of 0. More detailed explanations can be found in general statistical books, such as the one published by Abraham and Ledolter (Citation2006). Since the average of the response variable is not 0 and the hidden assumption is violated, we cannot use this type of model to regress the predicted image onto the observed image for performance assessment of prediction.
Landsat ETM+ reflectance can be predicted by fusing the MODIS land surface characterization product and Landsat ETM+ data (Roy et al. Citation2008). The most accurate prediction provided by Roy et al. was the near infrared (NIR) forecasts, and the mean NIR prediction residuals are 9%, 12%, and 14% of the mean NIR reflectance for three different images (Roy et al. Citation2008). The closest-spectral-fit data assimilation model resulted in the mean prediction residuals being less than 6% of the mean observed values of bands 2, 3, 4, and the forecasted NDVI. The closest-spectral-fit assimilation model is comparable to Roy's fusing MODIS and ETM+ method in forecasting accuracy. A comprehensive comparison between the closest-spectral-fit and Roy's fusing MODIS and ETM+ could be an interesting topic for next study.
5. Conclusions
This paper presented a novel time-series NDVI forecasting model, based on the closest-spectral-fit concept, in order to obtain long-term NDVI time-series data at fine spatial resolutions. Time-series NDVI data are widely applied to identifying, collecting, and detailing biophysical characteristics and processes of climate, land cover, habitats, and ecosystems, predicting species distribution and spatial variability, and detecting ecological footprints and human–environmental interactions. However, the applications of current NDVI data at coarse spatial resolutions to environmental or ecological studies could not generalize any pattern or process below these coarse resolutions. The high R 2 values between the forecasted and observed NDVI data showed this closest-spectral-fit data assimilation model is appropriate for generating time-series NDVI data at 30 m resolution for environmental and ecological applications. Applying this NDVI forecasting method, we can derive historical NDVI data beginning with the launch of Landsat in1972, which provides about 28 more years of historical NDVI data than the MODIS sensors. These time-series NDVI data provide additional historical records at finer resolutions for environmental and ecological studies, while current analyses typically use satellite images at 1, 8, or 16 km coarse spatial resolutions. The NDVI data at 30 m resolution have the potential to provide insights concerning human–environmental interactions, such as local land–water interactions and relationships between climate and land-use land-cover changes. Using these fine-spatial-resolution NDVI data, long-term time-series profiles for ecological and environmental variables can be computed in order to conduct 16-day, monthly, seasonal, and yearly studies (). These time-series NDVI profiles potentially could reveal the dynamics of ecosystems that may not be explored in current research that uses raw-resolution AVHRR or MODIS data.
The strength of this long-term time-series NDVI forecasting is that it is robust and is easy to understand and implement. The method is based on a closest-spectral-fit concept and is revised and improved methodologically to meet the requirements of time-series NDVI forecasts and Landsat band predictions. This closest-spectral-fit data assimilation model is nonparametric and robust and can be applied to other remote-sensing sensors for time-series NDVI and other ecosystem- or environment-related index forecasts.
Related Research Data
References
- Abraham , B. and Ledolter , J. 2006 . Introduction to Regression Modeling , 445 Belmont, CA: Duxbury Press .
- Ahnert , F. 1987 . Process-Response Models of Denudation at Different Spatial Scales.” . Catena Supplement , 10 ( 1 ) : 31 – 50 .
- Anderson , L. O. , Malhi , Y. , Ladle , R. J. , Aragão , L. E. O. C. , Shimabukuro , Y. , Phillips , O. L. and Baker , T. 2009 . Influence of Landscape Heterogeneity on Spatial Patterns of Wood Productivity, Wood Specific Density and Above Ground Biomass in Amazonia.” . Biogeosciences , 6 ( 9 ) : 1883 – 1902 .
- Asrar , G. , Fuchs , M. , Kanemasu , E. T. and Hatfielf , J. L. 1984 . Estimating Absorbed Photosynthetic Radiation and Leaf Area Index From Spectral Reflectance in Wheat.” . Agronomy Journal , 76 : 300 – 306 .
- Clark , W. C. 1985 . Scales of Climate Impacts.” . Climatic Change , 7 ( 1 ) : 5 – 27 .
- Fairbanks , D. H. K. and McGwire , K. C. 2004 . Patterns of Floristic Richness in Vegetation Communities of California: Regional Scale Analysis with Muti-Temproal NDVI.” . Global Ecological Biogeography , 13 ( 3 ) : 221 – 235 .
- Houghton , R. A. 2005 . Aboveground Forest Biomass and the Global Carbon Balance.” . Global Change Biology , 11 ( 6 ) : 945 – 958 .
- Hurlbert , A. H. and Haskell , J. P. 2003 . The Effect of Energy and Seasonality on Avian Species Richness and Community Composition.” . American Naturalist , 161 ( 1 ) : 83 – 97 .
- Knight , J. F. , Lunetta , R. S. , Ediriwickrema , J. and Khorram , S. 2006 . Regional Scale Land Cover Characterization Using MODIS-NDVI 250 m Multi-Temporal Imagery: A Phenology-Based Approach.” . GIScience and Remote Sensing , 43 ( 1 ) : 1 – 23 .
- Leeuwen , W. J. D. , Orr , B. J. , Marsh , S. E. and Herrrmann , S. M. 2006 . Multi-Sensor NDVI Data Continuity: Uncertainties and Implications for Vegetation Monitoring Applications.” . Remote Sensing of Environment , 100 ( 1 ) : 67 – 81 .
- Levin , S. A. 1989 . “ Challenges in the Development of a Theory of Ecosystem Structure and Function.” . In Perspectives in Ecological Theory , Edited by: Roughgarden, , J. , May , R. M. and Levin, , S. A. 242 – 255 . Princeton , NJ : Princeton University Press .
- Maselli , F. , Romanelli , S. , Bottai , L. and Zipoli , G. 2003 . Use of NOAA-AVHRR NDVI Images for the Estimation of Dynamic Fire Risk in Mediterranean Areas.” . Remote Sensing of Environment , 86 ( 2 ) : 187 – 198 .
- Meng , Q. , Borders , B. E. , Cieszewski , C. J. and Madden , M. 2009 . Closest Spectral Fit for Removing Clouds and Cloud Shadows.” . Photogrammetric Engineering & Remote Sensing , 75 ( 5 ) : 569 – 576 .
- Meng , Q. , Cieszewski , C. J. and Madden , M. 2009 . Large Area Forest Inventory Using Landsat ETM+ : A Geostatistical Approach.” . ISPRS Journal of Photogrammetry and Remote Sensing , 64 ( 1 ) : 27 – 36 .
- Meng , Q. , Cieszewski , C. J. , Madden , M. and Borders , B. E. 2007 . A Linear Mixed-Effects Model of Biomass and Volume of Trees Using Landsat ETM+ Images.” . Forest Ecology and Management , 244 ( 1–3 ) : 93 – 101 .
- Meng , Q. , Cieszewski , C. J. , Strub , M. E. and Borders , B. E. 2009 . Spatial Regression Modeling of Tree Height-Diameter Relationships.” . Canadian Journal of Forest Research , 39 ( 12 ) : 2283 – 2293 .
- Moller , A. P. and Merila , J. 2004 . Analysis and Interpretation of Long-Term Studies Investigating Responses to Climate Change.” . Advances in Ecological Research , 35 : 111 – 130 .
- Myneni , R. B. , Keeling , C. D. , Tucker , C. J. , Asrar , G. and Nemani , R. R. 1997 . Increased Plant Growth in the Northern High Latitudes From 1981–1991.” . Nature , 386 : 698 – 701 .
- Nagendra , H. 2001 . Using Remote Sensing to Assess Biodiversity.” . International Journal of Remote Sensing , 22 ( 12 ) : 2377 – 2400 .
- Nemani , R. R. , Keeling , C. D. , Hashimoto , H. , Jolly , W. M. , Piper , S. C. , Tucker , C. J. , Myneni , R. B. and Running , S. W. 2003 . Climate-Driven Increases in Global Terrestrial Net Primary Production from 1982 to 1999.” . Science , 300 : 1560 – 1563 .
- Paruelo , J. M. , Jobbagy , E. G. and Sala , O. E. 2001 . Current Distribution of Ecosystem Functional Types in Temperate South America.” . Ecosystems , 4 ( 7 ) : 683 – 698 .
- Pettorelli , N. , Vik , J. O. , Mysterud , A. , Gaillard , J. M. , Tucker , C. J. and Stenseth , N. C. 2006 . Using the Satellite-Derived NDVI to Assess Ecological Responses to Environmental Change.” . Trends in Ecology and Evolution , 20 ( 9 ) : 503 – 510 .
- Poulos , H. M. 2009 . Mapping Fuels in the Chihuahuan Desert Horderlands Using Remote Sensing, Geographic Information Systems, and Biophysical Modeling.” . Canadian Journal of Forest Research , 39 ( 10 ) : 1917 – 1927 .
- Reed , B. C. , Brown , J. F. , VanderZee , D. , Loveland , T. R. , Merchant , J. W. and Ohlen , D. O. 1994 . Measuring Phenological Variability from Satellite Imagery.” . Journal of Vegetation Science , 5 ( 5 ) : 703 – 714 .
- Roy , D. P. , Ju , J. , Lewis , P. , Schaaf , C. , Gao , F. , Hansen , M. and Lindquist , E. 2008 . Multi-Temporal MODIS-Landsat Data Fusion for Relative Radiaometric Normalization, Gap Filling, and Prediction of Landsat Data.” . Remote Sensing of Environment , 112 ( 6 ) : 3112 – 3130 .
- Seelan , S. K. , Laguette , S. , Casady , G. M. and Seielstad , G. A. 2003 . Remote Sensing Applications for Precision Agriculture: A Learning Community Approach.” . Remote Sensing of Environment , 88 ( 1–2 ) : 157 – 169 .
- Sellers , P. J. , Berry , J. A. , Collatz , G. J. , Field , C. B. and Hall , F. G. 1992 . Canopy Reflectance, Photosynthesis, and Transpiration. III. A Reanalysis Using Improved Leaf Models and a New Canopy Integration Scheme.” . Remote Sensing of Environment , 42 ( 3 ) : 187 – 216 .
- Soriano , A. and Paruelo , J. M. 1992 . Biozones: Vegetation Units Defined by Functional Characters Identifiable with the Aid of Satellite Sensor Images.” . Global Ecology and Biogeography Letters , 2 ( 3 ) : 82 – 89 .
- Steele , J. , ed. 1978 . Spatial Pattern in Plankton Communities. NATO Conference Series, Series IV: Marine Sciences. 3 vols , New York : Plenum Press .
- Wang , Q. , Watanabe , M. , Hayashi , S. and Murakami , S. 2003 . Using NOAA AVHRR Data to Assess Flood Damage in China.” . Environmental Monitoring and Assessment , 82 ( 2 ) : 19 – 148 .
- Wiens , J. A. 1989 . Spatial Scaling in Ecology.” . Functional Ecology , 3 ( 4 ) : 385 – 397 .
- Willmott , C. J. 1981 . On the Validation of Models.” . Physical Geography , 2 ( 2 ) : 184 – 194 .
- Yang , L. , Wylie , B. K. , Thieszen , L. L. and Reed , B. C. 1998 . An Analysis of Relationships Among Climate Forcing and Time-Integrated NDVI of Grasslands Over the U.S. Northern and Central Great Plains.” . Remote Sensing of Environment , 65 ( 1 ) : 25 – 37 .
- Zhang , J. , Dong , W. , Fu , C. and Wu , L. 2003 . The Influence of Vegetation Cover on Summer Precipitation in China: A Statistical Analysis of NDIV and Climate Data.” . Advances in Atmospheric Science , 20 ( 6 ) : 1002 – 1006 .