Abstract
As a result of the complexity of building shapes and spatial distribution of buildings in urban and suburban areas, building generalization has been one of the most challenging tasks in automated map generalization. The key operator of the generalization is to resolve spatial conflicts inside building polygons caused by a reduction in map scale. Therefore, building simplification eliminates unnecessary details of the building, without the distortion of its original shape. Understanding that map generalization is an intelligent process, we proposed a novel approach for building simplification with raster-based local perception using a backpropagation (BP) neural network (BPNN) model for learning cartographers' knowledge. The model was structured in three layers, an input layer with a 24 × 24 retina, a hidden layer with four nodes, and an output layer with three nodes. Cartographers' expertise, coupled with a square detector designed for the perception of local contexts was presented to the model. In the test, a total of 468 building polygons were simplified, and the mean value of the similarity of building polygons before and after the simplification was 0.9796. The approach not only made the building simplification feasible but also produced satisfactory results.
Introduction
Building simplification is one of many map generalization issues. Its objective is to reduce the number of points of which the polygon is composed with the restriction that the characteristic shape is preserved (Sester Citation2000). Thus, after the simplification, the orientation, convexity, and characteristic rectangular shape and structure must be preserved as much as possible. The area has to be nearly the same, and the location of vision center must be unchanged (Li et al. Citation2009). In the implementation of building simplification, the following rules are usually considered (Lee and Hardy Citation2005):
| 1. | A building must be simplified if it contains one or more sides or segments that are shorter than a specified length. The minimum length for an edge of a building is recommended to be 0.3 mm on the map (Regnauld Citation2001). | ||||
| 2. | The orthogonal shape should be preserved or even enhanced. Thus, corners near 90° should be exactly 90° after the simplification. | ||||
| 3. | A building could be simplified by filling up small corners, closing off or widening isolated small intrusions or extrusions, or by straightening or reducing various stair patterns. Gain and loss in area should be roughly the same in size. | ||||
Considering the rules, researchers developed algorithms for simplification. Du, Ai, and Xu (Citation2004) translated polygon simplification into a combinatorial optimization problem through geographic-feature analysis of the objects. They used a simulated annealing algorithm and carried out a polygon simplification method based on combinatorial optimization. With half-space modeling, Kada and Luo (Citation2006) defined a cell decomposition of the plane by lines approximating parts of the original building outline. Some of the cells were selected to form the output polygon. In progressive simplification algorithms (Guo, Lv, and Zhang Citation2007; Li et al. Citation2009), the building polygons were triangulated into meshes and encoded according to the simplification sequence of two types of operations, edge collapse and vertex split. The minimum unit was defined in the progressive simplification algorithms for building polygons. Haunert and Wolff (Citation2010) presented an optimization approach to simplify sets of building footprints. Each polygonal ring was simplified by selecting a subsequence of its original edges, i.e., a set of shortcuts. The vertices of the simplified ring were defined by intersections of consecutive (and possibly extended) edges in a set of shortcuts. Also, raster-based methods such as morphological operators (Damen, Kreveld, and Spaan 2008) and pattern recognition techniques (Liu et al. Citation2010) have been applied to building simplification.
No matter what approach is considered, one always needs to comprehensively determine how the simplification rules are implemented because map generalization is a creative process that involves human intelligence (Sester Citation2005). Although artificial intelligence (AI) has been widely applied for the analysis of remotely sensed data (Kavzoglu and Reis Citation2008; Guneralp, Filippi, and Hales Citation2013), a few simplification approaches using AI that attempt to imitate cartographic experts have been studied. This is because it is difficult to “distill” the cartographer's knowledge, and to transfer it to a computer-tractable form. However, Wang et al. (Citation2005) combined mathematical morphology with pattern recognition to simplify building polygons. Unfortunately, artificial neural network (ANN) was limited to the pattern recognition. The ANN was not used in the simplification processes. Sester (Citation2005) applied self-organizing maps (SOM) NN for typification of buildings, i.e., a density-preserving reduction of objects. The areal structure of buildings within a settlement area was transformed into a point structure and multiple objects were combined. Again, this was not the simplification for single object. Cheng, Liu, and Li (Citation2013) did apply the SOM NN to building grouping. Furthermore, García-Balboa, Reinoso-Gordo, and Ariza-López (Citation2012) implemented an ANN as a tool for the quality evaluation of road generalization automatically.
In an attempt to further the study of the simplification of buildings, especially complex ones, and to output satisfactory building footprints through the simplification processes, a novel local perception-based algorithm is proposed. With a square detector to collect input samples from raster data, the algorithm learns cartographers' knowledge using a backpropagation (BP) neural network (BPNN).
Combination of cartographers' expertise and BPNN model
A square detector for collecting input data
In the integration of the cartographers' expertise and BPNN model, a square detector for perception of raster-based local contexts converted from vector maps is first designed. The detector () consists of cells of dark gray and white. The dark gray cell means that the cell is inside the building or occupied. The dark gray cells are simplified. The white cell represents a cell that is outside the building or vacant. The gray or white cells identified by the detector are correspondingly projected onto the input layer of the BPNN model. In the current design, the detector is of 24 × 24 or 576 cells. It should be noted that in the BPNN model, the detector is utilized for collecting sample data in training and input data in application.
Figure 1. A square detector with 24 × 24 or 576 cells.
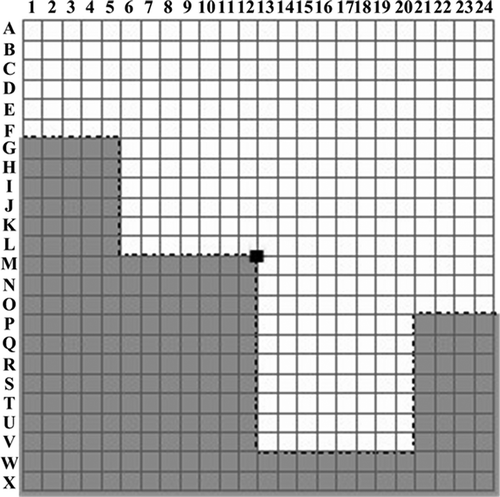
In order to transfer the cartographers' expertise perceived by the detector into the BPNN model, a scheme of two steps is put forward. (1) Buildings are selected from a map. Then their expected simplification boundaries are manually created with vertices via cartographers' expertise. Connection of the vertices forms the anticipated and simplified building boundaries. The vertices (solid dots) and boundaries (dotted lines) are shown in . (2) Then, along the boundaries, input data are collected using the square detector cell (step) by cell (step). Thus, corresponding output data are generated for training as well as application. The cartographers' expertise are recorded or memorized into the retina in the BPNN model (during the training process).
Figure 2. A simplification boundary plotted via cartographers' expertise. Dark grey represents the building to be simplified. The dotted line depicts the expected boundaries after simplification. A 24 × 24 detector is situated on the left side of the building.
Cartographers' expertise for a context
For a certain context, the cartographers' expertise can be grouped into three categories, non-simplification, simple simplification, and complex simplification. In the non-simplification area, boundaries before and after the simplification should be the same. No simplification is carried out. In the area under the simple simplification category, a straightforward simplification operation is implemented. The simplified boundary can deviate from the original one slightly with explicit constraints in deviation. In the area of the complex simplification category, the simplification processing is much more complex and the extracted boundary can deviate from the original one with inexplicit rules.
Mapping the relationships between the input and the output using the detector
The understanding of the categories helps to choose proper simplification operations such as exaggeration, elimination, fitting, or typification (Wang et al. Citation2005). To train the BPNN model, we first construct samples as input/output pairs. Each pair includes an input pattern coupled with an output value. Therefore, it is critical to outline detailed instructions for generating the pairs at each step. Especially, one needs to establish explicit mapping relationships between the input patterns and output units of the sample pairs using the detector of 24 × 24 cells. Once the detector is located on a rasterized map, the area covered for input patterns is divided into two parts, core and peripheral areas. The core area, shown as ![]() or
or ![]() (e.g., Figures 3–5), centered at (12, 12) cell captures the central area. The focus is to learn how to correspond with those simplification rules. The cells of the peripheral area should percept the scene in a larger area than the core area should. Thus, more building characteristics in complex environments are complemented. This enables the BPNN model to simplify complicated scenes.
(e.g., Figures 3–5), centered at (12, 12) cell captures the central area. The focus is to learn how to correspond with those simplification rules. The cells of the peripheral area should percept the scene in a larger area than the core area should. Thus, more building characteristics in complex environments are complemented. This enables the BPNN model to simplify complicated scenes.
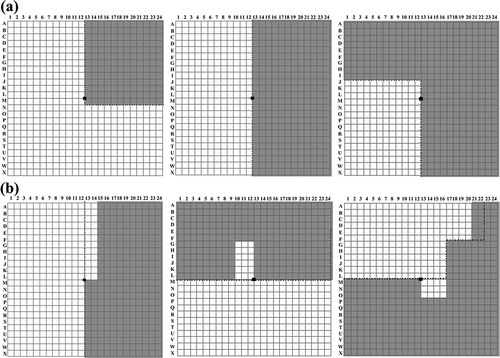
With the detector, the mapping relationships can be divided into three types, Left Turn, Right Turn, and Forward Move. Such mapping relationships mean that each input pattern corresponds to an expected output, a Left Turn, a Right Turn, or a Forward Move. The three kinds of outputs could instruct the detector to enclose the building polygon to be generalized into a new simplified polygon step by step. Each output dictates the next motion direction of the detector, just as an automobile driving along the expect boundary (an enclosed road). Also, the mapping rules between the input and the output must be appropriate. Although the proposed BPNN model is able to not only enclose a building completely along its original outline, but also to simplify it appropriately, we further partition each type into two subtypes, basic or extended. Of the basic subtype, the mapping rules are strictly implemented without simplification, whereas in the extended subtype, such rules could be appropriately relaxed and simplification occurs. Figures 3–5 demonstrate typical input patterns (24 × 24 cell patterns) with corresponding outputs. We assume that the position of the cell at the upper left corner of the detector is represented as A1, i.e., row A and column 1. The occupied cells are coded with ![]() , but the vacant ones are coded with
, but the vacant ones are coded with ![]() . In particular, patterns of basic Left Turn () have consecutively occupied cells within the area of G7 (upper left corner) and R18 (lower right corner). The vacant cells cover the area of M7 (upper left corner) and R12 (lower right corner). The basic Right Turn patterns () have consecutively vacant cells in ranges of G7:L18 and M7:R12. The occupied cells are in the range of M13:R18. The basic Forward Move patterns () are clearly different from the above two basic turns or rules. Furthermore, compared to the basic cases (, and ), small changes are permitted in the extended scenarios (, , and ). , , and are considered as extended Left Turn, Right Turn, and Forward Move, respectively. Thus, basic and extended input patterns are considered, which makes the training process slightly more completed. On the other hand, this shows, indeed, the learning ability of the BPNN model.
. In particular, patterns of basic Left Turn () have consecutively occupied cells within the area of G7 (upper left corner) and R18 (lower right corner). The vacant cells cover the area of M7 (upper left corner) and R12 (lower right corner). The basic Right Turn patterns () have consecutively vacant cells in ranges of G7:L18 and M7:R12. The occupied cells are in the range of M13:R18. The basic Forward Move patterns () are clearly different from the above two basic turns or rules. Furthermore, compared to the basic cases (, and ), small changes are permitted in the extended scenarios (, , and ). , , and are considered as extended Left Turn, Right Turn, and Forward Move, respectively. Thus, basic and extended input patterns are considered, which makes the training process slightly more completed. On the other hand, this shows, indeed, the learning ability of the BPNN model.
Figure 3. Basic (a) and extended (b) left turns.
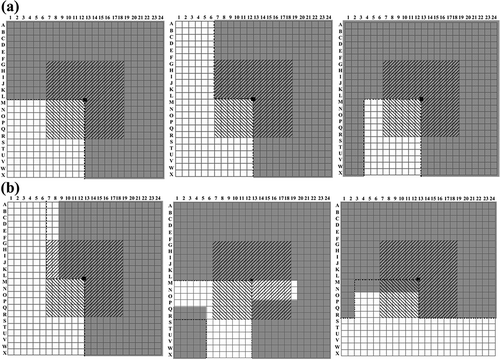
Figure 4. Basic (a) and extended (b) right turns.
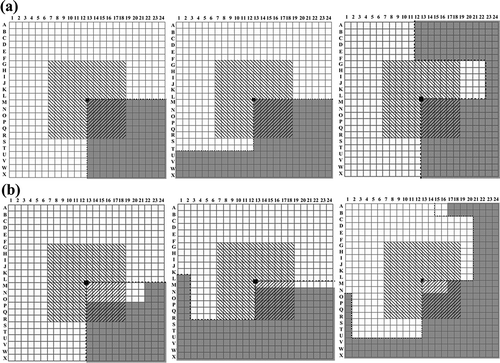
Figure 5. Basic (a) and extended (b) forward moves.
In summary, the mapped relationships actually indicate what should be the reasonable or an anticipated output for a certain input pattern, rather than what kind of operators (such as fitting, typification, exaggeration, or elimination) should be performed by the BPNN model. For example, as illustrated in , starting from the first vertex of the boundary formed by the ordered vertices generated according to the Cartographers' Expertise for a Context, where the center of the detector is first located, we could move (drive) the detector step by step along the boundary. At each step, an input pattern is collected by the detector; and the output is given via the mapping relationships. The drive stops when the center returns to the starting point. In this way, rich sample data could be well generated.
BPNN and training of the BPNN model for simplification
A three-layered feed-forward NN model () trained using a BP algorithm is proposed to learn the mapping relationships discussed above. Specifically, the input layer consists of a 24 × 24 two-dimensional “retina” that receives input from the detector with 24 × 24 cells. Each unit in the input retina is fully connected to a layer of four hidden nodes that are, in turn, fully connected to the output layer with three nodes. The output nodes represent a Left Turn, Right Turn, and Forward Move, respectively. The output layer or vector is a representation of the motion direction of the detector relative to the current position on the raster map.
Overall, the BPNN model is trained with a set of input/output pairs from the sample data set that has been constructed according to the mapping relationships between the input and output patterns. During the training phase, each sample is fed to the BPNN model and the weights are updated using the back propagation algorithm. This process continues until the termination condition is satisfied. The training is detailed next.
The training data set contains input/output pairs, i.e.
, where
is the pth input vector, and
is the pth expected output vector. Parameter settings used in the training are given in . The training process includes
Table 1. Parameter settings in training
| 1. | Initialize the maximum number of iterations | ||||
| 2. | Set | ||||
| 3. | Select a pair of | ||||
| 4. | Propagate the input vector forward through the BPNN model, and calculate the output:
| ||||
| 5. | Calculate the error | ||||
| 6. | Propagate the sensitivities
| ||||
| 7. | Update weights of the output and hidden layers:
| ||||
| 8. | If | ||||
| 9. | Calculate the summary error | ||||
| 10. | If | ||||
| 11. | If | ||||
| 12. | End. | ||||
In addition, the desired output units are denoted by (1, 0, 0), (0, 1, 0) or (0, 0, 1), corresponding to the Left Turn, Forward Move, or Right Turn, respectively. Each element's value in the actual output vector is a floating decimal number ranging from 0.0 to 1.0. The maximum value of the three elements determines the output heading. For example, the maximum value of an actual output vector (0.000000, 0.999939, 0.000070) is 0.999939 or the second element. The output indicates a Right Turn. In case the actual output result is not the same as the desired output, an erroneous output occurs.
Quantification of changes of geometric characteristics
In the assessment of BPNN results, a comparison of changes in building polygons before and after the simplification also is made. The geometric characteristic of a building polygon is described with shape, area, and orientation (Bian et al. Citation2008). Also, the characteristics of shape and orientation must be preserved as much as possible before and after the simplification. The degrees in similarity for characteristic factors between a pair of polygons before and after the simplification are defined and computed as follows. In the following calculation, a polygon is assumed to have vertices,
. Also, a shape ratio is defined as
(1) Similarity in shape: It represents the change of the shape of a building polygon before and after the simplification. The similarity consists of two weighted ratios. First, the shape ratio is | |||||
(2) Similarity in area: It denotes the change of area of a building polygon before and after the simplification. The similarity in area is defined as | |||||
(3) Similarity in orientation: It represents the change of orientation of a building polygon before and after the simplification. It is defined as | |||||
(4) Similarity in comprehensiveness: It shows the change of | |||||
Results
Vector to raster conversion
As the source maps can be in a vector format, the presented algorithm is designed for raster-based data set. Thus, an algorithm for on-the-fly local rasterization is developed in ESRI/ArcEngine® (Environmental Systems Research Institute, Inc., RedLands, CA, USA). First, the MBR of the building polygon to be simplified is computed. The angle between the long side and the horizontal axis of the coordinate system is determined. Then, the polygon is rotated with the angle, to make the long side parallel to the horizontal axis. Finally, the polygon is rasterized. Therefore, the source maps are locally rasterized on-the-fly.
Collecting samples for training
As outlined in “Combination of the Cartographers' Expertise and Detector” section, the process of collecting training samples can divided into two steps. (1) A new point shapefile is created in ESRI/ArcCatalog®. The layer of building to be generalized and the new point shapefile are added to the data view in ESRI/ArcMap®. Then, a new field named “OUTPUT” is added to the attribute table of the new shapefile. The expected output values are stored in the field. Finally, based on the building layer, via the mapped relationships between the input and the output, points representing expected vertices are orderly added to the new shapefile in the ArcMap®/Editor Toolbar, meanwhile the corresponding value of the “OUTPUT” field is edited as Left Turn, Right Turn, or Move Forward. After finishing the construction of the new point shapefile, a sample data set is created. (2) Along the expected boundaries formed by the ordered points in the new point shapefile, the corresponding cell values from the raster data set and within the detector were read step (cell) by step (cell), which was produced with the on-the-fly rasterization method. In this way, thousands of training samples are collected, which covers as many simplification situations as possible. In the training process of this study, a total of 30,902 input/output pairs have been collected from 333 building polygons. There were 1027 Left Turns, 1081 Right Turns, and 28,794 Forward Moves. The related root mean square errors (RMSEs) of the training were 0.0084, 0.0058, and 0.0015, respectively. Therefore, after training, the BPNN model should recognize a variety of building contexts and can determine whether to simplify (change) or not.
Building simplification using the trained BPNN
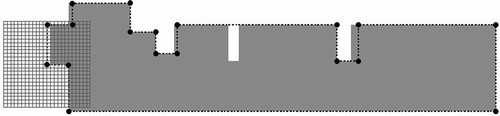
A total of 1073 building polygons, different from those used in training were tested in the assessment of the effectiveness of the simplification of the BPNN model. There are 388,930 input/output pairs consisting of 4050 Left Turns, 7826 Right Turns, and 377,054 Forward Moves. No unexpected output results occurred or no error has been observed. As an example, illustrates a small part of the study area before and after the simplification. Buildings with complex geometric shapes, and various sizes and orientations existed. In general, the geometrical shapes of buildings, after the simplification, met the expectation as outlined by the three rules in the “Introduction” Section.
Figure 6. A BPNN simplification model.
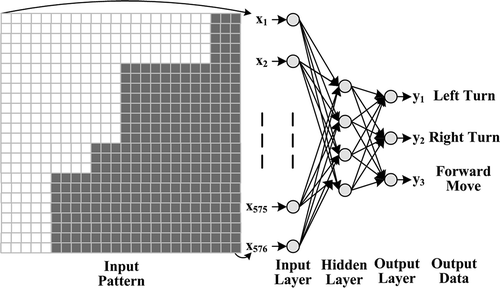
Figure 7. Buildings within a small part of the study area. (a) Before and (b) after the simplification.
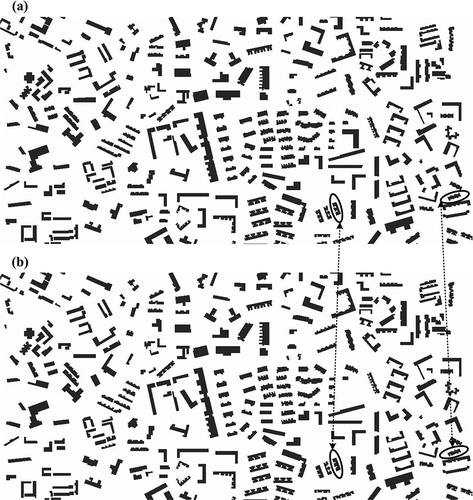
To assess the simplification qualitatively and quantitatively, two buildings were extracted from (marked by two arrows). The buildings before the simplification are shown in dark grey. The dotted line outlined the corresponding building after the simplification (). Almost all long sides (edges) of the build were preserved (Rule #1 in the simplification, “Introduction” section). The geometric shapes were similar before and after the simplification (Rule #2, “Introduction” section). Small corners were filled, and small isolated intrusions and extrusions were closed or widened (Rule #3, “Introduction” section). Before the simplification, the numbers of Left Turns and Right Turns were 13 and 17, respectively. The numbers of Left Turns, Right Turns, and Forward Moves decreased to five and nine after the simplification (). Similarly, before and after the simplification (), the numbers of Left Turns and Right Turns varied from 16 to 8 and 20 to 12, respectively. Of the shape characteristics, the,
,
, and
were 0.9181, 0.9950, 1.0, and 0.9656 in , and 0.9467, 0.9708, 1.0, and 0.9699 in . All values were close to 1.0. Therefore, changes in shape, area, orientation, and comprehensiveness were small after the simplification. The simplified results were satisfactory.
Figure 8. Two buildings extracted from Figure 7. The buildings before the simplification were in dark gray. The dotted lines outlined the buildings after the simplification.
Finally, out of 1073 buildings studied, only 468 buildings were actually simplified. After the simplification, the numbers of Left Turns and Right Turns decreased to 4050 and 7826. The degrees in similarity of the changed buildings before and after the simplification were calculated. Their mean values and standard deviations of the,
,
, and
are tabulated (). The means were very close to 1.0, and the standard deviations were close to zero. The changes before and after the simplification were quite small geometrically. In summary, with the trained BPNN model, the simplified output was qualitatively and quantitatively satisfactory. Also, even though all building sample patterns in testing differed from those in training, the BPNN model still performed well. There was no over-fitting/over-training problem in the model. Thus, the developed model was of the generalization ability.
Table 2. Descriptive statistics of the degrees in similarity
Discussion
Vector or raster data set
Vector data represents the shapes of features precisely and compactly as a set of ordered coordinates with associated attributes. Unfortunately, this study shows that data in vector format are not suitable for the NN-based building simplification. Parallel to the raster-based BPNN model, a vector-based BPNN model has been developed and implemented using direction angle, segment length, and vertex coordinates. However, the vector-based BPNN model could not learn the expert's knowledge well. In the training process, the final minimum mean square error (MSE) was much larger than 0.5. Consequently, the actual results of simplification generated by the vector-based BPNN model were far from expected. Thus, the building footprints in vector format have been converted into raster-format data first. Then, the data were input into the raster-based BPNN in the building simplification.
Determination of the size of a detector
As previously discussed (“Introduction” section), the minimum length for an edge of a building is set to 0.3 mm on an output map. The map in this study is targeted at a scale of 1:10,000. Thus, the minimum length for the edge is 3.0 m in reality. In addition, the cell size of the original raster data or raster data converted from vector data is 0.5 m. As the detector center is situated at the position where the processing occurs, this means that a half of the width of the detector should be greater than 3 m or not smaller than 6 cells. Intuitively, any detector whose size is larger than 12 × 12 could meet the requirement. However, a large detector size could allow the BPNN model to perceive a large spatial extent so that the model can output more comprehensive building outlines after the simplification. Following discussions warrant that the selection of 24 × 24 cells is appropriate.
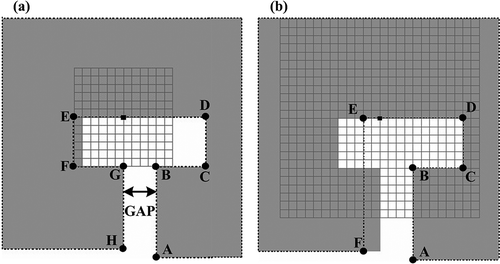
Simplification results from the same scene using detectors of 12 × 12 and 24 × 24 cells were shown (). The width of “GAP” should be widened via cartographers' expertise. Because the detector's size is 12 × 12 cells, the BPNN model could not correctly interpret the cartographers' knowledge. Vertices A, B, C, D, E, F, G, and H constituted the simplified outline. Even though the intrusion was properly exaggerated, the width of “GAP” might be too narrow. Therefore, the simplification might not be desirable. Alternatively, with the detector of 24 × 24 cells (), the BPNN model could perceive a larger spatial extent than what the detector of12 × 12 cells could. This should help the corresponding BPNN model understand cartographers' knowledge better. Thus, the BPNN model with a detector of 24 × 24 cells could interpret that fitting at position E was a nice option and make a small but reasonable alteration. Vertices A, B, C, D, E, and F formed the outline. Two vertices have been simplified or removed. The BPNN model trained and tested with the detector of 24 × 24 cells outperformed the BPNN model trained and tested with the detector of 12 × 12 cells. Intuitively, as the size of detector increased such as 36 × 36 or 48 × 48 cells, the related BPNN model could view even large contexts spatially, and a better output could be anticipated. Unfortunately, as the number of cells increase, the number of input nodes to the corresponding BPNN model could be too many, which causes the BPNN model to become too complicated to be well trained. Consequently, the detector with 24 × 24 cells could be the best choice.
Figure 9. Comparison of two detectors with 12 × 12 cells (a) and 24 × 24 cells (b).
Comparison between the BPNN and the simplification tool of ArcGIS®
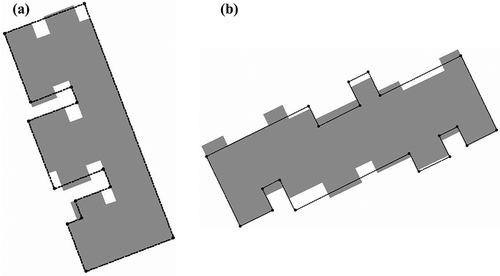
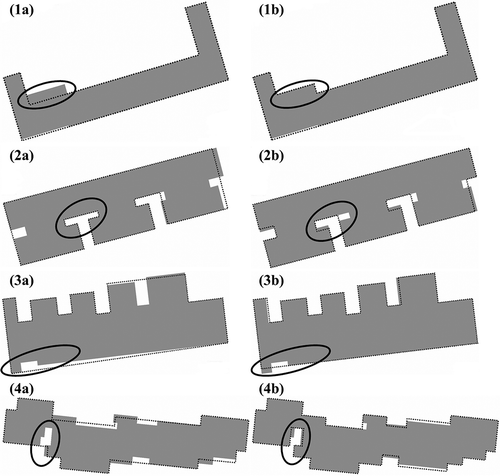
To compare this BPNN model with other methods for building simplification, we used the Simplify Building Tool in ESRI/ArcGIS® to simplify the same buildings. The mean value of from the ArcGIS® was 0.9747, which is very close to the mean value, 0.9796, of the BPNN model. However, the simplification of the BPNN model could be sometimes better than that of the ArcGIS® as shown in . In the figure, the shaded areas were the original building footprints, and dotted lines were the simplified building outlines. The BPNN model generated less area change than the ArcGIS® did ((1a) c.f. (1b). The BPNN model ((2b) removed some small concave components better than the ArcGIS® did ((2a). The BPNN model preserved the orthogonal shape better than ArcGIS® ((3a) c.f. (3b). Finally; the BPNN model dealt with a complex concave component better than the ArcGIS® did ((4a) c.f. (4b). Therefore, the developed BPNN model sometimes outperformed the ArcGIS® building simplification.
Figure 10. Comparison of simplification results generated by ESRI/ArcGIS® (a) and BPNN model (b).
Commonality of the BPNN
Even though input building footprints are at the scale of 1:5000 and the targeted output at the scale of 1:10,000, this proposed BPNN model is applicable to other map scales. With the consideration of the minimum size of a geometric element of a building and the map accuracy, the smallest visual object (SVO), is typically set to 0.1 mm in map size (Wang et al. Citation2005). With the assumption that the scale of an input map is
, the cell size of raster data converted from vector,
, is
. When the source vector maps are at a scale of 1:5000, then
and
m. If the scale of a source map is 1:10,000, then
m. Therefore, the cell size of the raster converted varies accordingly as the scale of the source map changes. The variable cell size makes the detector of 24 × 24 cells applicable to other map scales.
Conclusion
Different from traditional methods for map generalization, a novel nonlinear algorithm in building simplification was developed. The algorithm was based on local perception that combines the BPNN and cartographers' expertise. To merge cartographers' expertise into the BPNN model, we designed a raster-based detector for the collection of input that is related to particular types of outputs, Left Turn, Right Turn, or Forward Move. Thus, the relationship between the input and output pairs was established. After the training of the BPNN with the input/output pairs, the BPNN model was applied to simplifying various types of buildings. Results showed that the simplification rules have been well complied with. Also, the model could perform a comprehensive simplification process with reasonable choices of simplification operations (such as exaggeration, elimination, fitting, or typification) by cognizing present scenarios intelligently. Therefore, a variety of scenarios for the simplification operations have not only been learned by the model using the established input/output relationships, but the relationships were also well executed in application. Consequently, the simplification results were very encouraging and satisfactory. Such results embodied the characteristics of the BPNN model that does not simply memorize the building contexts, but rather extracts and recognizes properties of building patterns. Furthermore, the model could generalize from the already seen scene to make predictions for next move on various types of buildings. In short, the proposed BPNN model possesses the intelligent capability to simplify a variety of building footprints that meet the well-known simplification rules. This study has extended NN techniques to the domain of building generalization.
Acknowledgments
This research was partially funded by the Natural Science Foundation of China (under Grant #41071222) to the University of Electronic Science and Technology, China.
Related Research Data
References
- Bian , L. , Yan , H. , Liu , J. and Chu , Y. 2008 . An Approach to the Calculation of Similarity Degree of a Polygon Before and After Simplification. . Science of Surveying and Mapping , 33 ( 6 ) : 207 – 208 . In Chinese.
- Cheng , B. Y. , Liu , Q. and Li , X. W. 2013 . Intelligent Building Grouping Using a Self-Organizing Map. . Acta Geodaetica Et Cartographica Sinica , 42 ( 2 ) : 290 – 294, 303 . In Chinese.
- Damen, J., M. Kreveld, and B. Spaan, 2008, “High Quality Building Generalization by Extending the Morphological Operators.” In Proceedings of 11th ICA Workshop Generalisation and Multiple RepresentationMontpellier, June 20–21. Montpellier: ICA.
- Du , W. , Ai , T. and Xu , Z. 2004 . A Polygon Simplification Method Based on Combinatorial Optimization. . Geomatics and Information Science of Wuhan University , 29 ( 6 ) : 548 – 550 . In Chinese.
- García-Balboa , J. L. , Reinoso-Gordo , J. F. and Ariza-López , F. J. 2012 . Automated Assessment of Road Generalization Results by Means of an Artificial Neural Network. . GIScience & Remote Sensing , 49 ( 4 ) : 558 – 596 .
- Guneralp , I. , Filippi , A. M. and Hales , B. U. 2013 . River-Flow Boundary Delineation from Digital Aerial Photography and Ancillary Images Using Support Vector Machines. . GIScience & Remote Sensing , 50 ( 1 ) : 1 – 25 .
- Guo , Q. , Lv , X. and Zhang , X. 2007 . Progressive Graphics Simplification Method of Building. . Journal of Geomatics , 32 ( 5 ) : 13 – 15 . In Chinese.
- Haunert , J. H. and Wolff , A. 2010 . “ Optimal and Topologically Safe Simplification of Building Footprints ” . In Proceeding of the 18th ACM SIGSPATIAL International Conference on Advances in Geographic Information Systems , 192 – 201 . San Jose , CA : New York: ACM .
- Kada , M. and Luo , F. 2006 . “ Generalisation of Building Ground Plans Using Half-spaces ” . In Proceedings of the ISPRS Technical Commission IV Symposium, Geospatial Databases for Sustainable Development, International Archives Photogrammetry, Remote Sensing and Spatial Information Sciences , Goa: ISPRS . Goa, 36 (part 4)
- Kavzoglu , T. and Reis , S. 2008 . Performance Analysis of Maximum Likelihood and Artificial Neural Network Classifiers for Training Sets with Mixed Pixels. . GIScience & Remote Sensing , 45 ( 3 ) : 330 – 342 .
- Lee, D., and P. Hardy. 2005, “Automating Generalization-Tools and Models.” In Proceedings of XXII International Cartographic Congress (ICC2005), A Coruňa. http://www.pghardy.net/paul/papers/2005_icc_coruna_lee_hardy.pdf (http://www.pghardy.net/paul/papers/2005_icc_coruna_lee_hardy.pdf) (Accessed: 17 October 2012 ).
- Li , H. , Wang , Y. , Guo , Q. and Han , J. 2009 . “ Progressive Simplification and Transmission of Building Polygons Based on Triangle Meshes. ” . In Proceeding of SPIE, the 6th International Symposium on Digital Earth: Models, Algorithms, and Virtual Reality Edited by: Guo , H. and Wang , C. Vol. 7840 , 784015-1 – 784015-8 . Bellingham, WA: SPIE Beijing
- Liu , P. , Ai , T. , Hu , J. and Cheng , X. 2010 . Building-Polygon Simplification Based on Shape Matching of Prototype Template. . Geomatics and Information Science of Wuhan University , 35 ( 11 ) : 1369 – 1372 . In Chinese.
- Regnauld , N. 2001 . Contextual Building Typification in Automated Map Generalization. . Algorithmica , 30 ( 2 ) : 312 – 333 .
- Sester , M. 2000 . “ Generalization Based on Least Square Adjustment. ” . In Proceedings of XIXth ISPRS Congress, International Archives of Photogrammetry and Remote Sensing, Technical Commission IV: Mapping and Geographic Information Systems Edited by: Fritsch , D. and Molenaar , M. Vol. 33 , 931 – 938 . Amsterdam: ISPRS. (part B4), Amsterdam
- Sester , M. 2005 . Optimization Approaches for Generalization and Data Abstraction. . International Journal of Geographic Information Science , 19 ( 8–9 ) : 871 – 897 .
- Wang , H. , Wu , F. , Zhang , L. and Deng , H. 2005 . The Application of Mathematical Morphology and Pattern Recognition to Building Polygon Simplification. . Acta Geodaetica Et Cartographica Sinica , 34 ( 3 ) : 269 – 276 . In Chinese.