Abstract
We present a method to integrate case-based reasoning (CBR) with object-oriented image classification to classify SPOT images. Images were first segmented into discrete objects at multiple scales. CBR was then used to classify these objects by comparing their geometric shapes, spectral characteristics, and textural measurements with those of the past objects prepared from archived SPOT images and land use data. Once enough past objects were accumulated, this method was able to successfully classify image objects with promising results as demonstrated by a case study of aquaculture land use mapping in coastal areas of Guangdong province, China.
1. Introduction
Object-oriented image classification has recently become one of the most commonly used approaches in image classification (Blaschke Citation2010; Aplin and Smith Citation2011) and it generally outperforms the pixel-based classification in extracting thematic information from remotely sensed data (Blaschke Citation2010; Duro, Franklin, and Dubé Citation2012; Gao Citation2008). There are two major stages in object-based image classification: image segmentation and object classification (Definiens® Citation2009).
In the segmentation stage, image is first segmented into objects at different scales. One of the key issues is to find the optimal segmentation scale through trial-and-error tests, human evaluation, or quantitative studies (e.g., Benz et al. Citation2004; Drăguţ, Tiede, and Levick Citation2010; Frohn and Chaudhary Citation2008; Kim et al. Citation2009; Möller et al. Citation2007). This process is normally time-consuming and tedious as the optimal scale usually varies for different kinds of applications and images (Blaschke Citation2010; Myint et al. Citation2011).
In the classification stage, thematic classes are assigned to the objects using the nearest neighbour or knowledge-based classifiers (Definiens® Citation2009). The nearest neighbour classification starts with selecting training data for each class. Spectral characteristics and textural measurements of the training data are used to determine the spatial clustered location of each specific class in a multiple-dimensional space. The classifier calculates the distance between each object and the individual clustered location. Each object is then assigned to the closest cluster. This classifier has been used in many studies (e.g., Myint et al. Citation2011; Robertson and King Citation2011).
The knowledge-based classifier uses rules to classify images (Lu and Weng Citation2007). Rules are normally extracted from spectral and textural features and other ancillary data. For example, Myint et al. (Citation2011) developed different expert rules to delineate buildings, impervious surface, swimming pools, lakes, and ponds from a QuickBird image. Kass et al. (Citation2011) developed rules based on different texture-based measurements of about half of the image objects and then used these rules to classify the remaining objects. Artificial intelligence methods have been increasingly used in object-based image classification. Classification and regression trees (CART) were used in object-based mapping of vegetation, urban, and rangeland (Laliberte et al. Citation2007; Thomas et al. Citation2003; Yu et al. Citation2006). Duro, Franklin, and Dubé (Citation2012) compared the performance of decision tree, random forest, and support vector machine on pixel-based against object-based image classification of agricultural landscapes. Man-made objects, such as building, bridge, and highway, were also successfully recognized by Inglada (Citation2007) using a supervised learning approach. More artificial intelligence methods are expected to be used in conjunction with object-based image classification (Blaschke Citation2010) as these methods can extract more reliable rules to improve classification accuracy.
In this article, we present a method to integrate another artificial intelligence approach, the case-based reasoning (CBR), into object-based image classification. The CBR uses knowledge derived from past cases to solve new problems (Watson Citation1998). CBR has been used to predict weather change (Jones and Roydhourse Citation1994), combat rangeland pests (Branting et al. Citation1999), examine air pollution (Lekkas et al. Citation1994), and support urban planning (Yeh and Shi 1999) and soil mapping (Shi et al. Citation2004). It has been integrated with pixel-based classifiers to classify multi-temporal synthetic aperture radar (SAR) images (Li and Yeh Citation2004) and Radarsat images (Qian et al. Citation2007). To our knowledge, this research is the first study to integrate CBR into object-based image classification. In this research, images were first segmented into objects at various scales. CBR was used to classify the objects produced at a coarse scale. If not successful, the images of unclassified objects were further segmented at a finer scale. CBR was then used to classify the resulting smaller objects. This hierarchical procedure continues until most image objects were successfully classified at a reasonable scale.
2. Study area, data, and classification scheme
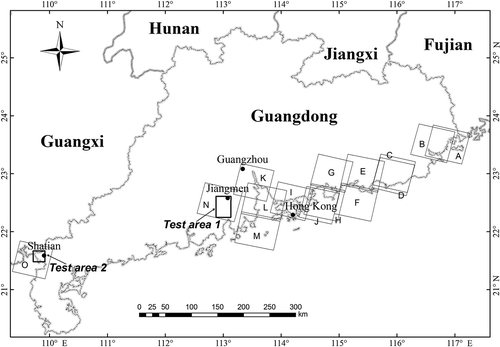
Our study area is located along the coast of Guangdong province, China (). In total, 15 scenes of geometrically rectified SPOT-5 image were used in this study. Thirteen out of these 15 images were acquired for the eastern coastal areas. The other two images were acquired for two test areas (Figure 1), one in the southern (Jiangmen area, 220 km2) and the other in the western coastal area (Shatian, 107 km2). We also used the hydrographical data extracted from the 1:50,000 National Geomatics Database of China in this study.
Figure 1. A map showing our study area. The parallelograms show footprints of the SPOT images used in this study. These images were acquired on (A) 3 December 2003, (B) 5 November 2004, (C) 10 October 2004, (D) 10 October 2004, (E) 16 October 2004, (F) 16 October 2004, (G) 15 October 2004, (H) 23 May 2004, (I) 11 December 2004, (J) 14 September 2004, (K) 1 January 2005, (L) 23 October 2003, (M) 23 October 2003, (N) 19 December 2006, (O) 9 October 2004.
Aquaculture is one of the key economic sectors in Guangdong province. It contributes 19.3% of the agricultural GDP of Guangdong as of 2011. Provincial and local governments are eager to have timely information about offshore aquaculture land for land use planning. In this study, we developed a method to automatically extract information of aquaculture land use to meet this expectation. Instead of classifying all land use categories, in this study we mainly focused on those sharing similar spectral characteristics with aquaculture land, including pond, reservoir, and salt field. Water in river channels was first masked out from the images using the hydrographical data and thus was not included in this study.
Classification scheme is developed following the Specifications of Satellite Remote Sensing for 1:50,000 Island and Coastal Zone Investigation (Project 908 of State Oceanic Administration of China 2006). Aquaculture consists of areas with open water that is used to raise sea food products such as fish and shrimp. This type of rectangular-shaped land usually has a low earth bank. A pond is defined as man-made small water body with water throughout the entire year. Most ponds are built for livestock water and irrigation. These water bodies are normally small. A reservoir is a kind of irregular-shaped anthropogenic feature built in the lowland of mountainous areas for the purpose of irrigation. On remote sensing images, reservoirs appear as dark blue water bodies surrounded by vegetation growing in mountains or undulating hills. Salt field, mainly in rectangular shape, consists of large and flat lands that are used to produce salt.
Archived land use data are already available for the inland 5-km buffer zone of the coastal line in our study area. This data set was produced by visual interpretation from the same set of SPOT-5 images by a research group in the Institute of Geographical and Natural Resources Research, Chinese Academy of Sciences. Overall classification accuracy of this land use data set is 93.4% (Du, Liang, and Sun Citation2012).
3. Methodology
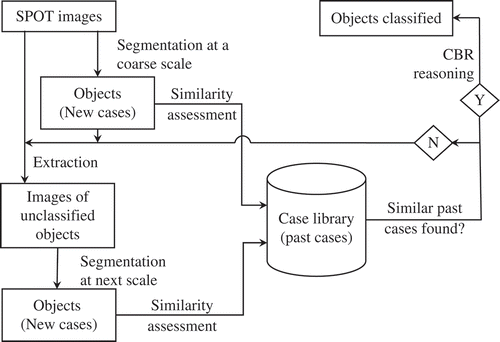
Essentially, CBR is a process of solving new problems based on solutions of similar past problems. There are four major cycles in CBR (Aamodt and Plaza Citation1994): retrieving similar past cases, reusing knowledge of similar past cases to solve new problems, revising the solutions, and retaining solved cases for future problem solving. In this study, images were first segmented into discrete objects at multiple scales. These objects were treated as cases in CBR. CBR was then used to build a library with past image objects and find solutions for new objects from the library. Detailed procedures () are explained below.
Figure 2. A flow chart showing the procedures to segment images and classify image objects in this study.
3.1. Image segmentation
Images were segmented using the Fractal Net Evolution Approach in Definiens® (Baatz and Schäpe Citation2000). As mentioned in Section 2, the spectral characteristics of these four land use categories tend to be similar while their shapes are quite different. Thus weighting factors of the shape, compactness, smoothness, and colour parameters in Definiens® were set to 0.4, 0.5, 0.5, and 0.6 respectively, to emphasize the potential influence of the shape while deemphasize that of the colour. The images were initially segmented at scales of 120, 80, 60, 40, and 20. After comparing the segmentation results with archived land use data, we considered the scales of 80 and 40 to be appropriate for this study. Therefore, CBR was used to classify the image objects created at these two scales following the procedures in Figure 2, which are explained in the following section.
3.2. CBR in image classification
In CBR, every case is described by attributes that can be used to distinguish one case from another (Holt Citation1999; Shi et al. Citation2004; Watson Citation1998). A case library was first built up to store past cases. The new cases were then compared with past cases in the case library to identify all past similar cases for each new case. Solutions of these past similar cases were then accordingly assigned to each specific new case. We have developed a generic framework of CBR applications in geographical problem solving (Du, Liang, and Sun Citation2012). This study generally followed this framework to find similar past image objects for a new object. A brief explanation is provided below.
3.2.1. Case representation
In CBR, a case usually consists of two components: its “problem description” and “solution” (Du, Liang, and Sun Citation2012; Holt Citation1999; Shi et al. Citation2004). Specific to this study, the “solution” of an image object is its land use type. The “problem description” refers to a set of attributes that are used to distinguish one image object from another, including their geometric shapes, spectral characteristics, and textural measurements. As argued by Du, Liang, and Sun (Citation2012), land use is significantly affected by its geographic settings. In this study, we considered the perpendicular distance from an image object to the coastal line. Pond and reservoir are usually further away from the coast line than the aquaculture and salt field. Accordingly, an image object is represented by four components: geometric shape, spectral characteristics, textural measurements, and geographical settings. Totally, 34 variables (not reported in this article) were calculated to represent each object.
Principle component analysis (PCA) was then used to retain the essential while remove duplicated information (Davis Citation2002) among these 34 variables. Variables that contribute most to the first three most significant principle components in PCA were selected () and used to describe each individual image object:
Table 1. Attributes used to describe the segmented objects in this study
Where i is the ith image object; Si, Gi , and Ti , are the spectral characteristics, geometric shape, and textural measurements of object i; Di is the perpendicular distance from the ith object to the coastal line; Scale i is the scale at which the image object was created; LC i is the land use category of the ith object.
3.2.2. Case library construction
Objects created from the images of the eastern coast (A to M in Figure 1) were first overlaid atop the archived land use data. Only the objects with one dominant land use type occupying at least 90% of the area were imported into the case library (). Totally, there are 6977 objects in the case library and 5847 out of them are aquaculture (). There are 572, 406, and 152 objects of pond, reservoir, and salt field, respectively.
Table 2. Past cases with their attributes in the case library
Table 3. Number and total area of old cases per land use type in the case library
3.2.3. Similarity evaluation and CBR
A similarity index (SI) between each new image object (i) and every past object (j) in the case library was calculated using the following equation:
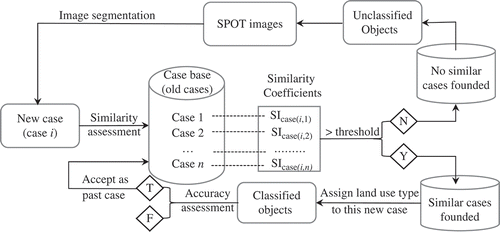
Objects created at scale 80 were first classified (). To a specific new object, we identified all past objects with a SI higher than a threshold value (0.95 in this study). If only one similar past object was found, its land use type was directly assigned to this new case. In the case that more than one past similar object was found, land use type of the past object created at the same scale as the new object was accepted. Otherwise, land use type of the past object with the highest SI was accepted as the solutions to this specific new object. If no similar cases were found for a specific object in the case library, it was temporarily labelled as “unclassified.” The image of this unclassified object was then further segmented at scale 40 into smaller objects, which were then classified following the aforementioned procedures. If an object generated at this finer scale still cannot be classified, it was eventually labelled as “unclassified.”
Figure 3. A flow chart showing image classification procedures using CBR.
3.3. Experimental design and accuracy assessment
Three experiments were designed to evaluate the applications of CBR in classifying remote sensing image. We first conducted a 10-fold cross-validation to test past objects in the case library. In this experiment, the past objects were randomly partitioned into 10 subsamples of approximately equal size. Ten tests were then performed. In each test, nine out of these 10 subsamples were used as past cases. The remaining one subset of objects was used as new objects and they were then classified using the procedures outlined in Section 3.2.3. In the second experiment, we used all past objects in the case library to classify objects created from images of the two test areas (N and O in Figure 1). Maximum likelihood classification (MLC) was also employed to classify the images of the two test areas. Classification results of CBR and MLC were compared to evaluate the effectiveness of CBR in image classification.
We prepared error matrixes to evaluate the classification accuracy. In this study, we compared the classification results against the archived land use data in terms of their areal extent (Congalton Citation1991; Foody Citation2002). For the purpose of accuracy assessment, we only retained the aquaculture, pond, reservoir, and salt field and all other categories in the archived land use data were merged and recoded as “others.” We then overlaid our classification results over the archived land use data to calculate the area that was correctly classified and misclassfied.
4. Results and discussion
4.1. Classification accuracy assessment
The overall classification accuracy of the 10-fold cross-validation experiment ranges from 95.34% to 97.44% with an average of 96.46% (). Among the 10 tests, less than 0.2% of aquaculture lands was unclassified and only 1.16% was misclassified. Both producer's and user's accuracies of aquaculture land are consistently over 96% with an average of 98.64% and 98.28%, respectively. By contrast, producer's and user's accuracies of other land use types vary significantly. For example, user's accuracy of salt field ranges from 39.88% to 80.12% with an average of 64.18. Producer's accuracy of pond ranges from 62.40% to 79.32% with an average of 70.88%.
Table 4. Error matrixes of the 10-fold cross-validation experiment
shows the classification results of the two test areas. The overall classification accuracy is 83.26% and 90.84% for Jiangmen and Shatian test areas, respectively ( and ). The highest producer's and user's accuracies, ranging from 54.93% to74.73%, were produced by aquaculture in both test areas. The user's and producer's accuracies of pond and reservoir are less than 3% in Jiangmen area and between 10.81% and 50.28% in Shatian area.
Table 5. Confusion matrix of the CBR classification results of Jiangmen test area
Table 6. Confusion matrix of the CBR classification results of Shatian test area
Table 7. Confusion matrix of the MLC classification results of Jiangmen test area
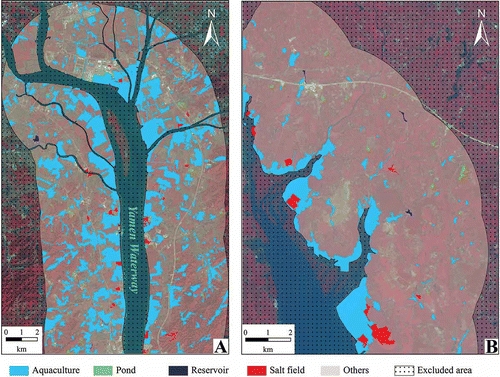
Figure 4. CBR classification results of the two test areas: (A) Jiangmen and (B) Shatian.
Classification accuracy is positively related to the total number of past objects of each land use category in the case library. The aquaculture produced the highest producer's and user's accuracies in both two experiments (–) as it is the dominant type of the past objects in the case library (). For the categories with fewer past objects in the case library, their classification accuracies are significantly lower than that of the aquaculture. Therefore, a representative and complete case library is the key to the successful applications of CBR in image classification. This is also the reason why the classification accuracies of pond and reservoir are high in the 10-fold cross-validation experiment. For each new object, there are roughly nine past objects with the same type of land use available in the case library. It is easy for CBR to find similar past cases for the new case and the classification accuracy thus tends to be high. This is also true for the classification results of the two test areas. Aquaculture produced significantly higher classification accuracy than pond and reservoir as there are much more past objects in the case library for CBR.
4.2. Comparison with MLC classification
The confusion matrixes (–) show that CBR outperforms the MLC classifier in classifying SPOT-5 images of the two test areas as it further considers spatial arrangements of pixels. In Jiangmen area, CBR produced a significantly higher overall classification accuracy (82.03%) than the MLC did (73.78%). The overall CBR classification accuracy of Shatian area (90.46%) is also higher than that of the MLC (87.08%).
Table 8. Confusion matrix of the MLC classification results of Shatian test area
Regarding to individual category, CBR exceeds the MLC classifier in classifying aquaculture as shown by the higher producer's and user's accuracies of aquaculture. However, producer's and user's accuracies of pond and reservoir in CBR classification results are significantly lower than that of the MLC classification. This is because there are not enough past cases in the case library for these two categories. Another reason is probably because the past cases were derived from a different area. Objects generated from images of two different areas may have significantly different spectral characteristics, geometric shapes, and texture measurements. However, CBR shows huge potential in image classification if there are enough past cases derived from the same area in the case library, as demonstrated in the 10-fold cross-validation experiment.
4.3. Implication of object-oriented image classification and land cover mapping
Both CBR in this study and the membership function classifier in Definiens® use rules to classify image objects. The membership function classifier uses rules that are derived from expert knowledge or training data. Expert-derived rules tend to be subjective. Their effectiveness in image classification is dependent upon how thorough the expert knows the difference of spectral characteristics, geometric shapes, and textual measurements among the different types of land use. Rules extracted from training data are subjected to the completeness and representativeness of the training data. This actually remains a challenge in image classification, particularly for study areas with complex and heterogeneous landscapes (Lu and Weng Citation2007). By contrast, CBR extracts knowledge from past cases. Such rules are objective as they are neither constrained by user's expert knowledge nor the training data. The key issue of CBR applications in image classification is to accumulate enough number of past cases in the case library as indicated by the 10-fold cross-validation experiment in this study.
To build such a complete and representative case library is actually no more a challenge as archived images and land use data sets are already widely available today. Objects can be routinely generated from archived images at various scales. Land use of these objects can be obtained from the archived data sets. For example, global land cover mapping has been performed using images acquired by the Advanced Very High Resolution Radiometer (AVHRR) (Hansen et al. Citation2000; Loveland et al. Citation2000), the Vegetation Instrument onboard SPOT satellites (Bartholomé and Belward Citation2005), the Moderate Resolution Imaging Spectroradiometer (MODIS) (Friedl et al. Citation2002). National land cover databases are also available for many countries. For example, the USGS Earth Resources Observation and Science (EROS) Center has developed National Land Cover Database of 1992, 2001, and 2006 for the conterminous United States (Fry et al. Citation2011; Homer et al. Citation2007; Vogelmann et al. Citation2001). Many other studies have presented land mapping results at regional or even finer scales from various sources of remote sensing images (e.g., Gao Citation2008; Myint et al. Citation2011). These data sets undoubtedly allow us to use CBR, in conjunction with object-based image classification, to update land use thematic maps from similar types of remote sensing imagery.
5. Conclusions
Land use data derived from remotely sensed images are available at various scales. Integration of CBR with object-based image classification allows users to extract knowledge from archived land use data to classify new remote sensing images to produce or update thematic land use maps. As demonstrated in this study, the key to the successful applications of CBR in image classification is to build a complete and representative case library from archived land use products. It is actually no more a challenge given that so many multi-resolution land cover databases have already been produced. Furthermore, once new image objects are correctly classified, they can be absorbed into the case library and used as for future image classification.
Funding
Funding of this study was provided by National Science Foundation of China [grant number 41071250]; the State Science and Technology Support Program of China [grant number 2011BAH23B04] the Innovation Projects of the State Key Laboratory of Resource and Environment Information System, Chinese Academy of Sciences [grant number: 088RA500KA].
Related Research Data
References
- Aamodt , A. and Plaza , E. 1994 . Case-Based Reasoning: Foundational Issues, Methodological Variations, and System Approaches.” . AI Communications , 7 : 39 – 59 .
- Aplin , P. and Smith , G. M. 2011 . Introduction to Object-Based Landscape Analysis.” . International Journal of Geographical Information Science , 25 : 869 – 875 .
- Baatz , M. and Schäpe , M. 2000 . “ Multiresolution Segmentation - an Optimization Approach for High Quality Multi-Scale Image Segmentation.” . In Angewandte Geographische Informations-Verarbeitung XII , Edited by: Strobl , J. , Blaschke , T. and Griesebner , G. 12 – 23 . Heidelberg: Wichmann Verlag .
- Bartholomé , E. and Belward , A. S. 2005 . GLC2000: A New Approach to Global Land Cover Mapping From Earth Observation Data.” . International Journal of Remote Sensing , 26 : 1959 – 1977 .
- Benz , U. C. , Hofmann , P. , Willhauck , G. , Lingenfelder , I. and Heynen , M. 2004 . Multi-Resolution, Object-Oriented Fuzzy Analysis of Remote Sensing Data for GIS-Ready Information.” . ISPRS Journal of Photogrammetry and Remote Sensing , 58 : 239 – 258 .
- Blaschke , T. 2010 . Object Based Image Analysis for Remote Sensing.” . ISPRS Journal of Photogrammetry and Remote Sensing , 65 : 2 – 16 .
- Branting , L. K. , Hastings , J. D. and Lockwood , J. A. 1999 . Integrating Cases and Models for Predictions in Biological Systems.” . AI Applications , 11 : 29 – 48 .
- Congalton , R. G. 1991 . A Review of Assessing the Accuracy of Classifications of Remotely Sensed Data.” . Remote Sensing of Environment , 37 : 35 – 46 .
- Davis , J. C. 2002 . Statistics and Data Analysis in Geology 656. New York: John Wiley & Sons.
- 2009 . Definiens Developer 7–User Guide , München : Definiens AG . DefiniensA. G
- Drăguţ , L. , Tiede , D. and Levick , S. R. 2010 . ESP: A Tool to Estimate Scale Parameter for Multiresolution Image Segmentation of Remotely Sensed Data.” . International Journal of Geographical Information Science , 24 : 859 – 871 .
- Du , Y. , Liang , F. and Sun , Y. 2012 . Integrating Spatial Relations Into Case-Based Reasoning to Solve Geographic Problems.” . Knowledge-Based Systems , 33 : 111 – 123 .
- Duro , D. C. , Franklin , S. E. and Dubé , M. G. 2012 . A Comparison of Pixel-Based and Object-Based Image Analysis with Selected Machine Learning Algorithms for the Classification of Agricultural Landscapes Using SPOT-5 HRG Imagery.” . Remote Sensing of Environment , 118 : 259 – 272 .
- Foody , G. M. 2002 . Status of Land Cover Classification Accuracy Assessment.” . Remote Sensing of Environment , 80 : 185 – 201 .
- Friedl , M. A. , McIver , D. K. , Hodges , J. C. F. , Zhang , X. Y. , Muchoney , D. , Strahler , A. H. , Woodcock , C. E. , Gopal , S. , Schneider , A. and Cooper , A. 2002 . Global Land Cover Mapping From MODIS: Algorithms and Early Results.” . Remote Sensing of Environment , 83 : 287 – 302 .
- Frohn , R. C. and Chaudhary , N. 2008 . Multi-Scale Image Segmentation and Object-Oriented Processing for Land Cover Classification.” . GIScience & Remote Sensing , 45 : 377 – 391 .
- Fry , J. , Xian , G. , Jin , S. , Dewitz , J. , Homer , C. , Yang , L. , Barnes , C. , Herold , N. and Wickham , J. 2011 . Completion of the 2006 National Land Cover Database for the Conterminous United States.” . Photogrammetric Engineering and Remote Sensing , 77 : 858 – 864 .
- Gao , J. 2008 . Mapping of Land Degradation From ASTER Data: A Comparison of Object-Based and Pixel-Based Methods.” . GIScience & Remote Sensing , 45 : 149 – 166 .
- Hansen , M. C. , DeFries , R. S. , Townshend , J. R. and Sohlberg , R. 2000 . Global Land Cover Classification at 1 Km Spatial Resolution Using a Classification Tree Approach.” . International Journal of Remote Sensing , 21 : 1331 – 1364 .
- Holt , A. 1999 . Applying Case-Based Reasoning Techniques in GIS.” . International Journal of Geographical Information Science , 13 : 9 – 25 .
- Homer , C. , Dewitz , J. , Fry , J. , Coan , M. , Hossain , N. , Larson , C. , Herold , N. , McKerrow , A. , VanDriel , J. N. and Wickham , J. 2007 . Completion of the 2001 National Land Cover Database for the Counterminous United States.” . Photogrammetric Engineering and Remote Sensing , 73 : 337 – 341 .
- Inglada , J. 2007 . Automatic Recognition of Man-Made Objects in High Resolution Optical Remote Sensing Images by SVM Classification of Geometric Image Features.” . ISPRS Journal of Photogrammetry and Remote Sensing , 62 : 236 – 248 .
- Jones , E. K. and Roydhouse , A. 1994 . Intelligent Retrieval of Historical Meteorological Data.” . Artificial Intelligence , 8 : 43 – 54 .
- Kass , S. , Notarnicola , C. and Zebisch , M. 2011 . Identification of Orchards and Vineyards with Different Texture-Based Measurements by Using an Object-Oriented Classification Approach.” . International Journal of Geographical Information Science , 25 : 931 – 947 .
- Kim , M. , Madden , M. and Warner , T. A. 2009 . Forest Type Mapping Using Object-Specific Texture Measures From Multispectral Ikonos Imagery: Segmentation Quality and Image Classification Issues.” . Photogrammetric Engineering and Remote Sensing , 75 : 819 – 829 .
- Laliberte , A. S. , Fredrickson , E. L. and Rango , A. 2007 . Combining Decision Trees with Hierarchical Object-Oriented Image Analysis for Mapping Arid Rangelands.” . Photogrammetric Engineering and Remote Sensing , 73 : 197 – 207 .
- Lekkas , G. P. , Avouris , N. M. and Viras , L. G. 1994 . Case-Based Reasoning in Environmental Monitoring Applications.” . Applied Artificial Intelligence , 8 : 359 – 376 .
- Li , X. and Yeh , A. G. 2004 . Multitemporal SAR Images for Monitoring Cultivation Systems Using Case-Based Reasoning.” . Remote Sensing of Environment , 90 : 524 – 534 .
- Loveland , T. R. , Reed , B. C. , Brown , J. F. , Ohlen , D. O. , Zhu , Z. , Yang , L. and Merchant , J. W. 2000 . Development of a Global Land Cover Characteristics Database and IGBP DISCover From 1 Km AVHRR Data.” . International Journal of Remote Sensing , 21 : 1303 – 1330 .
- Lu , D. and Weng , Q. 2007 . A Survey of Image Classification Methods and Techniques for Improving Classification Performance.” . International Journal of Remote Sensing , 28 : 823 – 870 .
- Myint , S. W. , Gober , P. , Brazel , A. , Grossman-Clarke , S. and Weng , Q. 2011 . Per-Pixel Vs. Object-Based Classification of Urban Land Cover Extraction Using High Spatial Resolution Imagery.” . Remote Sensing of Environment , 115 : 1145 – 1161 .
- Möller , M. , Lymburner , L. and Volk , M. 2007 . The Comparison Index: A Tool for Assessing the Accuracy of Image Segmentation.” . International Journal of Applied Earth Observation and Geoinformation , 9 : 311 – 321 .
- Project 908 of State Oceanic Administration of China. 2006. Specifications of Satellite Remote Sensing for Island and Coastal Zone Investigation61. Beijing: China Ocean Press.
- Qian , J. , Li , X. , Ai , B. , Anthony , G.-O. Y. , Chen , X.-Y. , Liu , K. and Zhuo , L. 2007 . Land-Use Short-Term Change Detection Based on Time-Series-Case-Based-Reasoning (TSCBR).” . Journal of Natural Resources , 5 : 735 – 746 .
- Robertson , L. D. and King , D. J. 2011 . Comparison of Pixel-and Object-Based Classification in Land Cover Change Mapping.” . International Journal of Remote Sensing , 32 : 1505 – 1529 .
- Shi , X. , Zhu , A.-X. , Burt , J. , Qi , F. and Simonson , D. 2004 . A Case-Based Reasoning Approach to Fuzzy Soil Mapping.” . Soil Science Society of America Journal , 68 : 885 – 894 .
- Thomas , N. , Hendrix , C. and Congalton , R. G. 2003 . A Comparison of Urban Mapping Methods Using High-Resolution Digital Imagery.” . Photogrammetric Engineering and Remote Sensing , 69 : 963 – 972 .
- Vogelmann , J. E. , Howard , S. M. , Yang , L. , Larson , C. R. , Wylie , B. K. and Van Driel , N. 2001 . Completion of the 1990s National Land Cover Data Set for the Conterminous United States From Landsat Thematic Mapper Data and Ancillary Data Sources.” . Photogrammetric Engineering and Remote Sensing , 67 : 650 – 662 .
- Watson , I. 1998 . Applying Case-Based Reasoning: Techniques for Enterprise Systems , USA : Morgan Kaufmann Publishers Inc., San Francisco .
- Yeh , A. G. O. and Shi , X. 1999 . Applying Case-Based Reasoning to Urban Planning: A New Planning Support System Tool.” . Environment and Planning B: Planning and Design , 26 : 101 – 116 .
- Yu , Q. , Gong , P. , Clinton , N. , Biging , G. , Kelly , M. and Schirokauer , D. 2006 . Object-Based Detailed Vegetation Classification with Airborne High Spatial Resolution Remote Sensing Imagery.” . Photogrammetric Engineering and Remote Sensing , 72 : 799 – 811 .