
Abstract
Accurate and timely information about the geographic distribution of irrigated cropland is important for a range of applications including crop assessments, water resources management, drought monitoring, and environmental modeling. In the United States, a consistent, seamless irrigated agricultural lands map was not available until the development of the 250-m moderate resolution imaging spectroradiometer (MODIS) irrigated agriculture data-set (MIrAD), which was developed from time-series MODIS normalized difference vegetation index, county-level crop area statistics, and land use/land cover (LULC) data using an automated county-level classification approach. This study performed a detailed multi-scale assessment of the MIrAD over the state of Nebraska, which is extensively irrigated, to determine the thematic accuracy of classified irrigation patterns at various spatial scales (i.e., landscape, field, and subfield) and over various crop types. The MIrAD was found to map comparable irrigated cropland patterns to a Landsat-derived LULC map (82% pixel-level thematic agreement) over Nebraska, with most areas of disagreement occurring in transitional mixed pixel locations between adjacent LULC types. Classification accuracy was found to have little variation by general field size and crop type, but accuracies were lower for pixel locations at the field’s edges. Overall, this study found the MIrAD to be a relatively accurate and consistent irrigated cropland classification within the US Central Great Plains region that can be used for local- and regional-scale applications.
1. Introduction
The agriculture component of the landscape represents a critical interface where human–environment interactions can influence processes such as biogeochemical and hydrologic cycles, crop production, and local-to-regional climate conditions. Classification of irrigated agricultural lands is of particular importance given the role of this land use on atmosphere–land surface water exchanges, biogeochemical cycling, groundwater/surface water supplies, and food production. Seamless and consistent land use/land cover (LULC) data-sets that classify the spatial distribution of irrigated agriculture are needed to improve crop production assessments, drought monitoring, water resource management, and various environmental modeling efforts (e.g., biogeochemical, climatic, and hydrologic), as well as to better analyze the potential impact of climate change on future water demands and agricultural sustainability.
In the United States, where many sources of LULC data exist, the availability of a consistent and seamless national-level classification of irrigated agricultural land at a relatively high spatial resolution (i.e., <1-km) has been limited. Traditionally, information regarding the spatial distribution of irrigated agriculture at the national level has been extracted from county-level areal statistics that are reported annually by the US Department of Agriculture’s (USDA) National Agricultural Statistics Service (NASS) (NASS Quick Stats, http://www.nass.usda.gov/QuickStats/Create_County_All.jsp). Although the USDA NASS irrigated acreage data are consistent across the country and are updated annually, the data only represent an aggregated summary of the total irrigated area by county and provide no geographic reference to the specific location of these irrigated areas within a given county, which is needed for many applications. In addition, irrigated acreage data are not collected for all crop types (e.g., alfalfa) in the USDA NASS data, which can lead to an underestimation of irrigated cropland area, particularly for locations where the omitted irrigated crop type may be dominant (Wardlow and Egbert Citation2003). Some individual states and watersheds have detailed well data records (e.g., Water Information Management and Analysis System for the state of Kansas, Wilson et al. Citation2005) that can be visualized in map form within a geographic information system to plot the distribution of permitted wells for agricultural and other purposes. Many of these well data-sets can provide a wealth of information about irrigated agriculture (e.g., designated use, surface or groundwater source, and permitted usage rate), but are only available for selected areas of the United States and may not be frequently updated to provide current information.
Satellite-based remote sensing has been increasingly used for irrigation mapping in the United States, with the majority of these efforts having utilized data from the series of Landsat instruments (Keene and Conley Citation1980; Thelin and Heimes Citation1987; Egbert and Mercier Citation2000; Qi et al. Citation2002; Dappen et al. Citation2007). Multispectral image data from the early Landsat multispectral scanner and the more recent Landsat Thematic Mapper (TM) and Enhanced Thematic Mapper (ETM+) systems are appropriate for classifying spatial cropping patterns across the landscape (Bauer et al. Citation1978; Odenweller and Johnson Citation1984; Price et al. Citation1997; Oetter et al. Citation2001; Dappen et al. Citation2007; Maxwell et al. Citation2004; Craig Citation2001) given their high spatial resolution (79 m and 30 m, respectively) relative to typical field sizes throughout the United States (Ozdogan and Woodcock Citation2006). However, these Landsat-based irrigated crop mapping efforts have not been national in scope, but rather conducted at local (Keene and Conley Citation1980; Egbert and Mercier Citation2000), state (Dappen et al. Citation2007), and regional (Thelin and Heimes Citation1987; Qi et al. Citation2002) scales. As a result, a patchwork of Landsat-derived irrigation maps has been generated for selected locations and time periods across the country, but no national-level mapping effort like the National Land Cover Data-set (NLCD) (Vogelmann et al. Citation2001; Homer et al. Citation2004) has been undertaken to provide a spatially and temporally consistent classification of irrigated agricultural land.
In general, large-area LULC mapping using Landsat data has been limited by the extensive number of relatively cloud-free Landsat scenes that are required, as well as the time and costs associated with processing (e.g., geometric and radiometric correction) and classifying the large data volumes (DeFries and Belward Citation2000). A seasonal classification approach using multiple dates (ranging from 2–5 dates) of Landsat imagery collected during key periods of the growing season has often been used for irrigated crop mapping (Egbert and Mercier Citation2000; Qi et al. Citation2002) to capitalize on phenology-related spectral differences to discriminate irrigated and nonirrigated crops, which would result in hundreds of Landsat images being required if such a method was implemented at a national scale. The acquisition of image data at optimal times during the growing season to separate irrigated and rainfed crops would also be challenging given the differing crop calendars among various crops types, as well as variations in crop-specific calendars that can occur across large geographic areas. In addition, cloud cover within individual Landast image scenes is relatively common, reducing the number of images and/or specific dates of imagery available for classification purposes because of Landsat’s 16-day revisit interval (DeFries and Belward Citation2000).
The moderate resolution imaging spectroradiometer (MODIS) instruments onboard NASA's Terra and Aqua platforms have proven to be a viable option for large-area LULC classification efforts given their high temporal global observations for terrestrial monitoring (Townshend and Justice Citation2002). The utility of time-series MODIS 250-m and 500-m spectral and vegetation index (VI) data for crop-related LULC classification has been well established (Lobell and Asner Citation2004; Doraiswamy et al. Citation2005; Chang et al. Citation2007; Wardlow, Egbert, and Kastens Citation2007; Chang et al. Citation2007; Wardlow and Egbert Citation2008, Citation2010) and tested for large-area irrigated cropland mapping in the United States with reasonable success (Wardlow and Egbert Citation2008; Ozdogan and Gutman Citation2008; Pervez and Brown Citation2010). Wardlow and Egbert (Citation2008) discriminated irrigated and rainfed crops over the state of Kansas with 85% thematic accuracy using time-series MODIS 250-m normalized difference vegetation index (NDVI) data. They found that many field-level cropping patterns were retained at that spatial resolution, and the state’s total classified irrigated area was in close agreement with the USDA reported acreage (~4% areal difference). Ozdogan and Gutman (Citation2008) applied a time series of the MODIS-derived 500-m green index (GI) data (Gitelson et al. Citation2003) along with a climate-based irrigation potential index and land cover data to generate a national-level irrigation map for the United States as part of developing a larger global irrigation mapping strategy. The classification accuracy of the national-level 500-m irrigation map varied between the western (87%) and eastern (79%) United States when the map results were compared to known locations of irrigation, but the spatial distribution of the mapped irrigation areas was in general agreement with the USDA acreage statistics across the continental United States (CONUS), and was generally consistent with the irrigated lands visually interpreted in Landsat ETM+ imagery.
Recently, a MODIS-based irrigation mapping methodology was developed by Pervez and Brown (Citation2010) to produce a national-level 250-m resolution irrigated agriculture map for the CONUS called the ‘MODIS Irrigated Agriculture Data-set’ (MIrAD). The MIrAD represents the highest spatial resolution seamless irrigated agriculture classification currently available for the CONUS. Pervez and Brown (Citation2010) implemented a novel automated irrigation classification technique that analyzed time-series MODIS 250-m NDVI data, LULC information from the NLCD (Homer et al. Citation2004), and county-level USDA irrigated area statistics. The approach relies on the differential response of the maximum NDVI (or greenness) between rainfed (lower NDVI) and irrigated (higher NDVI) crops in an annual time series of the MODIS NDVI data (Wardlow and Egbert Citation2008, Citation2010). The maximum NDVI information is used in combination with the other ancillary LULC data-sets and area statistics to classify irrigated and nonirrigated cropland on a county-by-county basis. The hybrid MIrAD classification method holds several advantages over traditional supervised approaches used to generate MODIS-based irrigation maps (Ozdogan and Gutman Citation2008; Wardlow and Egbert Citation2008) including no ground-truth observations are required for training the classifier and a rapid large-area mapping capability on the order of days rather than weeks to months using an automated approach.
An initial assessment of the MIrAD (circa 2002) was conducted by Pervez and Brown (Citation2010) for selected areas of the CONUS using qualitative and quantitative assessment techniques, which varied by location and were dependent on the available reference data. They found the classified irrigation patterns to be in general agreement with known irrigation-dominant regions across the CONUS and visually interpreted irrigation patterns from Landsat imagery for selected locations. State-level comparisons between the MIrAD and the USDA area statistics revealed that the areal differences between the two data-sets were lower for states in the western United States and higher for states in the eastern United States. For selected areas with ground-referenced irrigation data, they found the thematic accuracy of the MIrAD to range between 75% in the US Great Plains and 92% in the western United States (i.e., California).
Although the results of Pervez and Brown (Citation2010) are promising and provide some broad insight into the accuracy of the MIrAD map, a more detailed and thorough validation of this classification approach and resulting data-set is needed to determine the accuracy of the classified irrigation patterns across the landscape. Specifically, key knowledge gaps exist in regard to whether the MIrAD map has a consistent accuracy across large geographic areas with varying climatic conditions, crop types, field sizes, and spatial LULC configurations. Gaining a more thorough insight into the MIrAD is valuable for understanding the potential of this classification approach for routine irrigation mapping across the CONUS and the relative strengths and weaknesses of the MIrAD data-set, which can be used across a myriad of applications including agriculture and water resource assessments, land management, and drought monitoring.
The objective of this study was to conduct a multi-scale validation of the MIrAD (circa 2002) data-set over the state of Nebraska, which contains the largest irrigated cropland area (8.5 million acres/3.4 million hectares [USDA Citation2008]) of any state in the United States. Although limited in geographic scope, Nebraska represents an ideal test area for the MIrAD because of the diverse environmental conditions (e.g., climate and field sizes) across which various crops (e.g., corn, soybeans, and alfalfa) are irrigated and the wealth of ground-truth data available for validation that includes geo-referenced irrigated and rainfed field locations, digital state-level irrigation and crop type maps, and field boundary vector coverages delineating individual fields. In this study, these reference data sources were used to establish the statistical accuracy of the MIrAD map; identify major areas and/or patterns of misclassification across the state; and determine the influence of field size, landscape position (i.e., interior versus edge pixels within a field), and crop type on the classification of irrigated agricultural land.
2. Study area
Nebraska is a major crop-producing state located in the US Central Great Plains (). Cropland is the dominant land cover throughout eastern and southern Nebraska. The grasslands of the Sand Hills are the main landscape feature in north-central and northwestern Nebraska, with smaller areas of cropland interspersed at edges of this region. The state contains approximately 18 million acres of cropland with corn (Zea mays) and soybeans (Glycine max) being the predominant crops. On average, corn and soybeans are planted on approximately 45% and 25% of the state’s cropland, respectively (USDA-NASS Citation2004). Nebraska consistently ranks among the top five states in both corn and soybean production (USDA Citation2008). Alfalfa (Medicago sativa), sorghum (Sorghum bicolor), and winter wheat (Tritcum aestivum) are Nebraska’s other main crops, and the state typically ranks in the top 10 nationally in production of each crop.
Figure 1. Study area map showing the spatial distribution of irrigated and nonirrigated croplands of Nebraska as classified in the Nebraska land use map (left; Dappen et al. Citation2007) and the MIrAD (right; Pervez and Brown Citation2010).
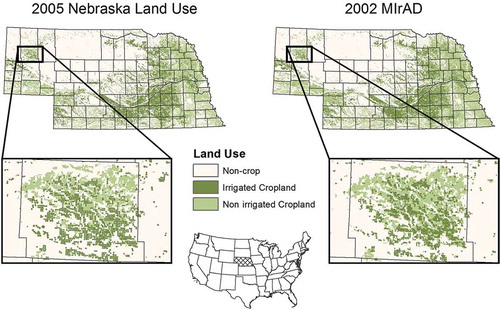
Nebraska has a steep east–west climatic gradient with annual precipitation ranging from ~15 inches (380 mm) in the semiarid western part of the state to ~35 inches (890 mm) in the east (High Plains Regional Climate Center Citation2010). In 2002, when the MODIS NDVI source data used to generate the MIrAD map were collected, much of the state experienced severe-to-extreme drought conditions across most of the growing season. The US Drought Monitor (Svoboda et al. Citation2002; http://drought.unl.edu/dm/) showed that early-season drought conditions in western Nebraska expanded across the state and rapidly intensified as the summer progressed. By early July, more than 90% of the state was experiencing severe drought, with extreme-to-exceptional drought conditions covering most of western Nebraska. Irrigation is extensively used across most of the state to maintain high crop production levels under climatic conditions that can have somewhat limited and variable precipitation. Nebraska ranks first nationally in total irrigated acreage with 47% of the state’s total cropped area under this land use practice (USDA Citation2008). The majority of crops are irrigated from the state’s ~90,000 irrigation wells (Burbach Citation2008) that tap the vast groundwater resources of the Ogallala aquifer system that underlies central and western Nebraska. Core irrigation areas include most cropland throughout south-central Nebraska, as well as parts of the northeast, southwest, and far western Panhandle. MODIS’ 250-m spatial resolution has been shown to be appropriate for mapping agricultural landscapes similar to Nebraska that have relatively large field sizes ranging from 40 acres to ~600 acres (16–250 ha) (Wardlow and Egbert Citation2008). Irrigated fields tend to be on the larger side of this field size range because the dominant irrigation system used across the state is center pivot irrigation, which typically covers between a quarter section (160 acres/65 ha) and one full section (640 acres/259 ha) according to the Public Land Survey System (PLSS).
3. Data description and methods
3.1. The MODIS irrigated agricultural data-set (MIrAD)
The national-level MIrAD was acquired from the US Geological Survey’s website (http://earlywarning.usgs.gov/USirrigation/) and geographically subset for the state of Nebraska prior to analysis. The MIrAD is a binary 250-m raster image (nonirrigated = 0 and irrigated = 1) that depicts irrigated agricultural patterns for 2002, which was the year of both the time-series 250-m MODIS NDVI and the USDA Agricultural Census (http://www.agcensus.usda.gov/Publications/2002/Volume_1,_Chapter_2_County_Level/index.asp) source data used to generate the map. For the LULC input, NLCD-2001 data were used to identify cropland and grassland pixels, which were the ‘targeted’ land cover types considered for irrigated classification in the approach used by Pervez and Brown (Citation2010). All other data-sets used in the accuracy assessment (summarized below) were geo-rectified to Lambert Azimuthal Equal Area projection of the MIrAD to enable direct comparisons among them.
3.2. State-level assessment of classified irrigated/non-irrigated patterns
A pixel-level thematic comparison between the MIrAD and a Landsat-based Nebraska land use (NE-LU) patterns map (http://www.calmit.unl.edu/2005landuse/statewide.php) was conducted to determine the accuracy of the irrigated agricultural patterns classified across Nebraska in the MIrAD. The 30-m NE-LU map represents the highest quality statewide geospatial data-set of irrigated lands with a thematic accuracy of 93% discriminating irrigated versus rainfed cropland (Dappen et al. Citation2007). Individual irrigated fields were classified in the NE-LU map through visual interpretation and on-screen digitizing of Landsat TM imagery using the USDA Farm Service Agency ortho-imagery and other ancillary data (e.g., well records and global positioning system [GPS]-referenced field locations) as supplemental reference information to assist interpretation. The Landsat TM imagery used to develop this statewide coverage of irrigated field polygons was acquired during 2005. Although a 3-year time difference exists between this reference data-set and the MIrAD, the irrigation locations in this land use map were considered representative of irrigation in 2002 because the state experienced minimal changes in the areal extent of irrigation across most of the state from 2002 to 2005. In the early 2000s, Nebraska placed a moratorium on drilling new irrigation wells in the western and central part of the state that limited expansion of irrigation, and any contraction would have been minimal during this time period. The notable exception was in eastern Nebraska, where the USDA reported a gradual steady increase in irrigated acreage within the state’s three eastern agricultural statistic districts (ASDs; geographic boundaries shown in ). From 2002 to 2005, the USDA estimated an increase of 215,000 acres of irrigated cropland within the state’s three easternmost ASDs, which represented two-thirds of Nebraska’s new irrigated land during this time period (USDA-NASS Citation2005). However, this additional new irrigated area represented only 3% of the state’s 7.6 million acres of irrigated cropland. As a result, the NE-LU map was considered an appropriate benchmark to assess the thematic accuracy of irrigated agriculture patterns depicted in the MIrAD across the state.
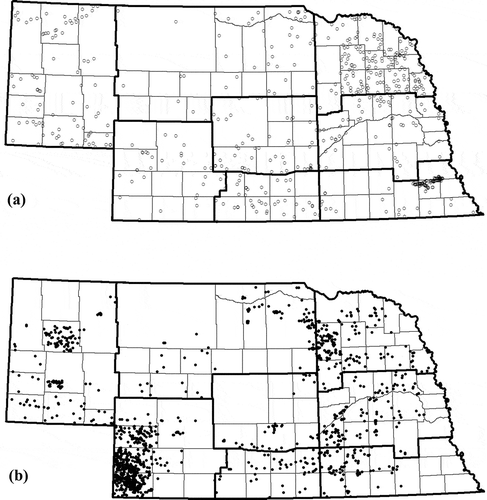
Figure 2. Validation sites for nonirrigated (a, n = 572) and irrigated (b, n = 1238) validation fields. Bold lines are the USDA NASS Agricultural Statistics District boundaries.
Before the pixel-level comparison, the irrigation polygons from the NE-LU map were converted to a 250-m raster irrigated/non-irrigated image for direct spatial comparison with the MIrAD. A statewide array of 250-m polygons corresponding to each pixel footprint in the MIrAD was generated, and these polygons were intersected with the NE-LU irrigation polygons to calculate the percent irrigated area contained within each 250-m polygon. The 250-m polygons were then converted to a 250-m raster percent irrigation image, which was subsequently reclassified into the final binary irrigated/nonirrigated image using a 50% or greater threshold to classify the irrigated pixels.
Pixels with thematic disagreement between the MIrAD and the NE-LU maps were further analyzed to investigate the possible sources of this disagreement such as the corresponding field size, the underlying land cover type (e.g., corn versus soybeans), and the relative landscape position of the pixels (e.g., interior versus edge pixel location within field). Spatially contiguous groups of disagreement pixels were clumped together into ‘disagreement clumps’, and each individual clump was analyzed separately. Before this analysis, small clumps (three 250-m pixels or less) and linear clumps (one pixel in width) were removed because they were typically located in transitional areas between different land cover types and represent ‘spectrally mixed’ pixels that are difficult to classify because of their aggregated spectral–temporal response from multiple land cover types. The clump size range was restricted to a minimum of 60 acres (~four 250-m pixels) and a maximum of 640 acres (~forty 250-m pixels), which is the typical range of individual field sizes across Nebraska. In general, clumps with these size and general shape characteristics (i.e., nonlinear) were assumed to correspond to individual landscape elements (e.g., fields). A total of 11,049 clumps (of a possible 20,024 clumps) of thematic disagreement were identified within this range.
These defined clumps were analyzed to better understand the potential classification errors in the MIrAD. The crop type corresponding to each clump location was evaluated to determine if areas planted to a specific crop type(s) led to a higher level of disagreement between the MIrAD and the NE-LU classifications. Crop type may be an important factor in the ability of the MIrAD to discriminate irrigated areas because each crop has a different phenology and timing of peak NDVI, which was the key metric used in the derivation of this classification (Brown, Maxwell, and Pervez Citation2009). Wardlow, Egbert, and Kastens (Citation2007) found that crops with a mid-summer NDVI peak (e.g., corn and soybeans) had a more pronounced NDVI difference between irrigated and nonirrigated sites than crops with a spring NDVI peak (e.g., winter wheat). The USDA NASS Cropland Data Layer (CDL) produced for Nebraska in 2002 was cross-referenced with the disagreement clusters to determine the specific crop type(s) associated with each clump for the same year as the source MODIS NDVI data used to produce the MIrAD. For each clump, the majority crop type in the original 30-m CDL data (i.e., occupying >50% of the clump’s total area) was calculated for the corresponding ‘disagreement clump’ area. If a clump did not have a clear majority crop type, it was assigned a mixed class label. The collective results from all clumps were then analyzed to determine if any crop-specific trend existed in the classification disagreement.
3.3. Field-level accuracy assessment
A set of 1810 field locations of irrigated (n = 1238) and nonirrigated (n = 572) crops across Nebraska were used to assess the field-level thematic accuracy of the MIrAD (). Field locations were recorded using a GPS in 2005 as part of the validation effort for the NE-LU map (Dappen et al. Citation2007). The use of the original point data locations was problematic in assessing the 250-m resolution map because the majority of the GPS-acquired coordinates were collected at each field’s edge rather than a center location. As a result, many of the 250-m pixels corresponding to these original GPS point locations were at the field’s edge in transitional areas that tend to have a composited spectral–temporal signal from multiple land cover types (e.g., crops, paved/gravel roads, grass easements, and forested shelter belts) that is not representative of the field’s crop conditions, which was the target of the MIrAD classification. To resolve this issue, a state-level USDA Common Land Unit (CLU; USDA Citation2012) vector coverage that delineates individual field parcels was used in combination with the GPS point data to determine the spatial extent of each ground-truth field. For each field, the GPS-acquired point location was intersected with the CLU parcel polygons to identify the specific polygon associated with that field. A field size minimum of ~16 acres (i.e., four 250-m pixels) was implemented during the polygon selection process to remove small fields from the accuracy assessment because they likely would not be spatially resolvable at the 250-m resolution.
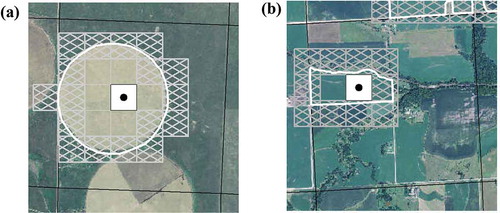
By defining the geographic extent of individual fields, the thematic accuracy of the MIrAD could be assessed at several spatial scales to test how the classification accuracy may vary depending on the relative landscape position (e.g., interior versus edge) of the 250-m pixels within a field. presents examples of different field sizes and shapes across Nebraska overlaid by the corresponding 250-m pixels, which show the pixel locations for the three levels of ‘within-field’ accuracy assessments that were performed for the centroid pixels, all interior pixels, and edge pixels. A ‘field-center’ statistical accuracy assessment was initially performed for a single 250-m pixel in the MIrAD at the centroid location within each field’s CLU polygon. This initial assessment was intended to test the MIrAD’s accuracy for a location where the classification accuracy would be assumed to be the highest. At the field’s center, a strong irrigated or nonirrigated crop signal should be detected in the MODIS NDVI data because of the homogenous crop cover and consistent management practice across the entire 250-m pixel footprint. A second ‘within field’ accuracy assessment was conducted by extracting the thematic label for all ‘interior’ 250-m pixels in the MIrAD completely located (i.e., 100% of pixel’s total area) within each field’s CLU polygon boundary to determine if thematic accuracy across all interior pixels of the field was comparable to that of the field’s center. A third assessment investigated the ‘edge effect’ on the MIrAD by including edge pixels that were partially located within a field. The edge pixel analysis was motivated by the work of Wardlow and Egbert (Citation2008), who found that edge pixels of irrigated fields were commonly misclassified as nonirrigated using the MODIS 250-m NDVI data. At a 250-m spatial resolution, these edge pixels are often composed of multiple LULC types, which results in a composited spectral–temporal signal from the heterogeneous LULC types within the pixel footprint that can be difficult to accurately classify. The goal of this part of the assessment was to quantify the level of classification error contributed by edge pixel locations in the MIrAD. For each field site, edge pixels were identified by intersecting the CLU field polygon boundaries with the MIrAD 250-m pixels and selecting pixels with up to 99% of their area located within the field. For each assessment, four accuracy measures were calculated that included overall, producer’s, and user’s accuracy and the Kappa statistic.
Figure 3. Examples of individual validation sites for (a) irrigated fields in western Nebraska and (b) rainfed fields in eastern Nebraska with the centroid (white), interior (transparent), and edge (hatched) pixels used in the various scales of field-level accuracy assessment.
The relationship between field size and the MIrAD classification accuracy was also investigated using the field size information calculated from the USDA CLU polygons for the 1180 validation sites. Wardlow, Egbert, and Kastens (Citation2007) noted that individual fields of 80 acres (32 ha) or larger were visually discernible at MODIS’ 250-m resolution for an agricultural landscape similar to Nebraska. The goal for this part of the study was to assess how the classification accuracy of the 250-m resolution irrigation map changed across a wide range of field sizes. Fields were grouped into four size classes based on quarter section ranges (i.e., 160 acre increments) of the US PLSS. The field size classes in descending order included (1) fields greater than 480 acres (i.e., three-quarters to full PLSS section), (2) fields between 320 and 480 acres (one-half to three-quarters section), (3) fields between 160 and 320 acres (quarter to one-half section), and (4) fields less than 160 acres (smaller than one-quarter section). One 250-m pixel corresponds to ~15.4 acres (6.2 ha), so most fields in this assessment were represented by 5–10 pixels on the lower end of the field size range and 30–40 pixels at the upper end in the MIrAD classification. For each field size class, a separate accuracy assessment was conducted using all ‘within field’ pixels (i.e., 100% of pixel area within a field’s boundary).
4. Results and discussion
4.1. State-level assessment
4.1.1. The MIrAD/the Nebraska land use pixel-level comparison and clump analysis
The state-level, pixel-by-pixel comparison of irrigated agriculture extent in the MIrAD and the NE-LU classifications revealed that comparable irrigation patterns were classified in both maps. For all pixels eligible for irrigation classification in the MIrAD, 81.7% thematically agreed with the classified irrigated and nonirrigated pixels in the NE-LU map. The total irrigated area classified by the MIrAD and the NE-LU maps were 7.83 and 7.87 million acres (3.17 and 3.18 million ha), respectively. Some discrepancy in total irrigated area is expected between the maps given the spatial resolution differences of the original NE-LU and the MIrAD data-sets. A slightly higher classified irrigated area would be expected in the higher resolution, 30-m Landsat-based NE-LU map, which had many irrigated locations in transitional and/or edge areas classified at the original 30-m resolution still retained in the generalized 250-m map. In contrast, many of these pixels would be consistently classified as nonirrigated in the MIrAD because of the mixed spectral signal of pixels in these transition areas at MODIS 250-m spatial scale. For the 18% of pixels with thematic disagreement, 54% were attributed to irrigated areas in the MIrAD map being classified as nonirrigated in the NE-LU.
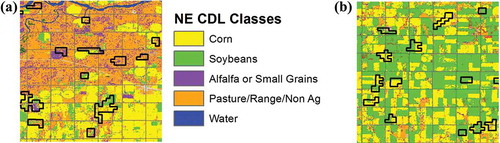
Clump analysis of the disagreement pixels showed that of the 20,024 pixel clumps, 45% (or 8975 clumps) were narrow linear or irregularly shaped features located primarily in transitional locations between irrigated and rainfed land cover types. This was consistent with Wardlow and Egbert (Citation2008), who found similar classification disagreement for the edge pixels of fields that had an integrated multi-temporal VI response of both irrigated and rainfed LULC types within the pixels’ geographic footprints. These small and narrow linear clumps that did not contain a core area on the scale of an individual field were removed from further analysis. shows the linear and odd-shaped disagreement clusters that were eliminated, shown on the NLCD map. The remaining 11,049 clumps with a ‘core’ group of pixels with a spatial scale (i.e., 4 or more 250-m pixels) and shape (i.e., rectangular and not linear) typical of individual fields across Nebraska were further assessed for the specific crop type grown (obtained from the 2002 USDA CDL) over these misclassified pixel clump footprints. The analysis revealed that omission errors resulting from the misclassification of irrigated areas as nonirrigated in the MIrAD was the dominant type of disagreement among the clusters (7763 total clusters). Omission errors were associated with three primary land cover types in the CDL: mixed crops (3305 clusters; average size of 174.7 acres [70.7 ha]), pasture/grassland (2869 clusters; average size of 148.8 acres [60.2 ha]), and corn (1029 clusters; average size of 158.9 acres [64.3 ha]). shows an example of clusters representing errors of omission overlaid on the CDL map. Some disagreement could also be expected over mixed crop areas, which are composed of multiple crop types contained within a cluster’s geographic footprint that can result in a non-distinct spectral–temporal signal. In addition, some of the detected irrigation omission errors in the MIrAD were the result of the 3-year temporal offset with the NE-LU map rather than classification error. Spatial assessment of the omitted irrigated ‘core’ clumps in the MIrAD revealed that approximately two-thirds of those clumps were located in the three eastern ASDs, which had experienced a progressive expansion of irrigated cropland between the earlier MIrAD (2002) and NE-LU (2005) classification dates. As a result, a number of these core disagreement clumps were likely correctly classified as rainfed in the MIrAD and had been converted to irrigated fields by the time the NE-LU was produced. There were considerably fewer errors of commission of irrigated land in the MIrAD map, with 3278 clumps exhibiting this type of disagreement. The majority of these irrigation commission error clumps were associated with rainfed locations of the study area’s two dominant crops of soybeans (871 clumps; average size of 168.6 acres) and corn (698 clumps; average size of 145.6 acres). highlights examples of clusters of commission errors in the MIrAD overlaid on the CDL map.
Figure 4. Example of error clusters omitted because of their narrow linear shapes indicative of transitional, mixed pixels between irrigated and nonirrigated areas.
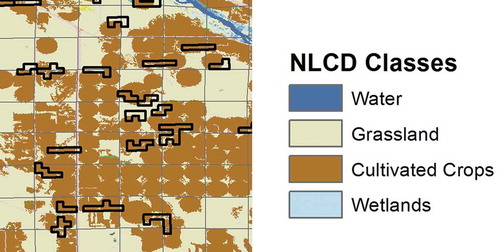
Figure 5. Examples of error types in the MIrAD overlaid on the 2002 Nebraska Cropland Data Layer. (a) The MIrAD irrigated omission clusters in mixed crop and grassland areas, and (b) the MIrAD irrigated commission clusters in soybeans and corn.
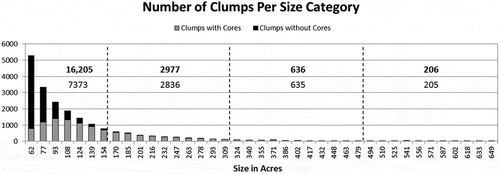
In general, these ‘disagreement clumps’ make up a small percentage of the state’s total cropland area (9%, or 1.8 million acres/0.7 million ha; USDA Citation2008), and were relatively localized to small clumps or field edge locations, which had a minimal effect on the overall classified irrigated/nonirrigated field patterns in the MIrAD map. This is illustrated by the frequency distribution of ‘core’ and ‘noncore’ ‘disagreement clumps’ by size across Nebraska in . As expected, the small and linear ‘noncore’ clumps occurring primarily in transitional LULC locations had most of the occurrences in the smallest clump size range of 160 acres or less (98% of total noncore clusters), with the majority of clumps smaller than 100 acres (40 ha). The analysis of ‘core’ clumps showed that most core-containing ‘disagreement clumps’ were also relatively small, with 67% of them less than 160 acres (65 ha).
Figure 6. Frequency distribution of ‘core-containing’ and ‘noncore-containing’ ‘disagreement clumps’ by acreage over Nebraska. Numbers relating to ‘noncore-containing clumps’ are in bold.
4.2. Field-level accuracy assessment
4.2.1. Accuracy assessment by pixel location within the field
The MIrAD had an overall thematic accuracy of 82.5% when single-pixel centroid locations were assessed for 1810 field sites across Nebraska (). The error matrix reveals that the majority of classification errors at the field’s center (81%; 256 of 316 misclassified pixels) were the result of the MIrAD misclassifying irrigated sites as nonirrigated. These misclassified sites were geographically distributed throughout the state. When the accuracy assessment was expanded to all interior pixels completely contained within each field, the overall accuracy of the MIrAD slightly declined to 78.2% (). The error matrix for this expanded set of 9688 validation pixels showed that the majority of classification errors within these fields (91%; 1921 of 2109 misclassified pixels) were attributed to the MIrAD misclassifying pixels within irrigated fields as nonirrigated. When the assessment was further expanded to include 27,933 edge pixels, the overall accuracy of the MIrAD substantially decreased to 64.5% (), illustrating the difficulty of classifying the 250-m pixels at the field’s edge because of the mixed spectral–temporal signal of the time-series NDVI data commonly associated with these pixels. The error matrix in also revealed that the majority of the thematic errors at the field’s edges in the MIrAD (91%) were the result of irrigated locations being assigned to the nonirrigated class. This is consistent with the results of Wardlow and Egbert (Citation2008), who found the edges of irrigated areas in Kansas to be consistently classified as nonirrigated because of lower peak NDVI signals from these mixed edge pixels, which is more representative of a nonirrigated crop. The irrigated area contained within the edge pixels included in this assessment ranged from 0.5% to 99%, and of the total 18,862 irrigated edge pixels, only 52.0% (9815 pixels) were correctly classified. In contrast, the specific within-field location of pixels (centroid versus other) had considerably less influence on the thematic accuracy of the MIrAD. For 250-m pixels that were homogeneous in terms of their irrigation status (i.e., 100% areal coverage within pixel), the level of classification accuracy between a pixel at the field’s center (79.3%, or 982 of 1238 total irrigated pixels correctly classified) and other pixels located completely within the field’s boundaries (71.4%, or 4801 of 6722 total irrigated pixels correctly classified) was similar. It should also be noted that the influence of new irrigated cropland in eastern Nebraska between the generation of the MIrAD in 2002 and the collection of the validation data in 2005 was shown by a higher rate of omitted irrigated fields by the MIrAD in this part of the state. The exact impact of irrigation expansion and the temporal offset of the validation data on the thematic accuracy of the MIrAD is unknown, but these results suggest that the actual classification accuracy of this data is slightly higher than what is reported in this paper. Overall, these results showed that for known sites of irrigated and rainfed agriculture in Nebraska, the MIrAD classified fields under these two land use practices across Nebraska with an overall thematic accuracy of ~80%.
Table 1. Overall, user’s (UA), and producer’s (PA) accuracy and Kappa results for the field centroids (a), all interior pixels (b), and both interior and edge pixels (c).
4.2.2. Accuracy assessment for varying field sizes
– present the accuracy assessment results of the MIrAD classification across various field sizes. Only the interior field pixels were considered in this part of the assessment, with the edge pixels removed because of their high classification error rate found in the previous section. Fields in the largest field size class (>480 acres or larger than three-quarters of a PLSS section) had the highest overall accuracy, with 83.3% of their interior pixels being correctly classified (). The MIrAD’s accuracy slightly declined to 77.9% when field sizes decreased to the next size class (320 to 480 acres or one-half to three-quarters of a PLSS section) (). The MIrAD also had similar classification performance over fields in the two smallest field size classes, with overall accuracies of 77.6% () and 76.3% (), respectively.
Table 2. Overall, producer’s (PA), and user’s (UA) accuracy and Kappa results by field size.
These results show that the MIrAD had a similar level of classification accuracy across the full range of field sizes in Nebraska. Given the moderate spatial resolution of the MODIS 250-m NDVI data, it might be expected that the classification accuracy of the MIrAD would decline as field sizes decreased. However, only a ~6% decrease in the overall accuracy of the MIrAD was found between fields in the largest and smallest size classes. In fact, the thematic accuracy of the MIrAD remained relatively unchanged for fields ranging from the third largest size class of 480 acres (~30 MODIS pixels) to a minimum of 80 acres (5–6 MODIS pixels). This indicates that unique irrigated and nonirrigated NDVI signals are detected at the pixel level in the MODIS 250-m data for the interior pixels of most fields, which have homogeneous LULC conditions (e.g., mono-culture crop under the same management practice). As a result, the classification approach implemented for the MIrAD appears to map the core areas of irrigated and rainfed agricultural fields of varying sizes with reasonable classification accuracy (i.e., >76%).
5. Conclusions
The overarching objective of this study was to conduct an intensive, multi-scale accuracy assessment of the MIrAD over Nebraska to address this knowledge gap for the US Central Great Plains region using the wealth of irrigation and LULC-related data-sets available for the intensively irrigated state of Nebraska. The specific research goals were to (1) determine the accuracy of classifying regional-scale irrigated and rainfed cropland patterns, (2) evaluate the performance of the classification technique over different crops types such as corn and soybeans, and (3) investigate the influence of field size and within-field position of pixels (i.e., interior versus edge) on classification accuracy. The classified pixel-level irrigated and rainfed cropland patterns in the MIrAD were found to be in close agreement with those of the Landsat-derived NE-LU map (82% of pixels in thematic agreement). The MODIS-based MIrAD and Landsat-based NE-LU classified nearly equivalent total irrigated acreage with less than 0.04 million acre (0.01 million ha) difference between the data-sets. Clump analysis of contiguous areas of pixels exhibiting thematic disagreement between the MIrAD and NE-LU data-sets revealed that 45% of the pixel-level disagreement was associated with small (<three 250-m pixels) or narrow linear (one pixel width) clumps, which were characteristic of mixed pixel locations in transitional areas between adjacent LULC types. Overall, these localized patterns of disagreement had little impact on the accuracy of the field- and landscape-level patterns mapped in the MIrAD. For the larger ‘disagreement clumps’, with a size and shape characteristic of individual fields, the MIrAD was found to have primarily omitted irrigated crops over these areas. The 3-year temporal offset between the generation of the MIrAD map and the creation of the NE-LU map and collection of supporting ground-truth data used in this study introduced some omission error into the MIrAD accuracy results because of rainfed-to-irrigation cropland conversion in eastern Nebraska rather than classification error. Assessment of the MIrAD results with known locations of irrigated and rainfed fields along with clump analysis both revealed an increased rate of irrigation omission error over eastern parts of the state that had experienced steady irrigation expansion between 2002 and 2005. This suggests that the thematic accuracy and the pixel-level agreement of the MIrAD with the NE-LU is slightly higher than the reported values from this study.
Further cross-comparison of these disagreement pixel clumps with the USDA CDL showed that most of these locations corresponded to mixed crops (multiple crop types corresponding to the pixels within a clump), range/pasture, or corn. There was no apparent trend of misclassifying a specific crop or other land cover type in the MIrAD because the observed thematic disagreement was relatively evenly distributed across these three LULC classes and represented a very small percentage of the state’s total cropland area (9%). Field-level analyses showed the MIrAD classification approach performed equally well across the entire range of field sizes, with only a 7% decrease in accuracy between the largest and smallest fields. The impact of the position of pixels within a field on thematic accuracy was minimal, with only a 4% decrease in overall classification accuracy of pixels at the field’s center (82.5%) compared to the surrounding pixels located completely within the field’s boundaries (78.2%). A more dramatic decrease in accuracy to 64.5% occurred when the mixed edge pixels at the field’s boundaries were considered. Collectively, these results indicate that distinct irrigated and rainfed crop signals are detected at the field scale in the time-series MODIS 250-m NDVI data, allowing the interior pixels of fields to be classified with a relatively high accuracy (>78%) across the state of Nebraska.
The extensive multi-scale accuracy assessment presented in this paper shows that the 250-m MIrAD represents a high-quality, consistent classification of irrigated cropland across an area of the Central Great Plains with diverse climatic conditions and crop types as well as varying field sizes. Because the MIrAD classification methodology uses maximum NDVI values bounded areally with the USDA acreage statistics, the classified irrigation areas represent crop locations where targeted water applications were applied to maximize crop growth (i.e., higher NDVI values) during the acquisition year of the remote sensing source data. The MIrAD evaluated in this study is representative of irrigation patterns for 2002 because both the source MODIS and the USDA Crop Census data used to generate the classification were acquired for that year. The potential exists to develop annual updates of the MIrAD using year-specific MODIS and the USDA crop acreage statistics that reflect the yearly distribution of fields that are irrigated across large areas. Work has recently been completed to develop a 2007 MIrAD applying the same classification strategy to updated MODIS and the USDA Census data for that year and was shown by Brown and Pervez (Citation2014) to be useful for detecting change in the spatial extent of irrigated agriculture. Pervez and Brown (Citation2010) note that 2002 was a relatively dry year across most of the United States with persistent drought conditions over areas such as Nebraska, which provided an enhanced peak NDVI difference between irrigated and rainfed crops that was beneficial for discriminating these two land use classes. The next step would be to test the MIrAD methodology for years of normal to above-normal precipitation to see if the less-pronounced NDVI difference between irrigated and nonirrigated sites reduced the classification accuracy of this automated mapping approach. Although this study was limited to a single state and year, the results indicate that the MIrAD classification approach is a viable, robust approach for classifying and mapping field-level irrigated and nonirrigated crop patterns across the US Great Plains landscape.
Acknowledgments
The authors thank Deb Wood of the National Drought Mitigation Center for her thorough editorial review of this paper. We also thank Jesslyn Brown and Shahriar Pervez of the US Geological Survey (USGS) Earth Resources Observation and Science (EROS) Center for providing the MIrAD analyzed in this study and their comments and background information regarding the MIrAD classification methodology. We acknowledge the Vegetation Drought Response Index (VegDRI) project, which was a primary target application for the development of the initial MIrAD product, and the NDMC for providing us an opportunity to conduct this study. We also recognize the Center for Advanced Land Management Information Technologies (CALMIT) and Dr. James Merchant and Patti Dappen for providing the various ground-truth irrigation and LULC data-sets for Nebraska.
References
- Bauer, M. E., M. M. Hixson, B. J. Davis, and J. B. Etheridge. 1978. “Area Estimation of Crops by Digital Analysis of Landsat Data.” Photogrammetric Engineering and Remote Sensing 44: 1033–1043.
- Brown, J. F., S. Maxwell, and M. S. Pervez. 2009. “Mapping Irrigated Lands Across the United States Using MODIS Satellite Imagery.” In Remote Sensing of Global Croplands for Food Security, edited by P. S. Thenkabail, J. G. Lyon, H. Turral, and C. M. Biradar, 177–198. Boca Raton, FL: Taylor and Francis.
- Brown, J. F., and M. S. Pervez. 2014. “Merging Remote Sensing Data and National Agricultural Statistics to Model Change in Irrigated Agriculture.” Agricultural Systems 127: 28–40. doi:10.1016/j.agsy.2014.01.004.
- Burbach, M. 2008. “Density of Active Registered Wells – January 2008.” Conservation and Survey Division and School of Natural Resources Map Series. Accessed August 19, 2014. http://snr.unl.edu/csd-esic/GWMapArchives/2008GWMaps/ActiveIrrWellDensity2008.jpg
- Chang, J., M. C. Hansen, K. Pittman, M. Carroll, and C. DiMiceli. 2007. “Corn and Soybean Mapping in the United States Using MODIS Time-series Data Sets.” Agronomy Journal 99: 1654–1664. doi:10.2134/agronj2007.0170.
- Craig, M. E. 2001. “The NASS Cropland Data Layer Program.” Third annual international conference on geospatial information in agriculture, Denver, CO, November 5–7.
- Dappen, P., J. Merchant, I. Ratcliffe, and C. Robbins. 2007. Delineation of 2005 Land Use Patterns for the State of Nebraska Department of Natural Resources: Final Report. Lincoln: Center for Advanced Land Management Information Technologies, University of Nebraska-Lincoln.
- DeFries, R. S., and A. S. Belward. 2000. “Global and Regional Land Cover Characterization from Satellite Data: An Introduction to the Special Issue.” International Journal of Remote Sensing 21 (6): 1083–1092. doi:10.1080/014311600210083.
- Doraiswamy, P. C., T. R. Sinclair, S. Hollinger, B. Akhmedov, A. Stern, and J. Prueger. 2005. “Application of MODIS Derived Parameters for Regional Crop Yield Assessment.” Remote Sensing of Environment 97 (2): 192–202. doi:10.1016/j.rse.2005.03.015.
- Egbert, S., and B. Mercier. 2000. “Evaluation of Time-series Landsat Thematic Mapper and Derived Spectral Indices for Differentiating Irrigated and Non-irrigated Cropland in a Semi-arid Environment.” Proceedings of the American society of photogrammetry and remote sensing annual meeting, Washington, DC, May 21–26.
- Gitelson, A. A., A. Vina, T. J. Arkerbauer, D. C. Rundquist, G. Keydan, and B. Leavitt. 2003. “Remote Estimation of Leaf Area Index and Green Leaf Biomass in Maize Canopies.” Geophysical Research Letters 30 (5): 1248. doi:10.1029/2002GL016450.
- High Plains Regional Climate Center. 2010. Historical Climate Data Summaries. Lincoln, NE: NOAA High Plains Regional Climate Center. http://www.hprcc.unl.edu/data/historical/.
- Homer, C., C. Huang, L. Yang, B. Wylie, and M. Coan. 2004. “Development of a 2001 National Land-Cover Database for the United States.” Photogrammetric Engineering and Remote Sensing 70 (7): 829–840. doi:10.14358/PERS.70.7.829.
- Keene, K. M., and C. D. Conley. 1980. “Measurement of Irrigated Acreage in Western Kansas from Landsat Images.” Environmental Geology 3 (2): 107–116. doi:10.1007/BF02473477.
- Lobell, D. B., and G. P. Asner. 2004. “Cropland Distributions from Temporal Unmixing of MODIS Data.” Remote Sensing of Environment 93: 412–422. doi:10.1016/j.rse.2004.08.002.
- Maxwell, S. K., J. R. Nuckols, M. H. Ward, and R. M. Hoffer. 2004. “An Automated Approach to Mapping Corn from Landsat Imagery.” Computers and Electronics in Agriculture 43 (1): 43–54. doi:10.1016/j.compag.2003.09.001.
- Odenweller, J. B., and K. I. Johnson. 1984. “Crop Identification Using Landsat Temporal-spectral Profiles.” Remote Sensing of Environment 14 (1–3): 39–54. doi:10.1016/0034-4257(84)90006-3.
- Oetter, D. R., W. B. Cohen, M. Berterretche, T. K. Maiersperger, and R. E. Kennedy. 2001. “Land Cover Mapping in an Agricultural Setting Using Multiseasonal Thematic Mapper Data.” Remote Sensing of Environment 76 (2): 139–155. doi:10.1016/S0034-4257(00)00202-9.
- Ozdogan, M., and G. Gutman. 2008. “A New Methodology to Map Irrigated Areas Using Multi-temporal MODIS and Ancillary Data: An Application Example in the Continental US.” Remote Sensing of Environment 112 (9): 3520–3537. doi:10.1016/j.rse.2008.04.010.
- Ozdogan, M., and C. E. Woodcock. 2006. “Resolution Dependent Errors in Remote Sensing of Cultivated Areas.” Remote Sensing of Environment 103 (2): 203–217. doi:10.1016/j.rse.2006.04.004.
- Pervez, M. S., and J. F. Brown. 2010. “Mapping Irrigated Lands at 250-m Scale by Merging MODIS Data and National Agricultural Statistics.” Remote Sensing 2 (10): 2388–2412. doi:10.3390/rs2102388.
- Price, K. P., S. L. Egbert, M. D. Nellis, R. Y. Lee, and R. Boyce. 1997. “Mapping Land Cover in a High Plains Agro-ecosystem Using a Multidate Landsat Thematic Mapper Modeling Approach.” Transactions of the Kansas Academy of Science (1903-) 100 (1/2): 21. doi:10.2307/3628436.
- Qi, S. L., A. Konduris, D. W. Litke, and J. Dupree. 2002. Classification of Irrigated Land Using Satellite Imagery, the High Plains Aquifer, Nominal Date 1992, 31 pp. U.S. Geological Survey Water Resources Investigations Report 02-4236. Reston, VA: U.S. Geological Survey.
- Svoboda, M., D. LeComte, M. Hayes, R. Heim, K. Gleason, J. Angel, B. Rippey, et al. 2002. “The Drought Monitor.” Bulletin of the American Meteorological Society 83 (8): 1181–1190.
- Thelin, G. P., and F. J. Heimes. 1987. Mapping Irrigated Cropland from Landsat Data for Determination of Water use from the High Plains Aquifer in Parts of Colorado, Kansas, Nebraska, Oklahoma, South Dakota, Texas, and Wyoming, 1–38. U.S. Geological Survey Professional Paper 1400-C. Reston, VA: U.S. Geological Survey.
- Townshend, J. R. G., and C. Justice. 2002. “Towards Operational Monitoring of Terrestrial Systems by Moderate-Resolution Remote Sensing.” Remote Sensing of Environment 127: 28–40.
- USDA. 2008. “2007 Census of Agriculture: Farm and Ranch Irrigation Survey. Volume 3 Special Studies Part 1.” United States Department of Agriculture. http://www.agcensus.usda.gov/Publications/2007/Online_Highlights/Farm_and_Ranch_Irrigation_Survey/fris08_1_01.pdf
- USDA. 2012. Common Land Unit Information Sheet. Washington, DC: United States Department of Agriculture. http://www.fsa.usda.gov/Internet/FSA_File/clu__infosheet_2012.pdf
- USDA-NASS. 2004. 2002 Census of Agriculture, Summary and State Data; Geographic Area Series, Part 51, Volume 1. AC-02-A-51. Washington, DC: U.S. Department of Agriculture, National Agricultural Statistics Service. http://www.nass.usda.gov/census/ census02/volume1/us/USVolume104.pdf
- USDA-NASS. 2005. USDA-NASS Quick Stats: Field Crops U.S. Washington, DC: Department of Agriculture, National Agricultural Statistics Service. http://quickstats.nass.usda.gov/
- Vogelmann, J. E., S. M. Howard, L. Yang, C. R. Larson, B. K. Wylie, and J. N. Van Driel. 2001. “Completion of the 1990’s National Land Cover Data Set for the Conterminous United States.” Photogrammetric Engineering and Remote Sensing 67: 650−662.
- Wardlow, B. D., and S. L. Egbert. 2003. “A State-level Comparative Analysis of the GAP and NLCD Land-cover Data Sets.” Photogrammetric Engineering and Remote Sensing 69 (12): 1387–1397. doi:10.14358/PERS.69.12.1387.
- Wardlow, B. D., and S. L. Egbert. 2008. “Large-area Crop Mapping Using Time-series MODIS 250 m NDVI Data: An Assessment for the U.S. Central Great Plains.” Remote Sensing of Environment 112 (3): 1096–1116.
- Wardlow, B. D., and S. L. Egbert. 2010. “A Comparison of MODIS 250-m EVI and NDVI Data for Crop Mapping: A Case Study for Southwest Kansas.” International Journal of Remote Sensing 31 (3): 805–830. doi:10.1080/01431160902897858.
- Wardlow, B. D., S. L. Egbert, and J. H. Kastens. 2007. “Analysis of Time-Series MODIS 250 M Vegetation Index Data for Crop Classification in the U.S. Central Great Plains.” Remote Sensing of Environment 108: 290–310. doi:10.1016/j.rse.2006.11.021.
- Wilson, B., J. Bartley, K. Emmons, J. Bagley, J. Wason, and S. Stankiewicz. 2005. Water Information Management and Analysis System, Version 5, for the Web User Manual, 37. Kansas Geological Survey Open File Report 2005-30. Lawrence: Kansas Geological Survey.