
Abstract
A map showing various urban features, such as buildings, roads, and vegetation, is useful for a variety of urban planning applications. The objective of this study was to incorporate road and parcel GIS data as well as relevant expert knowledge to classify different urban land covers from 1-meter, 4-band NAIP images. Based on a hybrid simultaneous-classification and one-by-one-classification approach, a total of 14 urban classes are classified. The classification map has an overall accuracy of 90%, demonstrating a noticeable improvement over past comparable studies on detailed urban land cover classification.
1. Introduction
Urban environments are dynamic and undergoing fast changes. Unplanned urban development may bring problems such as air pollution, traffic congestion, and urban heat island effect that can cause adverse environmental impact and degradation of living quality (Ban, Hu, and Rangel Citation2010). To minimize urban growth problems, urban planners develop strategies and policies for sustainable growth in housing and transportation development. Mapping and monitoring impervious land covers and their changes in a timely and accurate manner is important for sustainable planning, particularly for endeavors to mitigate the adverse effects of urban heat island (Jensen Citation2000). As remote sensing images allow urban planners to monitor the current distribution of impervious covers, developing efficient digital image processing methods to map varied land covers is essential for urban heat island mitigation and management. In this context, the objective of this study is to classify detailed urban land covers from digital remote sensing images, with a focus on impervious land covers. Specifically, the interest is in distinguishing bright vs. dark building roofs, shady vs. clear road surface, as well as parking surface of different sizes. These different impervious covers have different solar reflectance/thermal emissivity, and their locational information will be useful for urban heat island mitigation. For example, knowing the neighborhood roads where tree shades are lacking allows planners to target areas for urban greening projects, which can reduce urban heat through vegetation evapotranspiration. A map showing the locations of commercial/industrial buildings of dark-colored roofs is useful for targeted promotion of light-colored roof materials that will absorb less heat.
Object-based image analysis (OBIA) has been used to extract the urban features of roads (Das, Mirnalinee, and Varghese Citation2011), buildings (Tenenbaum, Yang, and Zhou Citation2011), cars (Leduc and Lavigne Citation2007), trails (Cao et al. Citation2007), trees (Ardila et al. Citation2012; Madsen et al. Citation2011), and shadows (Taubenböck et al. Citation2010). Most studies focus on a small number of prominent/distinct classes, e.g., road, building, vegetation, and bare ground (e.g., Del Frate et al. Citation2011; Simler Citation2011; Ni Citation2011). Some OBIA studies have extracted numerous urban features with fair outcomes. For example, Puissant, Zhang, and Skupinski (Citation2012) classified a total of 11 classes with a focus on varied building features and achieved an overall accuracy of 79%. Pu, Landry, and Yu (Citation2011) classified a total of nine classes with a focus on different types of vegetation and achieved an overall accuracy of 78%. To contribute to the field of detailed urban land cover classification, this study intends to classify a total of 14 urban classes with a focus on buildings, roads, and parking covers.
The values of supplemental information and human knowledge for digital image classification have long been widely recognized (Enslin, Ton, and Jain Citation1987; Huang and Jensen Citation1997; Merchant and Nanllnalani Citation2009). Ancillary data and information may be incorporated into image classification processes before, during, or after classification, through geographical stratification, classifier operations, post-classification sorting, and advanced methods for multisource data analysis (Jensen Citation2005; Merchant and Nanllnalani Citation2009). For example, Homer et al. (Citation1997) stratified a state-wide Landsat TM image into three ecoregions for subsequent land cover classification. To classify varied types of vegetation, Yu et al. (Citation2006) incorporated topographic parameters of elevation, slope, aspect, and distance to watercourses as discriminating criteria, in addition to image spectral statistics. Mesev (Citation1998) used dwelling density data to adjust a priori probabilities of urban classes for maximum-likelihood classification. Lunetta et al. (Citation2003) overlaid road GIS data with initially classified urban areas to segregate impervious surface areas. Huang and Jensen (Citation1997) incorporated terrain, soils, and wind fetch data into a rule-based decision tree classifier for wetland land cover classification.
Most image classification studies incorporate ancillary GIS data to classify lower-level land use/cover from coarse-resolution images; few studies have used fine-scale GIS and image data for detailed urban land cover classification. Moreover, there is a need to explore the uses of urban road network and cadastral parcel data for urban feature extraction, as these data have become commonly available in the U.S. Specifically, the U.S. Census Bureau updates a GIS road network data-set for the entire U.S. annually, which the general public can freely access through the TIGER Products website (http://www.census.gov/geo/maps-data/data/tiger.html). All counties in the U.S. maintain a cadastral parcel database for assessing and levying real estate property tax, and many counties have established online GIS-based cadastral databases to allow public access to parcel information (http://www.esri.com/industries/cadastre/business/public_access). For these reasons, this study intends to contribute to methodology of incorporating road and parcel GIS data for detailed urban land cover classification.
Multi-class image classification can be conducted by discriminating classes simultaneously, one by one, or with a hybrid approach (Lunetta et al. Citation2003; Overwatch Systems Citation2004; Myint et al. Citation2011). The traditional ‘simultaneous classification’ distinguishes all classes at the same time based on class membership function and signature separability. In contrast, the relatively uncommon ‘one-by-one classification’ uses object-based analysis to extract one class at a time and merges individual results at the end. While simultaneous classification is the standard multi-class classification approach in remote sensing, and is mostly effective in separating classes, one-by-one classification allows the analyst to focus on specific object attributes unique to the class of interest and use specific extraction rules and parameters for the target class (Myint et al. Citation2011). One-by-one classification also gives the analyst more flexibility in incorporating ancillary data and information into individual class extraction (e.g., Lunetta et al. Citation2003). Past multi-class classification studies often rely on simultaneous classification (e.g., Mladinich Citation2010; Madsen et al. Citation2011; Pereira et al. Citation2013) and rarely use the one-by-one classification approach (e.g., Weih and White Citation2008; Yuan Citation2008), while a hybrid classification approach is adopted by some studies to take advantage of the desired properties of individual approaches. For instance, Crocetto and Tarantino (Citation2009) first generated spectral clusters using Iterative Self Organizing Data Analysis (ISODATA) and subsequently classified separate clusters containing mixed classes into individual classes. Myint et al. (Citation2011) first performed an object-based image segmentation and then assigned segmented objects with individual or groups of classes based on class-oriented feature space (different bands, indices, or composite bands), level of scales, as well as classification parameters and rules. In this research, the study area contains land features of distinctive shapes suitable to be extracted individually as well as features of irregular shapes suitable to be classified simultaneously. A hybrid classification approach is therefore adopted to cope with this diverse urban landscape. Specifically, the hybrid approach first extracts individual classes one by one. Then the classes having considerable overlaps are further re-extracted jointly.
Two of the common OBIA techniques are image segmentation and template matching (Quackenbush Citation2004; Blaschke, Lang, and Hay Citation2008; Nixon and Aguado Citation2008). The image segmentation approach is implemented by ‘subdividing the image into meaningful homogeneous regions based on shape, texture, size, and other features as well as spectral characteristics, and organizing them hierarchically as image objects (Jensen Citation2009, 275)’. This hierarchical organization contains information of the relationships of image objects with their super- and sub-objects as well as with their neighboring objects at the same level (Blaschke Citation2010; de Pinho et al. Citation2012; Zhang, Xie, and Selch Citation2013). Image objects can be further classified into different land cover classes based on the relationship information as well as their object attributes using certain classification algorithm (Du et al. Citation2013; Long et al. Citation2013; Zhang et al. Citation2012).
In contrast to the image segmentation approach, the template-matching approach is implemented by specifying an input representation, which is a window of certain pattern of pixels. Through the window, relevant information for classifying the center pixel is gathered (Quackenbush Citation2004; Oller Citation2012). At the training stage of classification, the template-matching approach positions the center cell of the selected input representation over each of the training pixels and records the spectral information of pixels in the input representation. User-defined algorithms are then used to calculate critical spatial characteristics, e.g., shape, size, color, texture, pattern, shadow, and association, and build a learning profile for the target land cover class (Opitz and Blundell Citation2008; Fiorentino et al. Citation2010). At the classification stage, the template-matching approach positions the center cell of the input representation over each pixel in the image and calculates the pixel profile; if the pixel profile matches the learning profile for a particular land cover class, then the target pixel is classified as the class.
The template-matching technique requires preliminary knowledge of the target class for defining training templates, while the image segmentation technique demands more exploratory analysis for an optimal segmentation scale. The template-matching technique appears to be efficient for extracting features with regular geometrical and contextual properties, while the image segmentation technique appears to be robust in classifying diverse land covers. Most commercial OBIA software are built upon the image-segmentation methodology, e.g., eCognition®, ENVI FX®, and IMAGINE Objective®, with the exception of Feature Analyst® that mainly relying on the template-matching mechanism (Quackenbush Citation2004; Opitz and Blundell Citation2008). Most OBIAs rely on the image segmentation methodology and, consequently, factors of the template-matching method are rarely studied. This study intends to fill this gap by examining the two key parameters in the template-matching approach, i.e., input representation and pattern width (Miller, Nelson, and Hess Citation2009; Oller Citation2012). How these two parameters affect the extraction results will be empirically assessed. The findings will benefit future analyses using the template-matching method.
In the following sections, the study area and data-sets for this research are first introduced. We then describe the procedures of analyzing factors of the template-matching method, the processes of using a hybrid classification approach, as well as methods for incorporating parcel and road data into feature extraction. Following that, the analysis results, classification map, and accuracy assessment are presented. Lastly, we discuss some methodological issues and summarize major findings from this study.
2. Study area and data-sets
Study area for this research is within the city of Nixa, Missouri, approximately 2 kilometers south of the city of Springfield, a major urban center in Southwest Missouri (). Nixa is 35 kilometers north of the city of Branson, a popular destination for tourists from Missouri and the surrounding states. Highway 160 is the main access route to Springfield and Branson. As an outlying community within the Springfield Metropolitan Statistical Area, Nixa has experienced rapid growth in recent years. According to U.S. Census Bureau, the population of Nixa grew from 12,124 in 2000 to 19,022 in 2010, an increase of 57%. A timely and accurate update of database of urban land covers is important for managing the city’s rapid growth and planning for sustainable development.
Figure 1. The city of Nixa and 100-year floodplains.
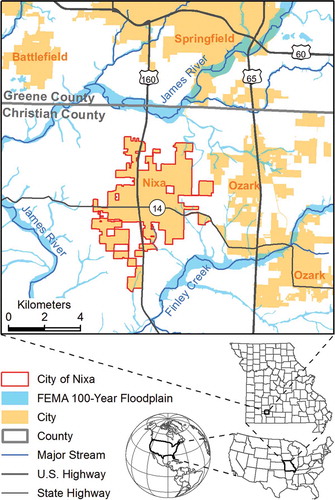
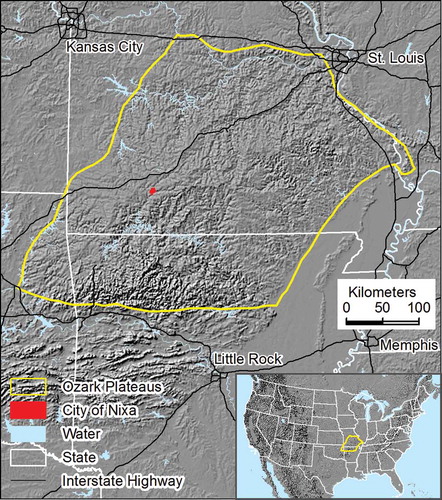
Situated in the Ozark Plateau physiographic region (), Nixa is known for a well-developed karst topography that has land forms of shafts, tunnels, caves, and sinkholes created by groundwater dissolving sedimentary rock such as limestone. Mapping impervious covers will help the development of sinkhole management strategies to preserve Nixa’s scenic natural environment. Furthermore, frequent flooding in this area makes the karst landscape fragile and vulnerable to erosion and pollution. Nixa has flood-prone areas in the riparian areas of the Finley River and its tributaries (). Locational information of varied impervious covers along floodplains is critical for flood hazard management.
Figure 2. The Ozark Plateau.
A small area was selected within city of Nixa, Missouri to test detailed urban land cover classification of nine classes (). The area is approximately 0.9 kilometers wide and 1.3 kilometers long, covering an area of 1.1 square kilometers. The relatively small area allows us to closely assess classification results by visually inspecting confusions between classes, and to specifically examine how morphological properties are relevant to the template-matching parameters of input representation and pattern width. This area contains varied forms of roads, buildings, and parking surfaces in residential and non-residential land use; it is therefore suitable for detailed urban land cover classification.
Figure 3. Color infrared NAIP image for the study area and the corresponding parcel land use.
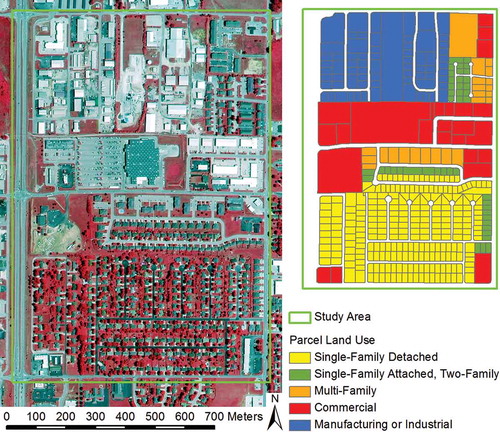
One-meter, 4-band, NAIP (National Agriculture Imagery Program) digital aerial photographs of year 2012 are used for analysis. The NAIP imagery is a valuable image source because the images are ortho-rectified, freely available to the public, and have been planned to be acquired yearly for the entire conterminous U.S. by the U.S. Department of Agriculture. Many states have NAIP imagery coverage as early as year 2003, although earlier years of NAIP images may only have three bands available (RGB bands, instead of an additional near-infrared band) or with a 2-meter resolution. NAIP images of 1-meter and 4-band specifications have become the standard for many states since year 2008.
Parcel and road data from the Planning and Zoning Department of Christian County are obtained, which will be used as ancillary data for land cover classification from NAIP imagery.
3. Analysis procedures
3.1. Determining classification scheme and selecting training samples
With a focus on impervious surface, we develop a classification scheme of 14 classes that includes a variety of urban land covers (). The 14 classes are determined based on what can be visually observed from NAIP image of the study area. Specifically, we first separate pervious from impervious surface. For impervious surface, three types of urban features are distinguished: buildings, roads, and parkings. Buildings are categorized to either residential or non-residential. For non-residential buildings, bright roofs are separated from dark roof. For residential buildings, small structures are separated from large structures. Residential small structures are either single-family houses or duplexes, while residential large structures are mainly apartments. Road are categorized to either shaded roads or non-shaded roads. Parkings are categorized to three types: residential small parking, residential large parking, and non-residential parking. Residential small parkings are driveways of single-family and duplexes. Residential large parkings are apartment parking lots. Non-residential parkings are either paved parking lots or pebble/sand/dirt parking surfaces in industrial/manufacturing sites.
Table 1. A 14-class classification scheme.
For pervious surface, three types of urban features are distinguished: tree/shrub, grass, and barren/dirt, depending on the amount of vegetation growth. Barren/dirt surface is land covered with dirt, sand, or pebble. Further, noticeable shadows can be observed in the study area image. We therefore include building shadow and tree/shrub shadow into the classification scheme ().
Representative training samples throughout the study area are manually selected by visually examining the study area image. The training samples are delineated as small polygons for different urban features (). Importantly, the sample polygons are drawn in a way that is close to the boundaries of different classes. This approach allows the template-matching method to be most effective by incorporating geometric information for the target class and contextual information of its neighboring classes (Overwatch Systems Citation2010a, Citation2010b; Lee Citation2011). The number of training samples for each class () is sufficient based on the general rule that the number of pixels of training data should be at least ten times the number of bands used in classification (Jensen Citation2005), which is 40 in our case.
Figure 4. Training sample polygons for the 14 classes.
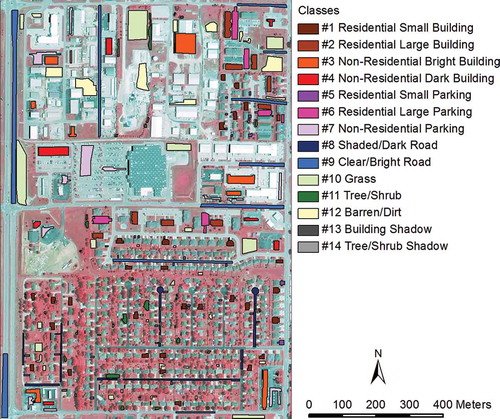
Table 2. Number and proportion of training and validation samples (pixels) for the 14 classes. See for class names.
3.2. Investigating factors of template-matching method
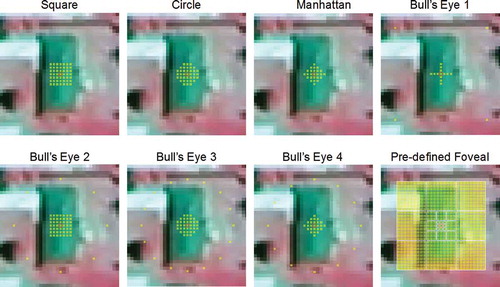
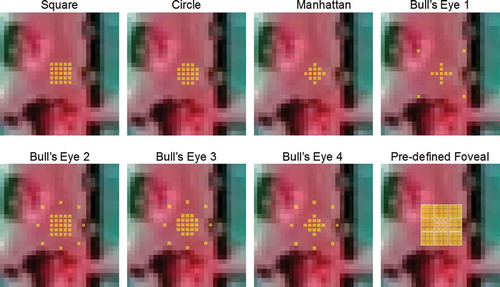
It is important to understand factors of the template-matching method before applying the method for urban feature extraction. We focus on two critical parameters of the template-matching method, input representation, and pattern width (Miller, Nelson, and Hess Citation2009; Oller Citation2012). The effect of input representation on feature extraction is investigated by comparing feature extraction results from eight default input representations in Feature Analyst® (). The eight pre-defined input representations can be categorized into focal vs. contextual types of input representation. The three focal types, including the Circle, Square, and Manhattan input representations, are characterized by a group of pixels aggregated in different shapes, which appear useful for extracting features of distinguishing shapes. The five contextual types, including the Pre-defined Foveal input representation and four forms of Bull’s Eye input representations, intend to capture geometrical characteristics and contextual relationships (Vanderzanden and Morrison Citation2002; Miller, Nelson, and Hess Citation2009). The four Bull’s Eye input representations focus on a number of regularly spaced pixels surrounding aggregated central pixels in a distance. The Pre-defined Foveal input representation assigns more weights to pixels closer to the center and less weights to pixels farther from the center (Opitz and Blundell Citation2008). Past feature extraction studies using the template-matching approach generally determine the optimal input representation by trial and error (e.g., Vanderzanden and Morrison Citation2002; Miller, Nelson, and Hess Citation2009; Lee Citation2011; Tsai, Stow, and Weeks Citation2011); the general consensus is that contextual types of input representation are mostly suitable for extracting features of distinctive shapes, such as streams, roads, houses. To assess this notion, we will compare the extraction of building vs. grass, which may represent features with and without distinctive shapes, respectively.
Figure 5. Eight types of input representations with corresponding pattern widths, referenced to an image of a single-family house.
Another key factor of the template-matching method is pattern width, which is the window size of a defined input representation. Findings from past studies have suggested that an appropriate pattern width for the contextual type of input representation should be large enough to cover some background of the feature of interest (Vanderzanden and Morrison Citation2002; Lee Citation2011). To investigate this notion, as well as how feature extraction results vary with specified pattern widths, the extraction results from a series of pattern width are compared.
3.3. Classifying 14 urban classes using a hybrid classification approach
This study uses a hybrid classification approach that integrates one-by-one with simultaneous classification to extract urban features (). Individual classes are first extracted one by one. Then classes of considerable confusions are re-extracted jointly. The feature extraction is conducted using the template-matching methodology in Feature Analyst®, with optimal input representation and pattern width from initial empirical analysis. Results from individual and joined extractions are lastly merged as the classification map.
Figure 6. Flow chart of the hybrid classification methodology.
Understanding that there could be overlapping between individual extraction results, we adopt a prioritization strategy to resolve this issue: more spectrally homogeneous classes will take precedence over less spectrally homogeneous classes; more regularly shaped classes will take precedence over less regularly shaped classes (). This strategy is based on the notion that regularly shaped and spectrally homogeneous classes will have more accurate extraction results than classes that are irregularly shaped and spectrally heterogeneous. This spatial prioritization is implemented through masking or clipping processes. The masking operation is performed before classifying low-priority features, while the clipping operation is performed after classifying low-priority features. Specifically, using the masking approach, the extraction of low-priority class is conducted only for areas not falling within initially extracted high-priority classes. In contrast, using the clipping approach, the extracted low-priority class is retained only for areas not overlapping with initially extracted high-priority classes. Based on the prioritization principles, the extracted non-residential dark building is superseded by the extracted non-residential bright building because the latter class is more spectrally homogeneous. The extracted tree/shrub shadow is superseded by the extracted building shadow because the latter class is more regularly shaped. Additionally, considering the practical applications of extracted classes, we allow the building and road classes to take precedence over other classes. For instance, residential small parking areas are superseded by residential small buildings because building footprints have many important applications.
Figure 7. Illustration of the spatial prioritization strategy.
Some individually extracted classes may have considerable overlapping/confusion with other classes. Similar classes are re-extracted jointly to increase their separability. For example, residential large building and residential large parking have many confusions in the northeast study area; they are therefore re-extracted jointly. Grass, barren/dirt, and non-residential parking classes are re-extracted jointly because substantial confusions exist between grass and barren/dirt, as well as between barren/dirt and non-residential parking. These three classes together cover more than half of the study area. They are therefore extracted lastly after other classes are extracted.
3.4. Incorporating road and parcel data and relevant expert knowledge into feature extraction
Parcel and road GIS data and relevant knowledge are incorporated into individual or joined feature extractions, either through geographical stratification or post-classification sorting (reviewed in the Introduction section). For instance, knowing that residential small buildings and residential small parkings are only in single-family or two-family land uses, we only retain extracted areas within these two land uses. Understanding the requirements of minimum setback from property lines for single-family and two-family homes (City of Nixa Citation2014), the extracted residential small buildings are clipped to be within the respective parcel boundary buffers. Understanding that residential small parking areas are essentially driveways connected to roads, we remove extracted areas not connected to street-side parcel boundaries. Knowing that there are apartment driveways between residential large buildings and roads, extracted residential large building areas are clipped by buffered roads. The extracted buildings are also refined based on knowledge of their general sizes. For example, if the extracted residential small building polygons are smaller than 100 square meters, they are considered as errors and removed. Holes within buildings are also considered as errors and filled. Knowing that the parcel GIS database does not cover street surfaces, we limit the extraction of road surface to areas outside of parcel boundaries. The extraction of shaded/dark road is improved based on our familiarity that shaded/dark roads exist in the single-family neighborhood in the south part of the study area. The extracted building shadows are improved based on the knowledge that building shadows only exist on the west side of building in the image.
3.5. Assessing the final classification map
It is noticed that different urban classes could cover quite different sizes of areas (e.g., the grass area is 28 times of the building shadow area). A stratified random sampling scheme for accuracy assessment is therefore adopted to ensure adequate amount of samples for classes with small land areas. Specifically, a total of 1302 random samples with sample size for each class proportional to its classified area are generated (). Ground truth classes for those validation samples are interpreted by visually examining NAIP imagery on the background (). The overall accuracy and the Kappa coefficient are calculated to assess the classification map. The overall accuracy shows the percentage correct and is calculated by summing the numbers of correctly classified samples and then dividing by the total number of samples. The Kappa coefficient (Congalton Citation1991) denotes ‘the proportion of agreement that occurs beyond what would be expected by random spatial allocation of the classes, given the errors in the estimates of the proportions of the classes’ (Wu et al. Citation2009, 81). The confusion matrix along with producer’s and user’s accuracies for each class (Stehman Citation2009) is also calculated to examine individual class accuracies as well as their classification relationships.
4. Analysis results
4.1. Optimal template-matching parameters
For the analysis of input representation parameter, a visual examination of the extracted residential small buildings referenced with the original NAIP image () indicates that the five contextual types of input representation all have more accurate results than the three focal types of input representation when using comparable pattern width (). In contrast, the three focal types are more suitable for extracting grass than the five contextual types () based on corresponding pattern width (); additional contextual information provided from contextual types of input representation appears to introduce undesired noise and reduces the capability to distinguishing grass. Taken together, the analysis of input representation shows that the focal types of input representation are more appropriate for extracting irregularly shaped features, while the contextual types of input representation are more ideal for extracting features with distinctive shapes.
Figure 8. The source NAIP image and extracted residential small buildings based on eight types of input representation (IR).
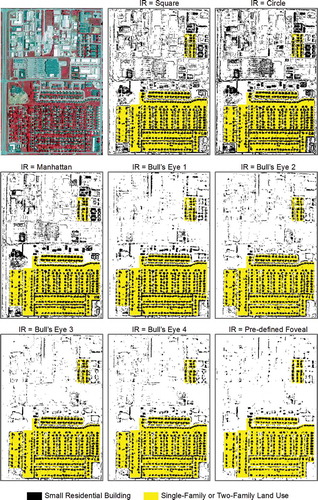
Figure 9. The source NAIP image and extracted grass areas based on eight types of input representation (IR).
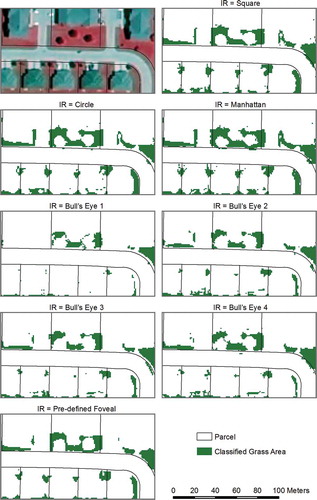
Figure 10. Eight types of input representations with corresponding pattern widths for extracting grass.
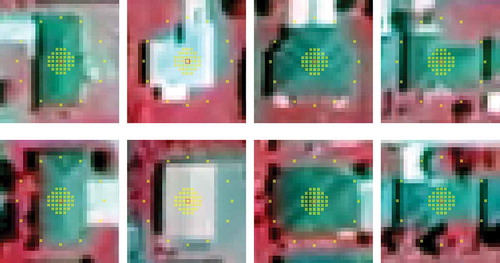
For the analysis of pattern width parameter, a visual examination of the extracted residential small buildings from nine pattern widths using the Bull’s Eye 3 input representation () indicates that a pattern width of 23 pixels (i.e., 23 meters) appears more suitable to separate residential small buildings from other building roofs or road surfaces of similar spectral characteristics. Observing eight sample images of a residential small building referenced with the Bull’s Eye 3 input representation at a pattern width of 23 pixels (), it is noticed that this pattern width is roughly the same length as the long side of the building. It seems that an ideal pattern width for extracting features with distinctive shapes approximates the length of the target feature.
Figure 11. Extracted residential small buildings from 9 pattern widths (PW) based on the Bull’s Eye 3 input representation.
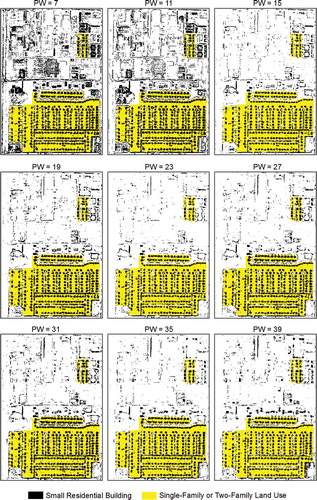
Figure 12. Sample images of residential small buildings referenced at a pattern width of 23 pixels of the Bull’s Eye 3 input representation.
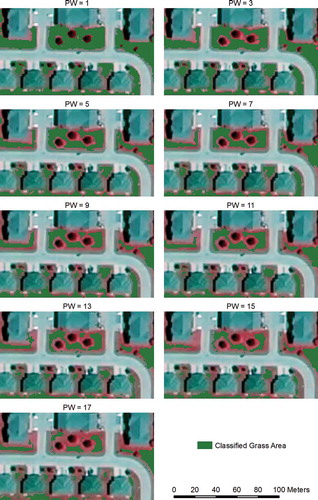
A visual examination of the extracted grass from nine pattern widths using the Manhattan input representation () indicates that small pattern widths have more accurate results than larger pattern widths. In our case, the extracted grass from a pattern width of 1 pixel is most representative of the actual grass area. It appears that an ideal pattern width for extracting features with irregular shapes approximates the image pixel size.
Figure 13. Extracted grass areas from 9 pattern widths (PW) based on the Manhattan input representation.
4.2. Classification map and accuracy assessment
The classification map () from the hybrid classification approach in conjunction with specified spatial prioritization rules achieves an overall accuracy of 90.3% and a Kappa coefficient of 0.88. Compared with a preliminary analysis using the conventional simultaneous-classification approach, a hybrid approach that integrates one-by-one classification with simultaneous classification proves effective in extracting complex urban features that contain mixed regularly shaped and irregularly shaped classes.
Figure 14. Classification map of 14 urban classes overlaid with 1302 validation samples.
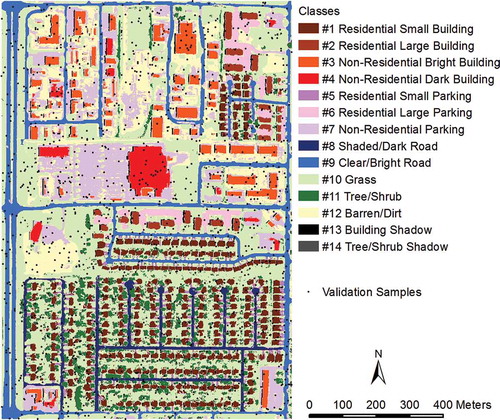
The confusion matrix along with producer’s and user’s accuracies for individual classes () shows that all four types of building and both types of road, as well as the grass class have relatively good producer’s accuracies larger than 90%, while tree/shrub and tree/shrub shadow classes have relatively poor producer’s accuracies smaller than 75%. In overall, the classes that are regularly shaped (e.g., buildings), spectrally homogeneous (e.g., grass), or with ancillary GIS data and expert knowledge incorporated in their extractions (e.g., roads) have relatively good classification results. On the other hand, the classes that are irregularly shaped, spectrally heterogeneous, or without ancillary GIS data and expert knowledge incorporated in the extraction (e.g., classes of barren/dirt, tree/shrub, and tree/shrub shadow) have relatively poor classification results.
Table 3. Confusion matrix by the number of validation samples. See for class names.
5. Discussion
This study adopts a hybrid classification approach that integrates one-by-one classification with simultaneous classification. The advantage of this approach is that it is able to better cope with a diverse urban landscape that contains land features of distinctive shapes as well as features of irregular shapes. The disadvantage of this approach is that it may be time-consuming as it requires extra data processing and analysis. It is also worth noting that the hybrid approach is more suitable to the template-matching-based OBIA than the image-segmentation-based OBIA, since one-by-one classification focuses on object templates and template parameters for individual classes.
The 90% overall accuracy of the classification map of 14 detailed urban classes is an improvement upon past comparable studies of detailed urban land cover classification, e.g., Bhaskaran, Paramananda, and Ramnarayan (Citation2010) and Ban, Hu, and Rangel (Citation2010). Bhaskaran, Paramananda, and Ramnarayan (Citation2010) classified a total of eight urban land covers with a focus on varied building features and achieved an overall accuracy of 85%. Ban, Hu, and Rangel (Citation2010) classified a total of 16 urban land covers with a focus on different types of vegetation and achieved an overall accuracy of 88%. The improvement is mostly due to the use of a hybrid classification approach that allows us to target individual classes for unique characteristics for feature extraction. In addition, the hybrid approach permits great flexibility in incorporating ancillary GIS data and expert knowledge to improve feature extraction.
This study adopts innovative approaches to incorporate relevant parcel and road GIS data and information for feature extraction. The analyses indicate that road and parcel data and relevant information are useful for urban feature extraction, particularly the information regarding minimum setback requirements. As parcel and road data are commonly available for populated urban areas, the adopted approaches are applicable to other areas. It is worth noting that researchers need to consider some common defects of ancillary data when using them in image analysis, including logical consistency, inaccurate topology (e.g., sliver polygons), and small map scale (Jensen Citation2009).
Within the four reviewed approaches for ancillary GIS data integration (in the Introduction section), this study only uses the geographic stratification and post-classification sorting approaches. The advantages of these two approaches are that they are straightforward and easy to implement. In contrast, the other two approaches, classifier operations and advanced methods for multisource data analysis, integrate ancillary GIS data into classification algorithms to discriminate between classes. Future research may explore these two approaches with road and parcel data for detailed urban land cover classification.
This study only uses the original four bands of NAIP image in analysis and does not include additional image indices or texture bands. Simple input channels allow us to efficiently experiment varied input representations and pattern widths to investigate their effects on template-matching-based feature extraction. The simplicity of the model also makes future application and comparison feasible. To improve classification accuracy, additional bands or indices could be incorporated to increase class separability in future studies. Another potential approach to improve the classification map is to apply cartographic or spatial aggregation tools that would make the classification map less speckled and perhaps more accurate.
Results showed that irregularly shaped features are best to be extracted with focal types of input representation and a pattern width that approximates the image pixel size, while features with distinctive shapes are best to be extracted with contextual types of input representation and a pattern width that approximates the target feature length. Understand that the sizes and widths of urban features may vary by locations, and the shapes of interested features may not be ideally symmetrical; findings from this research serve as guidelines for future studies on urban feature extraction. Also, outcomes from template-matching-based feature extraction may be sensitive to the pattern width used. It is therefore desirable for future studies to apply various inputs and pattern widths for classifying detailed urban features in different study areas.
6. Conclusions
This study classifies 14 types of urban features with a focus on impervious covers using a hybrid classification approach that integrates one-by-one classification with simultaneous classification. The template-matching OBIA is used to extract urban features individually or jointly from NAIP images, in conjunction with ancillary road and parcel data as well as relevant expert knowledge. The classification map has a satisfactory overall accuracy of 90%, indicating the hybrid classification approach is suitable for classifying detailed land covers in a complex urban landscape.
Empirical findings from this study allow people to better understand factors in the template-matching approach, specifically how input representation and pattern width affect the results. It is concluded that the focal types of input representation are appropriate for extracting irregularly shaped features, and the contextual types of input representation are ideal for extracting features with distinctive shapes. It is found that an ideal pattern width for extracting features with distinctive shapes approximates the length of the target feature, while an ideal pattern width for extracting features of irregular shapes approximates the image pixel size. These empirical findings will help future research on urban feature extraction using the template-matching approach.
References
- Ardila, J. P., W. Bijker, V. A. Tolpekin, and A. Stein. 2012. “Context-Sensitive Extraction of Tree Crown Objects in Urban Areas Using VHR Satellite Images.” International Journal of Applied Earth Observation and Geoinformation 15: 57–69. doi:10.1016/j.jag.2011.06.005.
- Ban, Y., H. Hu, and I. Rangel. 2010. “Fusion of Quickbird MS and RADARSAT SAR Data for Urban Land-Cover Mapping: Object-Based and Knowledge-Based Approach.” International Journal of Remote Sensing 31 (6): 1391–1410. doi:10.1080/01431160903475415.
- Bhaskaran, S., S. Paramananda, and M. Ramnarayan. 2010. “Per-Pixel and Object-Oriented Classification Methods for Mapping Urban Features Using Ikonos Satellite Data.” Applied Geography 30: 650–665. doi:10.1016/j.apgeog.2010.01.009.
- Blaschke, T. 2010. “Object-Based Image Analysis for Remote Sensing.” ISPRS Journal of Photogrammetry and Remote Sensing 65 (1): 2–16. doi:10.1016/j.isprsjprs.2009.06.004.
- Blaschke, T., S. Lang, and G. J. Hay, eds. 2008. Object-Based Image Analysis: Spatial Concepts for Knowledge-Driven Remote Sensing Applications. Berlin: Springer.
- Cao, L., D. Stow, J. Kaiser, and L. Coulter. 2007. “Monitoring Cross-Border Trails Using Airborne Digital Multispectral Imagery and Interactive Image Analysis Techniques.” Geocarto International 22 (2): 107–125. doi:10.1080/10106040701204073.
- City of Nixa. 2014. “One and Two Family Residential Construction Guidelines & Inspection Checklist.” Accessed September 4. http://www.nixa.com/modules/showdocument.aspx?documentid=278.
- Congalton, R. G. 1991. “A Review of Assessing the Accuracy of Classifications of Remotely Sensed Data.” Remote Sensing of Environment 37 (1): 35–46. doi:10.1016/0034-4257(91)90048-B.
- Crocetto, N., and E. Tarantino. 2009. “A Class-Oriented Strategy for Features Extraction from Multidate ASTER Imagery.” Remote Sensing 1: 1171–1189. doi:10.3390/rs1041171.
- Das, S., T. Mirnalinee, and K. Varghese. 2011. “Use of Salient Features for the Design of a Multistage Framework to Extract Roads from High-Resolution Multispectral Satellite Images.” IEEE Transactions on Geoscience and Remote Sensing 49 (10): 3906–3931. doi:10.1109/TGRS.2011.2136381.
- de Pinho, C. M. D, L. M. G Fonseca, T. S. Korting, C. M. de Almeida, and H. J. H Kux. 2012. “Land-Cover Classification of an Intra-Urban Environment Using High-Resolution Images and Object-Based Image Analysis.” International Journal of Remote Sensing 33 (19): 5973–5995. doi:10.1080/01431161.2012.675451.
- Del Frate, F., C. Pratola, G. Schiavon, and D. Solimini. 2011. “Automatic Features Extraction in Sub-Urban Landscape Using Very High Resolution Cosmo-Skymed SAR Images.” Paper presented at the 2011 IEEE International Geoscience and Remote Sensing Symposium (IGARSS), Vancouver, July 24–29.
- Du, Y., D. Wu, F. Liang, and C. Li. 2013. “Integration of Case-Based Reasoning and Object-Based Image Classification to Classify SPOT Images: A Case Study of Aquaculture Land Use Mapping in Coastal Areas of Guangdong Province, China.” GIScience & Remote Sensing 50 (5): 574–589.
- Enslin, W. R., J. Ton, and A. Jain. 1987. “Land Cover Change Detection Using A GIS-Guided, Feature-Based Classification of Landsat Thematic Mapper Data.” Paper presented at the Annual Convention of the American Society for Photogrammetry and Remote Sensing and ACSM, Baltimore, MD, March 29–April 3.
- Fiorentino, C., D. Ventrella, L. Giglio, E. Di Giacomo, and R. Lopez. 2010. “Land Use Cover Mapping of Water Melon and Cereals in Southern Italy.” Italian Journal of Agronomy 5 (2): 185–192. doi:10.4081/ija.2010.185.
- Homer, C. G., R. D. Ramsey, T. C. Edwards Jr., and A. Falconer. 1997. “Landscape Cover-Type Mapping and Modeling Using a Multi-Scene Thematic Mapper Mosaic.” Photogrammetric Engineering and Remote Sensing 63 (1): 59–67.
- Huang, X., and J. R. Jensen. 1997. “A Machine-Learning Approach to Automated Knowledge-Base Building for Remote Sensing Image Analysis with GIS Data.” Photogrammetric Engineering and Remote Sensing 63 (10): 1185–1194.
- Jensen, J. R. 2000. Remote Sensing of the Environment: An Earth Resource Perspective. Upper Saddle River, NJ: Prentice Hall.
- Jensen, J. R. 2005. Introductory Digital Image Processing: A Remote Sensing Perspective. Upper Saddle River, NJ: Prentice Hall.
- Jensen, J. R. 2009. “Image Classification.” In The SAGE Handbook of Remote Sensing, edited by T. A. Warner, M. D. Nellis, and G. M. Foody, 269–281. London: SAGE.
- Leduc, F., and D. A. Lavigne. 2007. “Comparing Several AFE Tools in the Context of Ships and Vehicles Detection Based on RGB and EO data.” Paper presented at the 10th International Conference on Information Fusion, Quebec, July 9–12.
- Lee, C. 2011. Feature Extraction from High Resolution Satellite Imagery as an Input to the Development and Rapid Update of a METRANS Geographic Information System (GIS). Final Report, METRANS Project AR 05-02. http://www.metrans.org/sites/default/files/research-project/AR05-02_Lee_final_Report_0_0.pdf.
- Long, J. A., R. L. Lawrence, M. C. Greenwood, L. Marshall, and P. R. Miller. 2013. “Object-Oriented Crop Classification Using Multitemporal ETM+ SLC-off Imagery and Random Forest.” GIScience & Remote Sensing 50 (4): 418–436.
- Lunetta, R. S., J. Ediriwickrema, J. Iiames, D. M. Johnson, J. G. Lyon, A. McKerrow, and A. Pilant. 2003. “A Quantitative Assessment of a Combined Spectral and GIS Rule-Based Land-Cover Classification in the Neuse River Basin of North Carolina.” Photogrammetric Engineering and Remote Sensing 69 (3): 299–310. doi:10.14358/PERS.69.3.299.
- Madsen, M. D., D. L. Zvirzdin, B. D. Davis, S. Petersen, and B. Roundy. 2011. “Feature Extraction Techniques for Measuring Piñon and Juniper Tree Cover and Density, and Comparison with Field-Based Management Surveys.” Environmental Management 47 (5): 766–776. doi:10.1007/s00267-011-9634-3.
- Merchant, J. W., and S. Nanllnalani. 2009. “Integrating Remote Sensing and Geographic Information Systems.” In The SAGE Handbook of Remote Sensing, edited by T. A. Warner, G. M. Foody, and M. D. Nellis, 257–268. London: SAGE.
- Mesev, V. 1998. “The Use of Census Data in Urban Image Classification.” Photogrammetric Engineering and Remote Sensing 64 (5): 431–438.
- Miller, J. E., S. A. C. Nelson, and G. R. Hess. 2009. “An Object Extraction Approach for Impervious Surface Classification with Very-High-Resolution Imagery.” The Professional Geographer 61 (2): 250–264. doi:10.1080/00330120902742920.
- Mladinich, C. S. 2010. “An Evaluation of Object-Oriented Image Analysis Techniques to Identify Motorized Vehicle Effects in Semi-Arid to Arid Ecosystems of the American West.” GIScience & Remote Sensing 47 (1): 53–77. doi:10.2747/1548-1603.47.1.53.
- Myint, S. W., P. Gober, A. Brazel, S. Grossman-Clarke, and Q. Weng. 2011. “Per-Pixel vs. Object-Based Classification of Urban Land Cover Extraction Using High Spatial Resolution Imagery.” Remote Sensing of Environment 115 (5): 1145–1161. doi:10.1016/j.rse.2010.12.017.
- Ni, L. 2011. “Object and Rule Based Approach for Classification of High Spatial Resolution Data over Urban Areas.” In Remote Sensing of the Environment: The 17th China Conference on Remote Sensing, edited by Q. Tong, X. Gu, and B. Zhu, 82030V. Bellingham, WA: SPIE.
- Nixon, M., and A. S. Aguado. 2008. Feature Extraction and Image Processing. Oxford: Elsevier.
- Oller, A. 2012. “Automatic Mapping of Off-road Vehicle Trails and Paths Using Images at Fort Riley Installation, Kansas.” MS Thesis, Southern Illinois University Carbondale.
- Opitz, D., and S. Blundell. 2008. “Object Recognition and Image Segmentation: The Feature Analyst Approach.” In Object Based Image Analysis, edited by T. Blaschke, S. Lang, and G. J. Hay, 153–168. Berlin: Springer-Verlag.
- Overwatch Systems. 2004. Using Feature AnalystTM for Land Cover and Land Use Mapping. A Visual Learning Systems, Inc. White Paper. Missoula, MT: Overwatch Systems.
- Overwatch Systems. 2010a. Feature Analyst 5.0 for ArcGIS Reference Manual. Missoula, MT: Overwatch Systems.
- Overwatch Systems. 2010b. Feature Analyst 5.0 for ArcGIS Tutorial. Missoula, MT: Overwatch Systems.
- Pereira, L. O., C. C. Freitas, S. S. Anna, D. Lu, and E. F. Moran. 2013. “Optical and Radar Data Integration for Land Use and Land Cover Mapping in the Brazilian Amazon.” GIScience & Remote Sensing 50 (3): 301–321.
- Pu, R., S. Landry, and Q. Yu. 2011. “Object-Based Urban Detailed Land Cover Classification with High Spatial Resolution IKONOS Imagery.” International Journal of Remote Sensing 32 (12): 3285–3308. doi:10.1080/01431161003745657.
- Puissant, A., W. Zhang, and G. Skupinski. 2012. “Urban Morphology Analysis by High and Very High Spatial Resolution Remote Sensing.” Paper presented at the fourth international conference on Geographic Object-Based Image Analysis (GEOBIA), Rio de Janeiro, Brazil, May 7–9.
- Quackenbush, L. J. 2004. “A Review of Techniques for Extracting Linear Features from Imagery.” Photogrammetric Engineering and Remote Sensing 70 (12): 1383–1392. doi:10.14358/PERS.70.12.1383.
- Simler, S. 2011. “An Improved Road and Building Detector on VHR Images.” Paper presented at the 2011 IEEE International Geoscience and Remote Sensing Symposium (IGARSS), Vancouver, July 24–29.
- Stehman, S. V. 2009. “Sampling Designs for Accuracy Assessment of Land Cover.” International Journal of Remote Sensing 30 (20): 5243–5272. doi:10.1080/01431160903131000.
- Taubenböck, H., T. Esch, M. Wurm, A. Roth, and S. Dech. 2010. “Object-Based Feature Extraction Using High Spatial Resolution Satellite Data of Urban Areas.” Journal of Spatial Science 55 (1): 117–132. doi:10.1080/14498596.2010.487854.
- Tenenbaum, D. E., Y. Yang, and W. Zhou. 2011. “A Comparison of Object-Oriented Image Classification and Transect Sampling Methods for Obtaining Land Cover Information From Digital Orthophotography.” GIScience & Remote Sensing 48 (1): 112–129. doi:10.2747/1548-1603.48.1.112.
- Tsai, Y., D. Stow, and J. Weeks. 2011. “Comparison of Object-Based Image Analysis Approaches to Mapping New Buildings in Accra, Ghana Using Multi-Temporal QuickBird Satellite Imagery.” Remote Sensing 3 (12): 2707–2726. doi:10.3390/rs3122707.
- Vanderzanden, D., and M. Morrison. 2002. High Resolution Image Classification: A Forest Service Test of Visual Learning System’s Feature Analyst. Salt Lake City, UT: USDA Forest Service Remote Sensing Applications Center.
- Weih, R., and D. White. 2008. “Land-Use/Land-Cover Characterization Using an Object-Based Classifier for the Buffalo River Sub-Basin in North-Central Arkansas.” Journal of the Arkansas Academy of Science 62: 125–131.
- Wu, S., X. Qiu, E. L. Usery, and L. Wang. 2009. “Using Geometrical, Textural, and Contextual Information of Land Parcels for Classification of Detailed Urban Land Use.” Annals of the Association of American Geographers 99 (1): 76–98. doi:10.1080/00045600802459028.
- Yu, Q., P. Gong, N. Clinton, G. Biging, M. Kelly, and D. Schirokauer. 2006. “Object-Based Detailed Vegetation Classification with Airborne High Spatial Resolution Remote Sensing Imagery.” Photogrammetric Engineering and Remote Sensing 72 (7): 799–811. doi:10.14358/PERS.72.7.799.
- Yuan, F. 2008. “Land Cover Change and Environmental Impact Analysis in the Greater Mankato Area of Minnesota Using Remote Sensing and GIS Modelling.” International Journal of Remote Sensing 29 (4): 1169–1184. doi:10.1080/01431160701294703.
- Zhang, C., Z. Xie, and D. Selch. 2013. “Fusing Lidar and Digital Aerial Photography for Object-Based Forest Mapping in the Florida Everglades.” GIScience & Remote Sensing 50 (5): 562–573.
- Zhang, D., C. Zhang, R. Cromley, D. Travis, and D. Civco. 2012. “An Object-Based Method for Contrail Detection in AVHRR Satellite Images.” GIScience & Remote Sensing 49 (3): 412–427. doi:10.2747/1548-1603.49.3.412.