
Abstract
The growth as well as the internal structure of the recently emerged Talashil spit along the west coast of India was studied using multidate satellite images coupled with ground-penetrating radar (GPR) information. Decadal changes (2003–2013) in configuration, geomorphology and erosion and accretion pockets along the spit were traced and compared. A 170 m long subsurface profile across the spit from shoreline to river shore was generated using GPR. Historical satellite images from 1973 to 2013 illustrate a rapid transformation of a linear sand bar into a matured spit. The growth trend over the period 2003–2013 shows mainly accretion along the seashore and erosion along the river shore. Three dynamic hot spot locations were noticed where erosion and accretion were alternately dominating. The radar facies clearly distinguishes zones of fluvial, dune and inter-tidal dominance and substantiates the interpretation of the satellite images. This study indicates spit formation following build up and emergence of a submerged shoal due to fluvial sedimentation, after which an equilibrium between erosion and accumulation was reached. The data indicate that the growth of the spit has reached its mature stage and only lateral oscillation of the spit is likely in the future unless sizable disturbances caused by either tectonic or anthropogenic processes influence this region.
1. Introduction
Remote sensing of the environment provides multitemporal information on periodical changes in land cover and landform caused by the dynamic nature of the land-surface processes. This type of change-detection study through time-series images of a landform/land cover factually reveals its various evolutionary stages in the past years and subsequently provides better scope to predicate its future growth trend. In this context, the multitemporal satellite images and aerial photographs are being widely used for change-detection mapping to study seasonal dynamics of land surfaces in order to assess and understand land-surface processes (Reed Citation2006). Several studies have demonstrated the change-detection assessment in short term and multidecadal periods, particularly in coastal areas as related to shoreline changes (Sridhar, Elangovan, and Suresh Citation2009; El Asmar and Hereher Citation2010; Li and Damen Citation2010; Kawakubo et al. Citation2011; Liua et al. Citation2013), changes in island morphology (Kumar et al. Citation2007), environmental changes in coastal lagoons (Ahmed et al. Citation2009; Li et al. Citation2014), etc. Above all, the decadal-scale change detections in land surface enriches the knowledge to compute landscape metrics for better understanding of landscape indicators (Slonecker, Milheim, and Claggett Citation2010), dynamic land-use changes (Byrd, Kelly, and Dyke Citation2004) and historical evolution (Olsen, Washington-Allen, and Dale Citation2005; Robles and Luna Citation2011).
Among the many dynamic coastal landforms, the spit is one which generates much interest due to its rapid evolution and sensitive association with prevailing marine and fluvial processes. A spit can be described as a kind of barrier, forming a narrow and elongated sand body, attached to a land mass at one end and terminating in open water at the other. The formation of a spit in the coastal front involves dynamic processes coupled with accretion and erosion phenomena (Park and Wells Citation2007). Morphological changes are rapid and duly significant until its mature stage. One of the widely adopted methods to study spit growth dynamics/evolution is the change-detection techniques using multitemporal satellite/aerial data (Frihy et al. Citation1998; Kokot, Monti, and Codignotto Citation2005; Raghavan et al. Citation2001; Avinash, Deepika, and Jayappa Citation2013; Thomas et al. Citation2014; Mani Murali and Vethamony Citation2014), along with admiralty charts and historical maps (Frihy et al. Citation1998; Kumar, Narayana, and Jayappa Citation2010).
In many earlier studies, the morphological evolution of a spit has been a focal point of discussion. However, the internal structure of a spit reveals a comprehensive story about its evolution with respect to the paleogeological processes. In this context, subsurface studies using ground-penetrating radar (GPR) are also widely used to map buried information on spit evolution (Tercier, Knight, and Jol Citation2000; Shukla, Patidarand, and Bhatt Citation2008). The main aim of these studies on spit growth is to determine the incremental evolution of the spit in the past and to forecast the behaviour of the spit in years to come (Marks and Nelson Citation1979).
In the present study, a rapidly growing recently formed spit at Talashil coast, west coast of India, has been discussed based on the information obtained from historical satellite images coupled with subsurface evaluation through GPR surveys. The combination of these technologies provides a better insight into the holistic behaviour of the spit growth dynamics in the prevailing fluvial and coastal processes.
2. Study area and data
The Talashil spit is the extension of a 12.5 km long sand bar located in the Malvan coastal zone of the west coast of India. This interesting costal land parcel lies between the Gad River on the east and the Arabian Sea on the west (). A small coastal village is located on the southern extremity of the stabilised sand bar and from this distal point of the sand bar, the present spit has started developing (i.e. initial location of the spit). The length of the spit is measured from this point (). The length of the spit is ~1 km long (i.e. 0.987 m) trends N–S direction, and the width of the spit is about 550 m.
Figure 1. Location map of the Talashil spit, Malvan coast, west coast of India.
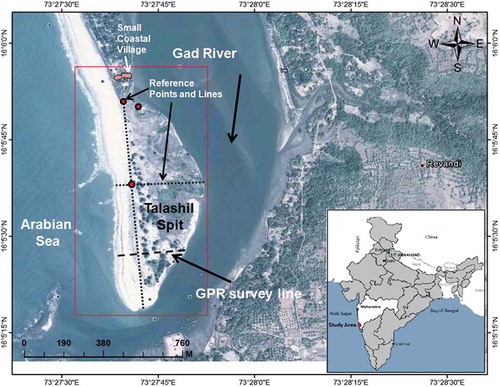
The spit represents a flat and low elevated sand dune zone with maximum height of up to 4 m from MSL. The coastline trends N–S with a moderately steep beach and low elevated backshore zone. The dunes are unstabilised, migratory in nature and with low vegetation cover. Riverside areas are dominantly fine textured clayey sand. The Gad River is the main sediment carrier, especially during the monsoon season. Due to the steep gradient of the hinterland, sediment contribution by erosion is appreciable to the river system. From the geomorphological setup, one can appreciate the influences of both the river and sea in nurturing the spits expansion. The tidal range in this area is between 0.12 and 1.0 m; the prominent wave direction is from SW, W and NW with a period ranging from 6 to 14 s. The long-shore directions are variable, but it is greater towards the south than in the north (Sanil Kumar et al. Citation2003).
3. Methodology
Multitemporal satellite images were used for monitoring the growth pattern of the Talashil spit since 1973. Especially, Landsat 5 image (MSS) of 1973, Landsat TM of 1989, Landsat 7 data (ETM) of 1999, Landsat TM of 2002 and IRS P6 (LISS III) image of 2006 were utilised for the present study. Besides, the satellite images of 2003, 2009, 2011, 2012 and 2013 were considered from Google Earth for the decadal growth trend observation. The incremental changes during the last 40 years in configuration and growth of the spit were deduced from 1973–2013 images. For decadal growth studies, the boundaries of the spit from satellite images (2003–2013) were traced, overlaid and compared. Also, major erosion and accretion areas were identified by comparison with the immediate dated satellite images. The boundaries of the spit configuration in various years were traced in Google Earth using the ‘add polygon’ function. Based on the reference points and lines (), each digitised boundary was correlated and the polygon details are saved as separate KML file. The surface area and the perimeter were calculated using KML toolbox (utility: shape) available in the ‘earth point’ website and the results are directed to an Excel file. The spread sheet provides details on the polygon such as digitised points, area, perimeter and mid-point coordinates. As far as the accuracy is concerned, the field measurements of the reference lines and on the map agree within a few metres difference (1–2 m). Along the middle portion of the spit, a subsurface profile (from seashore to river bank) was carried out using a GPR system with 200 MHz antenna. From this profile, buried sedimentary features up to 5 m depth were mapped. The GPR profile data were corrected with field parameters by fine-tuning the gain, dielectric constant, scans and filter settings. The time domain GPR data were digitally normalised with low-pass and high-pass filters to rectify high-frequency noises and flat-lying ringing system noises, respectively. Further, the data were subjected to de-convolution and migration processes to compress hyperbolas (diffractions). Surface and elevation normalisation were carried out for terrain corrections. The RADAN software (ver. 6.0) of GSSI (Geophysical Survey System Inc., Salem, NH, USA) was used to process the GPR data. Interpretation was carried out based on the reflectance from the profile. Beach profiles along the GPR transect were generated using an electronic Theodolite.
4. Results and discussion
4.1. Historical evolution (1973–2013)
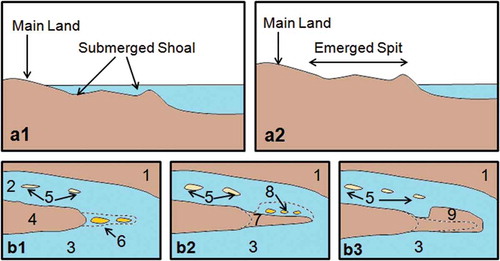
The spatial growth from 1973 to 2013 (40 years) shows a remarkable account on the evolution of the Talashil spit, probably from its initial stage of formation. The 1973 satellite imagery has been considered as the base data which is the earliest available image for this area. During 1973, the morphology of the spit was like a sand bar and there was no appearance of a spit configuration. The real spit morphology started developing after 1989 and partly developed in 1999. With reference to this information, 1973 was considered as the initial stage of formation. Satellite images of 1999 and 2006 exemplify the in-between growth trend and significant transformation from a sand bar to the spit (). Since the Landsat image acquired during 1973 was MSS (multispectral scanner) data and has a low resolution, it shows an ambiguous picture of the spit but the generalised dimension could be observed. Observation from these satellite images indicates that there was a narrow and linear sand bar in 1973, which emerged out from the surrounding submerged shoal and sand bar. The absence of stabilised vegetation indicates that the sand bar was freshly formed. This emergence of the submerged shoal was mainly due to continuous sedimentation of the Gad River. Since the drainage pattern of the Gad River is controlled by tectonic lineaments, the local tectonic activity also could have helped the submerged shoal to be uplifted. Also, it is observed that there were a number of river islands (in semi-submerged condition) existing around the sand bar. The 1989 satellite image also brings out the same information and indicates the extended growth of a linear sand bar. The available satellite image of 1999 (after 10 years) points out that some of the river islands joined with the sand bar and transformed the sand bar into an imprecise spit. At the same time, the wave action kept the sediment budget balanced and the spillover avoided. The satellite image of 2006 (after 7 years) shows an inclusive growth of the spit with typical geomorphic signatures of swampy land and low-lying areas. A period of 1973–1999 indicates a stage of emergence when the spit was joining with river islands. From 1999 to 2006, the spit growth was completed by dynamic processes indicating a stage of accretion. Within a span of 17 years (1989 to 2006), the sand bar had transformed into a fully developed spit. Based on the above inferences, a sketch model on the formation of the spit and its emergence is developed and is shown in . The emergence, influenced by heavy siltation, caused the submerged shallow shoals to form a part of a spit ( and ). Various stages of the growth of the spit as discussed above are presented in , and .
Figure 2. Historical evolution of the Talashil spit from 1973 to 2013. (a) Landsat MSS dated 26-01-1973; (b) Landsat TM 04-02-1989; (c) Landsat TM 14-11-1999; (d) Landsat TM 17-01-2002; (e) IRS P6 07-02-2006; and (f) Digital Globe image (Google Earth) 04-05-2013.
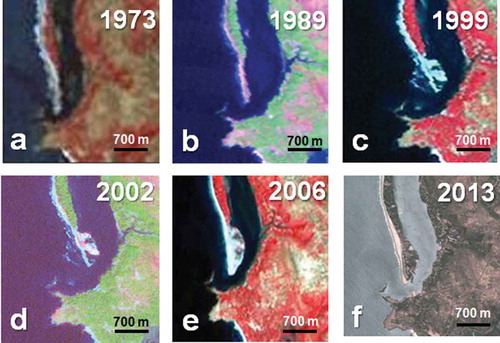
Figure 3. Conceptual sketch on the various stages of formation of Talashil spit; (a1) and (a2) emergence of submerged shoal; (b1) main land with submerged shoals, (b2) sand bar extension and (b3) spit growth. (1) Main land; (2) river; (3) sea; (4) sandbar; (5) river islands; (6) submerged shoals; (7) extended sandbar; (8) submerged river islands near to extended sandbar; and (9) grownup spit.
4.2. Decadal growth trend (2003–2013)
The decadal-scale change detection using time-series analysis was established by several earlier studies (Krasnozhon, Lahijani, and Voropayev Citation1999; Byrd, Kelly, and Dyke Citation2004; Reed Citation2006; Xian, Homer, and Aldridge Citation2012). Yu et al. (Citation2011) studied shoreline migration in west central Florida using Landsat images of 1987 to 2008 for coastal zone development studies. Jimenez and Sanchez (Citation1999) modelled barrier spit system using decadal-scale Landsat images and brought out the gradual spatial growth of the spit. Mani Murali and Vethamony (Citation2014) recorded the year-wise morphological dynamics of Ekakula spit of Odisha, India, during 1999 to 2009 decadal period using IRS LISS-III images and reported that the spit was growing by deposition of sediments brought from south through the littoral drift. As substantiated by the earlier studies, in the present study, multitemporal satellite images between 2003 and 2013 were utilised for evaluating morphological growth of the Talashil spit.
During the last 10 years, the growth trend has been significant in the Talashil spit. Satellite images from 2003 were analysed to trace the morphological changes, especially the configuration of the spit. to indicates considerable changes along the seaside and riverside shores. The outlines of the respective satellite images (a2 to e2) portray a different appearance of the spit configuration altogether in various years. No part of the spit remains stable. The incremental growth along the seashore was remarkable which was influenced by the redistribution of sediments by the waves.
Figure 4. Decadal growth of the spit from 2003 to 2013. (a1) satellite image of 2003; (b1) 2009; (c1) 2011; (d1) 2012; (e1) 2013; and (a2)–(e2) sketches of the spit boundary with respect to years.
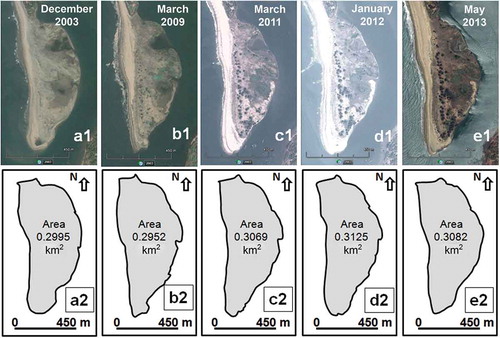
In addition to the above, the satellite images illustrate a notable changes in the distal (progradational frontal portion) part of the spit. Due to continuous accumulation of river sediments at the mouth of the river, the distal portion becomes an accretion point, thus taking a different shape at every time. During 2003, the distal part was rounded and it turned out to be a semi-round in shape in 2009. It attained a tapering feature in 2011 and lengthened towards the south, appeared as entirely a contrasting shape compared to 2003. But again it took a rounded appearance in 2012 and yet again elongated towards the south in 2013. These dynamic changes show the nature of cyclic accretion and erosion phases in the last decade. In spite of prominent changes in the configuration of the spit as observed from the satellite images, there has been little change in the surface area of the spit. It clearly indicates counter-cyclic accretion and erosion dynamics in various parts of the spit. In 2003, the area of the spit was nearly 0.3000 km2 and was marginally reduced in 2009 when compared to 2003. During 2011 and 2012 the area has marginally increased () and indicates a limited accretion of sediments at the northern part of the seashore and southern part of the river shore. The similar status is noticed in the perimeter of the spit as well ().
Table 1. Area and perimeter of the spit in various years from 2003 to 2013.
4.3. Geomorphological evolution and eco-restoration
In consonance with the rapid growth of the Talashil spit, the multitemporal satellite images portray new geomorphic features in the spit. Based on the observations from the multitemporal satellite images, the development of the spit started as a shallow submerged sand bar due to the continuous accumulation of the river sediments. As sediment influx was increasing from the river source, especially during monsoons, more sediments were deposited on the sand bar, causing expansion in all directions. Also, the nearby partially submerged river islands merged with the sand bar due to siltation processes, resulting in spit formation. During the lateral expansion of the spit, as indicated by the satellite images, various new geomorphological features () came into existences which are discussed below.
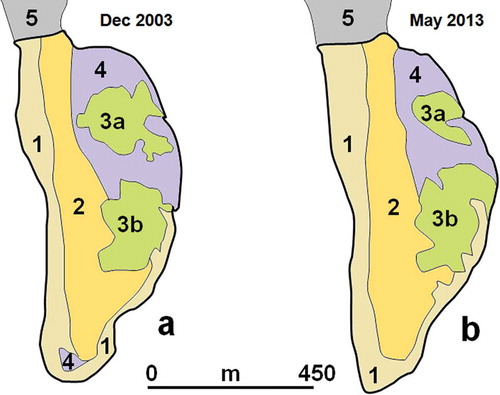
Figure 5. Changes in geomorphic features in 2003 and 2013. (1) Sea shore; (2) dune area; (3a and b) swampy micro-enclosures; (4) lowland; and (5) main land.
4.3.1. Beach
As viewed from various satellite images, the beach width of the spit is continuously expanding due to addition of sediment and its redistribution ( and ). Compared to the 2003 situation, the beach became broader in its northern part in 2009 (nearly 50–60 m) and gradually widened in the south in recent years to nearly 100–120 m ( and ). The beach and the foreshore areas have steep gradients. Berm areas are sharp and elevated in nature. But the satellite image of 2013 showed an appreciable erosion on the beach in the middle part of the spit (). This may be due to wave refraction caused by nearby near-shore submerged rocks. Various dated satellite images depict changes in the shoreline from 2003 to 2013 signifying the regression and transgression of the shore in the last decade ( to ). The beach area is dominated by heavy mineral sedimentation. A previous field study via auger sampling in the beach zone indicates the presence of thick heavy minerals layers in the foreshore areas (Gujar et al. Citation2010). The accumulation of heavy mineral-rich sediments is argued to be due to contribution of sediments from the river Gad (Gujar et al. Citation2011).
4.3.2. Sand dunes
Most of the sand dunes observed in the backshore areas (east) are low-elevated (4–5 m height) and are being colonised by native shrubs and grassy plants. The satellite image of 2003 showed limited vegetation on newly formed sand dunes. But in recent years the local villages have planted acacia as a wind break. This has aided sand dune stabilisation in the wind-dominated environment. Especially, in 2011, significant presence of vegetation (bushes and shrubs) was observed on the sand dunes and this vegetation flourished in the following years (). Due to vegetative stabilisation, the migration of sand dunes was prevented and the airborne sand particles, if any, are directed towards the south where the growth of the spit is still active.
4.3.3. Swampy micro-enclosures
There are two prominent swampy enclosures seen in the river side of the spit (; and ). These swampy areas were built in a calm fluvial environment. In fact, while a few shallow submerged river islands merged together, the lower parts in between these islands become swampy. Finer sediments were entrapped inside these enclosures and encouraged the growth of mangrove plants. Since many mangrove pockets are observed all along the river course in the upper stream zone, the mangrove seeds are being transported to the lower part of the river system and easily enter the micro-enclosures in the spit area. Due to heavy siltation during the rainy season, these enclosures are progressively filled with finer particles which partially block the link with the river. This situation has led to the formation of swampy areas and subsequent nourishment of mangrove growth in the last few decades. When comparing the 2003 situation with 2013, activity significant difference was observed in the spatial extent of these two swampy areas. The upper swampy area (3a) has reduced to half its 2003 extent in 2013, indicating more siltation in this part of the river. Whereas the lower swampy area (3b) has enlarged to nearly double its former size by 2013 signifying less sedimentation and increase erosion. It is also observed that the low land (; ) around these swampy areas has marginally reduced in aerial spread due to (i) erosion along the river shore and (ii) widening of sand dunes.
4.3.4. Active distal front
In recent years, the distal part (progradational front of the spit) of the spit has accreted sediment, leading to significant widening. This trend of growth shows that the spit is set to grow rapidly. But there has been an alternative activity of erosion, redistribution and accretion of sediments around the distal front zone. During the last decade (2003–2013), there was an intensive activity of land building influenced by accretion. The rounded shape of the distal area in 2003 was transformed into tapering and semi-rounded shapes in the following years. Being a point of sediment accumulation, this distal zone is more dominated by the accretion environment than other parts and coupled with the redistribution as well as dispersion activities. During the entire period of spit formation, the seashore maintains a straight configuration towards N–S which is predominately influenced by the wave action. But the riverside shore has always maintained a curved configuration. However, the riverside part of the distal front is dominantly formed from medium grain sands in contrast to the upper parts which are mainly composed of fine-grained soft sediment with clay fractions.
4.4. Erosion and accretion activities
The time-series satellite images illustrate the dynamics of the landforms in terms of accretion and erosion caused due to climatic and geomorphic processes. Krasnozhon, Lahijani, and Voropayev (Citation1999) studied the evolution of the Sefidrud River delta (Caspian Sea) using remote-sensing data (1950–1990) and brought out the sediment deposition on land dynamics. Blanchard, Rogan, and Woodcock (Citation2010) used ASTER and SRTM DEM to detect and quantify geomorphic changes on known altered drumlin features in terms of erosion and deposition in central Massachusetts, USA. Kumar, Narayana, and Jayappa (Citation2010) studied the accretion and erosion dynamics of various spits along Karnataka coast, India, using remote sensing and statistical approach. Still more several studies demonstrated the use of remote-sensing data to map and quantify accretion and erosion dynamics on various coastal landforms.
In the present study, the nature of erosion and accretion dynamics around the Talashil spit configuration has been remarkable in various years. This could be conveniently discussed here in two categories, viz. (i) along the seashore and (ii) along the river bank. While comparing the satellite images of different years, the erosion and accretion areas were clearly recognisable ( and ) along the abovementioned two categories of shores of the spit. In the first category, the accretion activity has been dominating through the last 10 years. When comparing the status of the coastline in 2003 with its 2009 status (), the predominant accretion was observed in the middle part, but there was a marginal erosion in the southern part. But the situation was reversed when comparing the satellite images of 2009 with 2011 (). The accretion area became an erosion area in the northern part, and the erosion area was under accretion in the southern zone. There was a significant growth in the distal part of the spit during this period. Similarly, there was a similar situation, although much less well-defined, during 2012 (). Subsequently, the 2013 situation reverted to the 2003 situation (). It seems this reverse trend could be either due to (i) the refraction of waves due to near-shore rocks; (ii) or due to seasonal changes of littoral drift; (iii) or even due to dynamics of sediment redistribution along the seashore. To sum up, during 2003 to 2013, the erosion and accretion trend shows a cyclic activity. But cumulatively the accretion trend was dominant from 2003 to 2013 period () along the seashore. In contrast to the dominant accretion activity along the seashore, the river shore of the spit experienced a significant erosional activity (). The erosion was appreciably noticed in all three areas (upper, middle and lower parts) except during 2009–2011, where the erosion is insignificant in the upper and middle parts (). Again here, like along the seashore, a reverse trend has been observed, illustrating accretion area in the middle part. But in contrast, accretion nature was observed in 2013 along the lower part when compared to the 2012 situation (). There was another reverse in this period. During the 2012–2013 period, there was a marginal accretion in a few places and insignificant erosion in the lower part in 2013 (). But cumulatively, the erosion was a dominating activity along the river shore.
Figure 6. Erosion and accretion locations/zones with reference to different years. (a) Boundary layers of 2003–2009; (b) 2009–2011; (c) 2011–2012; (d) 2012–2013; and (e) 2003–2013.
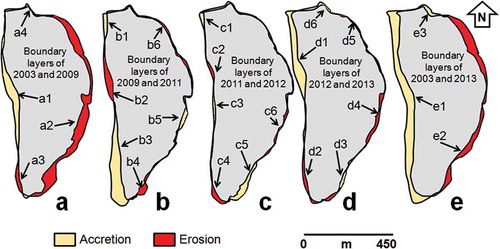
From , it is observed that the accretion was regular except for 2011–2012 where the accretion falls to nearly half. But in contrast, more erosion was observed during the 2003–2009 period. While considering total accretion and erosion activities, the accretion area (0.081 km2) was double the erosional area (0.045 km2). While comparing the overall magnitude of erosion and accretion from the 2003 to 2013 period, the accretion was the predominant activity since 2009 (). Since the accretion is prevailing in the recent years also, the expansion of the spit could be expected until the equilibrium is reached.
Table 2. Comparison of accretion and erosion from 2003 to 2013 period.
Table 3. Areas under erosion and accretion in the spit at various years (2003–2013).
The analysis also illustrates the dominating activity of erosion along the river shore. This indicates that the sediments carried by the river could not be deposited along the river banks but instead were transported to the sea. Also, it is noted that the micro-swampy enclosures received constant sediment input from the river. Thus, the river sediments were transported to the sinks rather than deposited along the riverside shore. In contrast, the seashore receives more sediment from the river and these sediments are dispersed and further redistributed along the shore. Almost the entire part of the spit in the coastal side expands by growth.
As observed from the above interpretation based on the multitemporal satellite images, the growth of the Talashil spit is being continuously nurtured by two major sediment sources, i.e. the longshore sediment transport and fluvial sediment supply. Though there was no specific study on the sediment influx assessment in the Gad River, the field observations during the monsoon season illustrate a scenario of sediment loaded influx in the Gad River and subsequent expansion of the river islands in the downstream areas. During the monsoon season, the terrestrial contribution of sediments in to the river system is considerable. Finally, most of the river sediments are discharged to the sea and are concurrently redistributed along the shoreline by the longshore drift. As far as the longshore sediment transport (LST) is concerned, there are many earlier studies conducted along central west coast of India. Sanil Kumar et al. (Citation2003) carried out a study on the measurements of LST to gauge the vertical as well as lateral distribution of sediments with traps. The measured average gross transport was reported as 726 m3/day. Another recent study on LST (Shanas and Sanil Kumar Citation2014) showed that the net LST was towards the south during the monsoon season with wave direction from west. During the non-monsoon season, the LST is reported to be towards the north with prominent wave direction between SWS and SW. Other earlier studies also substantiate these detailed field measurements and exhaustive observations (Sanil Kumar et al. Citation2003; Gujar et al. Citation2011). This phenomenon illustrates that the Gad River brings sediments during the monsoon season and deposits it in the mouth of the river and during the non-monsoon period, the longshore drift predominately acts to disperse the sediments along the coastal part. This observation substantiates the findings of this present study, i.e. overall accretion along the seashore and the marginal erosion along the river shore areas.
4.5. Influences of marine and fluvial activities
In view of erosion and accretion activities along the spit from 2003 to 2013, it is observed that the marine and fluvial activities have their signature dominant in their area of influence (). Based on the satellite data analysis, illustrates the various stages of erosion and accretion lines with respect to the study period. There are three locations where anomalies of reverse trend are found: (1) the middle part of the coastal spit, (2) the southern part of the river shore and (3) the northern part of the river shore. At location 1, the erosion and accretion activities were alternately recorded. But as a cumulative measure predominant accretion has been recorded in location 1. Location 2 is an active and dynamic zone. This location recorded accretion when sediment accumulated from the river source and erosion when sediments are eroded for dispersion. This point also has a predominant signature of accretion. Location 3, accretion is predominant in the northern part and erosion in the southern part. All these three locations are hotspots and need to be regularly monitored in future for dynamic activities related to erosion and accretion.
Figure 7. (a) Comparison of erosion and accretion (2003 to 2013); (b) locations of reverse dynamics around the spit.
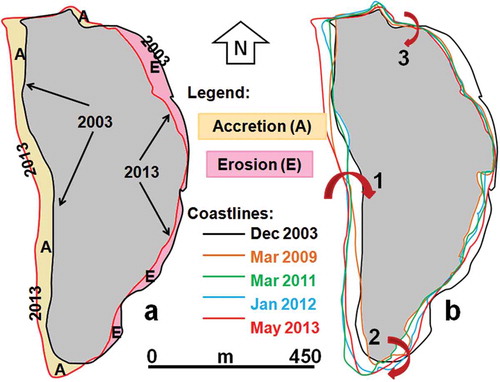
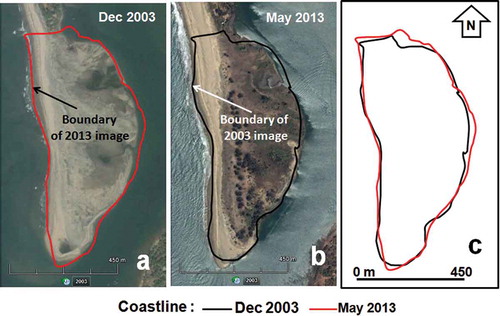
Despite remarkable accretion and erosion dynamics along the Talashil spit, it is surprising to note that there is no significant change in the spit configuration in the last ten years. When superimposed with lateral adjustment, the boundaries of the spit in 2003 and 2013 are almost matching each other (–). This inference indicates three facts: (i) there was a lateral oscillation of the spit (west–east); (ii) accretion and erosion were counter balanced and complemented each other and (iii) the spit reached its equilibrium and attained the mature stage.
Figure 8. Boundary comparison (2003–2013) of Talashil spit.
4.6. Subsurface GPR profile
The internal sedimentary architecture of a barrier spit in the Sylt coast, Germany, was studied using GPR by Lindhorst, Betzler, and Hass (Citation2008) and many horizontal as well as dipping bed sets were recognised. Clemmensen and Nielsen (Citation2010) identified multiple radar sedimentary facies from GPR survey in the coastal plain of Anholt, Denmark, and constructed internal architecture of the raised ridge system to understand the evolution of the shore. In this context, in order to recognise the various radar sedimentary facies and to correlate the growth of the spit with the internal arrangement of the sedimentary bed sets, a 170 m long GPR profile across the spit from seashore to river shore was carried out (). The time domain GPR profile has a penetration depth up to 5 m.
The internal structure of the spit reveals remarkable subsurface information. The time domain GPR profile () illustrates a number of different identifiable radar facies. Based on the reflection profiles, three significant subsurface zones (lateral) are observed: (i) fluvial-dominated zone, (ii) dune zone and (iii) inter-tidal coastal zone. Interestingly, in the profile of 170 m length, nearly half of the profile (about 75 m; from 0 to 75 m distance) indicates fluvial dominance, and another half (nearly 75 m; 95–170 m) denotes the coastal influence. In between these zones, the middle portion of about 20 m extent shows the transition zone (75–95 m) where mixed influences are observed.
Figure 9. Time domain GPR profile illustrating various subsurface features. (1a) Saturated bottom bed set layers; (1b) compact sand layers; (2) erosional surface; (3) cyclic erosion and accretion zone (unconsolidated upper sand layers); (4) paleo-levee; (5) discontinuity; (6) vertically titled sand layers; (7) dune zone – bottom sand layers; (8) dune zone – upper sand layers; and (9) inter-tidal zone (saturated).
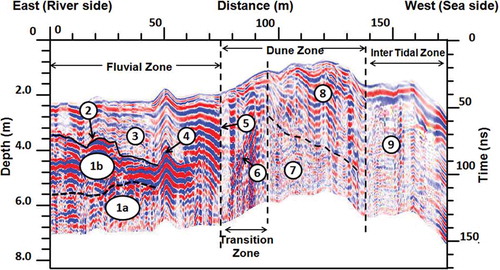
The fluvial influenced zone portrays three radar facies (vertically). The bottom bed set layers (1a) are water saturated as evidenced from lower amplitude reflections. The middle sand layers are compact and are represented by high reflections (1b). The upper sand layers are unconsolidated with low reflections (3). An erosional surface is observed about 1–2 m below the surface (2) between upper and middle radar facies. This might be a submerged shoal surface over which recent fluvial sediments (3) were deposited. Since the upper sand layers (3) have poor reflections, those sediments seem to have deposited either under shallow submerged conditions or this zone could have undergone cyclic accretion and erosion in different years. The latter could be possible here, which is also supported by the historical satellite images and especially images of the last decade. A paleo-levee (4) is observed at 2.0 m depth.
The transition zone shows a high order of disturbances in sediment-layering sequences and the sand layers are vertically titled rarely (6). This behaviour is possible in the mixed influence zone of fluvial and coastal environments. The transitional zone is marked with a prominent vertical discontinuity (5) and vertically overturned layers (6). The radar facies in the dune zone (8 and 9) signifies undulating sand layers. The saturated (7) and semi-saturated (8) layers are observed with a typical wavy pattern. The upper part of the dune zone has dry sand cover which is easily recognisable by its stronger amplitude/reflection. The bottom-part sand layers are not readily visible due to the unorganised nature of the sand layers. The recent but migratory sediments are seen at the surface. The dune zone has layers dipping towards the sea side indicating marine origin. The inter-tidal zone is characterised by weaker amplitude which seems to be influenced by seawater saturation. The low reflection/low amplitude indicates marine-influenced sediments.
From the above interpretation, the internal structure of the radar facies clearly depicts the influences of the fluvial and coastal processes in building up the spit. It seems both the processes work together to build the spit in a coherent manner. The interaction of the fluvial and coastal processes was remarkably exhibited in the transition zone and the joint dynamic operations were vividly depicted by the sedimentological characteristics of the overthrown and rarely titled sand layers. The subsurface information as inferred duly substantiates the evidence deduced from the satellite images on the spit growth. The submerged shoals accreted due to river sediment supply and started growing in a sediment-rich environment. When the equilibrium is reached, the shoal attains a stage of emergence. In this situation, the sediments from the sea front also support partially the expansion of the spit. The GPR profile indicates at least 2 m thickness of gradual accumulation of sediments to achieve the present-day configuration of the spit over the erosional surface which was once in the submerged condition.
4.7. Anticipated possible growth trend
The main purpose of the change detection studies through multitemporal images is to monitor the dynamics involved (Blanchard, Rogan, and Woodcock Citation2010; Kawakubo et al. Citation2011; Yang, Kim, and Madden Citation2012), to identify the optimum threshold (Im and Hodgson Citation2009) and to predict the possible future impact on the environment (Sridhar, Elangovan, and Suresh Citation2009; Maiti and Bhattacharya Citation2011; Yu et al. Citation2011). In the present study area of Talashil spit, the multitemporal images illustrate morphodynamic variations along the spit in terms of growth by sedimentation and loss of land by erosion. It is observed that the area undergoing accretion in the coastal side and erosion in riverside has almost similar width. If the boundaries of 2003 and 2013 are overlaid on each other and adjusted laterally, it is found that more or less that the configuration matches (). In other words, it can be argued that the configuration of the shoreline of the spit is nearly unchanged but with lateral displacement. This clearly indicates the oscillation of the spit from west to east during 2003 to 2013. During this oscillatory lateral movement, the erosion and the accretion complemented each other. It also illustrates that the spit seems to have attained a mature stage and acts well balanced with coastal and fluvial dynamics. It is anticipated that the shape and growth of the spit would be balanced with little increments in either erosion or accretion with additional sediments. It may not widen the coastal part with the more river sediments as the sediments would be processed by the near shore processes and will be redistributed. With the given condition, it could be anticipated that again the cycle would repeat itself through similar erosion and accretion conditions along the shores of the spit. If anything happens other than the cyclic repetition, then that should have been influenced by the other external factors such as local tectonics or by anthropogenic activities like construction of engineering structures, etc.
5. Conclusion
Analysis of satellite images from 1973 to 2013 shows that the linear sand bar has transformed into a matured spit. This sand bar once submerged has emerged due to heavy sedimentation from the Gad River and attained its present status. Evaluation of the growth in the recent decade (2003–2013) indicates predominant accretion along the seashore and erosion along the river shore. But overall the configuration remains mostly the same, except lateral oscillation, which indicates the maturity status of the spit. The GPR subsurface information substantiates the above observations of erosion along the river shore and mixed dynamics of fluvial and coastal processes in raising this spit. Based on these spatial and subsurface observations, it is anticipated that the spit's configuration may not change significantly in the future, but lateral oscillation could be possible until any other additional disturbances either from tectonic or anthropogenic influences occur in the future.
Funding
We acknowledge the grant received from INCOIS, Ministry of Earth Sciences, Government of India, New Delhi, to carry out this work under paleo-tsunami project (GAP/006/MT/MES/2007), the Council of Scientific & Industrial Research (CSIR), New Delhi, for financial support to procure the GPR system under network project (CMM23), and fellowship grant (for RK) received under CSIR-CIMFR in-house project (MLP-024/2013). Supports received from our staff during the field work and laboratory analysis are gratefully acknowledged.
Acknowledgement
We are grateful to Professor Andrew Cundy, Brighton University, United Kingdom, for his support to edit the manuscript.
References
- Ahmed, M. H., B. M. El Leithy, J. R. Thompson, R. J. Flower, M. Ramdani, F. Ayache, and S. M. Hassan. 2009. “Application of Remote Sensing to Site Characterization and Environmental Change Analysis of North African Coastal Lagoons.” Hydrobiologia 622: 147–171. doi:10.1007/s10750-008-9682-8.
- Avinash, K., B. Deepika, and K. S. Jayappa. 2013. “Evolution of Spit Morphology: A Case Study Using a Remote Sensing and Statistical Based Approach.” Journal of Coastal Conservation 17: 327–337. doi:10.1007/s11852-013-0259-y.
- Blanchard, S. D., J. Rogan, and D. W. Woodcock. 2010. “Geomorphic Change Analysis Using ASTER and SRTM Digital Elevation Models in Central Massachusetts, USA.” GIScience & Remote Sensing 47 (1): 1–24. doi:10.2747/1548-1603.47.1.1.
- Byrd, K. B., N. M. Kelly, and E. Dyke. 2004. “Decadal Changes in a Pacific Estuary: A Multi-Source Remote Sensing Approach for Historical Ecology.” GIScience & Remote Sensing 41 (4): 347–370. doi:10.2747/1548-1603.41.4.347.
- Clemmensen, L. B., and L. Nielsen. 2010. “Internal Architecture of a Raised Beach Ridge System (Anholt, Denmark) Resolved by Ground-Penetrating Radar Investigations.” Sedimentary Geology 223: 281–290. doi:10.1016/j.sedgeo.2009.11.014.
- El Asmar, H. M., and M. E. Hereher. 2010. “Change Detection of the Coastal Zone East of the Nile Delta Using Remote Sensing.” Environmental Earth Science. doi:10.1007/s12665-010-0564-9.
- Frihy, O. E., K. M. Dewidar, S. M. Nasr, and M. M. El Raey. 1998. “Change Detection of the Northeastern Nile Delta of Egypt: Shoreline Changes, Spit Evolution, Margin Changes of Manzala Lagoon and Its Islands.” International Journal of Remote Sensing 19 (10): 1901–1912. doi:10.1080/014311698215054.
- Gujar, A. R., N. V. Ambre, S. D. Iyer, P. G. Mislankar, and V. J. Loveson. 2010. “Placer Chromite along South Maharashtra, Central West Coast of India.” Current Science 99 (4): 492–499.
- Gujar, A. R., P. Ganesan, S. D. Iyer, S. S. Gaonkar, N. V. Ambre, V. J. Loveson, and P. G. Mislankar. 2011. “Influence of Morpho-Dynamic Variability over Seasonal Beach Sediments and Its Probable Effect on Coastal Development.” Ocean & Coastal Management 54: 514–523. doi:10.1016/j.ocecoaman.2011.03.007.
- Im, J., and M. E. Hodgson. 2009. “Characteristics of Search Spaces for Identifying Optimum Thresholds in Change Detection Studies.” GIScience & Remote Sensing 46 (3): 249–272. doi:10.2747/1548-1603.46.3.249.
- Jimenez, J. A., and A. Sanchez. 1999. “Modelling of Barrier Spit System Evolution at Decadal Scale.” Coastal Sediments 99 (1–3): 1724–1738.
- Kawakubo, F. S., R. G. Morato, R. S. Nader, and A. Luchiari. 2011. “Mapping Changes in Coastline Geomorphic Features Using Landsat TM and ETM+ Imagery: Examples in South Eastern Brazil.” International Journal of Remote Sensing 32 (9): 2547–2562. doi:10.1080/01431161003698419.
- Kokot, R. R., A. A. J. Monti, and J. O. Codignotto. 2005. “Morphology and Short-Term Changes of the Caleta Valdés Barrier Spit, Argentina.” Journal of Coastal Research 21 (5): 1021–1030. doi:10.2112/03-703A.1.
- Krasnozhon, G. F., H. Lahijani, and G. V. Voropayev. 1999. “Evolution of the Delta of the Sefidrud River, Iranian Caspian Sea Coast from Space Imagery.” Mapping Sciences and Remote Sensing 36 (4): 256–264. doi:10.1080/07493878.1999.10642127.
- Kumar, A., A. C. Narayana, and K. S. Jayappa. 2010. “Shoreline Changes and Morphology of Spits along Southern Karnataka, West Coast of India: A Remote Sensing and Statistics-Based Approach.” Geomorphology 120 (3–4): 133–152. doi:10.1016/j.geomorph.2010.02.023.
- Kumar, P. K. D., G. Gopinath, C. M. Laluraj, P. Seralathan, and D. Mitra. 2007. “Change Detection Studies of Sagar Island, India, Using Indian Remote Sensing Satellite 1C Linear Imaging Self-Scan Sen-Sor III Data.” Journal of Coastal Research 23: 1498–1502. doi:10.2112/05-0599.1.
- Li, X., and M. C. J. Damen. 2010. “Coastline Change Detection with Satellite Remote Sensing for Environmental Management of the Pearl River Estuary, China.” Journal of Marine Systems 82: S54–S61. doi:10.1016/j.jmarsys.2010.02.005.
- Li, X., Y. Zhou, L. Zhang, and R. Kuang. 2014. “Shoreline Change of Chongming Dongtan and Response to River Sediment Load: A Remote Sensing Assessment.” Journal of Hydrology 511: 432–442. doi:10.1016/j.jhydrol.2014.02.013.
- Lindhorst, S., C. Betzler, and H. C. Hass. 2008. “The Sedimentary Architecture of a Holocene Barrier Spit (Sylt, German Bight): Swash-Bar Accretion and Storm Erosion.” Sedimentary Geology 206: 1–16. doi:10.1016/j.sedgeo.2008.02.008.
- Liua, Y., H. Huanga, Z. Qiub, and J. Fan. 2013. “Detecting Coastline Change from Satellite Images Based on Beach Slope Estimation in a Tidal Flat.” International Journal of Applied Earth Observation and Geoinformation 23: 165–176. doi:10.1016/j.jag.2012.12.005.
- Maiti, S., and A. K. Bhattacharya. 2011. “A Three-Unit-Based Approach in Coastal-Change Studies Using Landsat Images.” International Journal of Remote Sensing 32: 209–229. doi:10.1080/01431160903439965.
- Mani Murali, R., and P. Vethamony. 2014. “Morpho-Dynamic Evolution of Ekakula Spit of Odisha Coast, India Using Satellite Data.” Indian Journal of Marine Sciences 43 (7). Accessed October 16, 2014. http://www.niscair.res.in/jinfo/IJMS/IJMS-Forthcoming-Articles/IJMS-PR-July%202014/MS%206%20Edited.pdf
- Marks, G. P., and C. S. Nelson. 1979. “Sedimentology and Evolution of Omaro Spit, Coromandel Peninsula.” New Zealand Journal of Marine and Freshwater Research 13 (3): 347–371. doi:10.1080/00288330.1979.9515811.
- Olsen, L. M., R. A. Washington-Allen, and V. H. Dale. 2005. “Time-Series Analysis of Land Cover Using Landscape Metrics.” GIScience & Remote Sensing 42 (3): 200–223. doi:10.2747/1548-1603.42.3.200.
- Park, J.-Y., and J. T. Wells. 2007. “Spit Growth and Downdrift Erosion: Results of Longshore Transport Modeling and Morphologic Analysis at the Cape Lookout Cuspate Foreland.” Journal of Coastal Research 23 (3): 553–568. doi:10.2112/03-0116.1.
- Raghavan, B. R., B. T. Vinod, K. A. Dimple, H. Prabhu, V. Udayashankar, H. N. Murthy, and T. R. Sreedhara. 2001. “Evaluation of the Nethravathi Spit Complex, West Coast of India: Integrated Change Detection Study Using Topographic and Remotely Sensed Data.” Indian Journal of Marine Sciences 30: 268–270.
- Reed, B. C. 2006. “Trend Analysis of Time-Series Phenology of North America Derived from Satellite Data.” GIScience & Remote Sensing 43 (1): 24–38. doi:10.2747/1548-1603.43.1.24.
- Robles, C. A. B., and A. R. Luna. 2011. “Integrating Remote Sensing Techniques, Geographical Information Systems (GIS), and Stochastic Models for Monitoring Land Use and Land Cover (LULC) Changes in the Northern Coastal Region of Nayarit, Mexico.” GIScience & Remote Sensing 48 (2): 245–263. doi:10.2747/1548-1603.48.2.245.
- Sanil Kumar, V., N. M. Anand, P. Chandramohan, and G. N. Naik. 2003. “Longshore Sediment Transport Rate Measurement and Estimation, Central West Coast of India.” Coastal Engineering 48 (2): 95–109. doi:10.1016/S0378-3839(02)00172-2.
- Shanas, P. R., and V. Sanil Kumar. 2014. “Coastal Processes and Longshore Sediment Transport along Kundapura Coast, Central West Coast of India.” Geomorphology 214: 436–451. doi:10.1016/j.geomorph.2014.02.027.
- Shukla, S. B., A. K. Patidarand, and N. Bhatt. 2008. “Application of GPR in the Study of Shallow Subsurface Sedimentary Architecture of Modwa Spit, Gulf of Kachchh.” Journal of Earth System Science 117 (1): 33–40. doi:10.1007/s12040-008-0010-5.
- Slonecker, T., L. Milheim, and P. Claggett. 2010. “Landscape Indicators and Land Cover Change in the Mid-Atlantic Region of the United States, 1973-2001.” GIScience & Remote Sensing 47 (2): 163–186. doi:10.2747/1548-1603.47.2.163.
- Sridhar, R. S., S. K. Elangovan, and P. K. Suresh. 2009. “Long Term Shoreline Oscillation and Changes of Cauvery Delta Coastline Inferred from Satellite Imageries.” Journal of the Indian Society of Remote Sensing 37 (1): 79–88. doi:10.1007/s12524-009-0013-y.
- Tercier, P., R. Knight, and H. Jol. 2000. “A Comparison of the Correlation Structure in GPR Images of Deltaic and Barrier Spit Depositional Environments.” Geophysics 65: 1142–1153. doi:10.1190/1.1444807.
- Thomas, T., S. K. Lynch, M. R. Phillips, and A. T. Williams. 2014. “Long-Term Evolution of a Sand Spit, Physical Forcing and Links to Coastal Flooding.” Applied Geography 53: 187–201. doi:10.1016/j.apgeog.2014.06.020.
- Xian, G., C. G. Homer, and C. L. Aldridge. 2012. “Effects of Land Cover and Regional Climate Variations on Long-Term Spatiotemporal Changes in Sagebrush Ecosystems.” GIScience & Remote Sensing 49 (3): 378–396. doi:10.2747/1548-1603.49.3.378.
- Yang, B., M. Kim, and M. Madden. 2012. “Assessing Optimal Image Fusion Methods for Very High Spatial Resolution Satellite Images to Support Coastal Monitoring.” GIScience & Remote Sensing 49 (5): 687–710. doi:10.2747/1548-1603.49.5.687.
- Yu, K., C. Hu, F. E. Muller-Karger, D. Lu, and I. Soto. 2011. “Shoreline Changes in West-Central Florida between 1987 and 2008 from Landsat Observations.” International Journal of Remote Sensing 32 (23): 8299–8313. doi:10.1080/01431161.2010.535045.