
Abstract
We analysed spectral and textural attributes from the Advanced Land Imager (ALI)/EO-1 for land-cover mapping and inspected their correlation with biophysical parameters of primary and secondary forests from Eastern Amazon. An artificial neural network (ANN) technique selected the most relevant spectral/textural attributes, which were combined for classification of the ALI scene. From the ANN land-cover map, areas classified as primary forest (PF), initial (SS1), intermediate (SS2) and advanced (SS3) stages of secondary succession were studied. Biophysical parameters were determined from field inventory of 40 sample plots. Results showed an overall classification accuracy of 79% using reflectance and 89% using the combined data set. The combined data set included the reflectance of ALI bands 3–9 and the texture metrics mean (bands 3–4; 6–8) and dissimilarity (band 8). The reflectance of the near-infrared/shortwave infrared bands and their texture mean decreased from SS1 to SS3/PF. The gradient between primary and secondary forests controlled the correlations of reflectance with biophysical parameters. While the aboveground biomass, basal area, leaf area index, tree height and canopy cover increased from SS1 to SS3/PF, the reflectance decreased with the development of canopy structure and the resultant canopy shadows. The mean was the only texture metric correlated with biophysical parameters.
Introduction
In the Amazon and other tropical deforested regions, the continuous conversion from primary forests to agriculture and livestock farming and their later abandonment due to soil degradation and decline in productivity generate many secondary successions (Prates-Clark, Lucas, and Santos Citation2009). The tropical secondary succession replenishes the soil with water arising from deeper layers and helps to control the pH and soil fertility (Nepstad et al. Citation1994; Hoelscher Citation1997; Sommer, Denich, and Vlek Citation2000). As a result, the successional process is an important component of the monitoring activities and of the ecological biodiversity conservation and carbon cycle studies to mitigate climate changes (Chazdon et al. Citation2009; Shevliakova et al. Citation2009; Yang, Richardson, and Jain Citation2010).
In the Brazilian Amazon, a widely used criterion to differentiate secondary succession is the time/age of regeneration, which is generally divided into three classes: initial (SS1; <5 years), intermediate (SS2; 5–15 years) and advanced (SS3; >15 years) (Uhl, Buschbacher, and Serrao Citation1988; Vieira et al. Citation2003). Remote sensing can map these stages, but many factors affect the successional development and introduce spectral data variability. The differences in land-use histories prior to abandonment, the distance from primary forests and the availability of seed dispersers lead to variability in regeneration pathways. They influence the capability of forests to recover tree species diversity and biomass (Fearnside Citation2005; Prates-Clark, Lucas, and Santos Citation2009). Other factors such as the fragmentation of the primary forest habitats, cut-off, fire frequencies, soil fertility and water regime are also important (Moran et al. Citation2000; Cochrane and Laurance Citation2002; Lucas et al. Citation2002; Numata, Cochrane, and Galvão Citation2011). The discrimination using satellite images is also complicated by the spectral variability resultant from the different species composition, heterogeneous canopy structure and architecture, within-canopy shadows and shadows cast by emergent trees (Steininger Citation2000). Therefore, image classification of secondary succession in stages of vegetation development or age is not an easy task.
In order to improve classification accuracy with optical data, spectral and texture attributes have been tested in combined way to map secondary succession (Kimes et al. Citation1999; Asner, Bustamante, and Townsend Citation2003; Ota, Mizoue, and Yoshida Citation2011). They have been also used to estimate forest biophysical parameters (Lu and Batistella Citation2005; Kayitakire, Hamel, and Defourny Citation2006; Wijaya, Liesenberg, and Gloaguen Citation2010; Sarker and Nichol Citation2011; Gallardo-Cruz et al. Citation2012). Image texture reflects the heterogeneity present in canopy structure and is valuable for complex landscapes (Lu and Weng Citation2007). By using approaches like the Gray-Level Co-occurrence Matrices (GLCM), several texture metrics are calculated from the images. In spite of that, because of the small number of studies in tropical regions, it is still necessary to understand the real contribution of the texture metrics to differentiate stages of secondary succession and to establish their relationships with biophysical parameters. Furthermore, most of the Brazilian studies were performed with Landsat data and there is a need to consider other optical sensors into the analysis.
The Advanced Land Imager (ALI), one of three sensors on board the Earth Observing-1 (EO-1) platform, is a multispectral sensor built by NASA as technology test verification (New Millennium Program). It has many technological advances in the sensor components compared to the previous Landsat instruments (e.g. Enhanced Thematic Mapper plus (ETM+)/Landsat-7 and Thematic Mapper (TM)/Landsat-5). Operating in a pushbroom fashion at an orbit of 705 km since 2000, the ALI has nine multispectral bands designed to mimic six TM/ETM+ Landsat bands with greater signal-to-noise ratio. It also has three additional bands covering the 433–453, 845–890 and 1200–1300 nm spectral intervals (Lencioni et al. Citation2005). ALI acquires data on-demand with a swath width of 37 km, a temporal resolution of 16 days and a spatial resolution of 30 m in the multispectral mode. Although used for several other applications, the ALI/EO-1 has never been tested in studies of secondary succession in the Amazon region.
The present study aims to analyse ALI/EO-1 spectral reflectance and combined attributes (reflectance plus GLCM texture metrics) for mapping primary and secondary forests in the Brazilian Amazon and inspecting attribute correlations with biophysical parameters. An artificial neural network (ANN) technique is used to select the best subset of spectral (reflectance of the nine ALI bands) and textural (eight metrics per band) attributes and to combine them for classification purposes.
Methodology
Selection of the study area and fieldwork activities
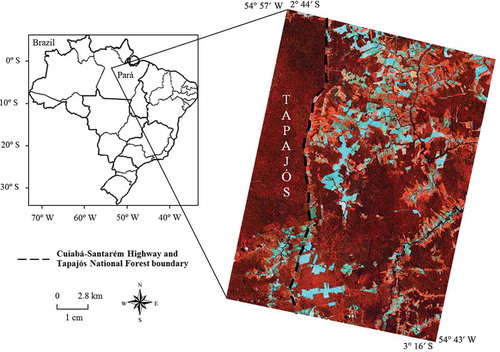
The study area is the Tapajós National Forest (TNF) and surrounding portions of the park (). The TNF is a conservation unit located in the Brazilian state of Pará, which has been extensively studied (e.g. Santos et al. Citation2003; Asner, Bustamante, and Townsend Citation2003; Aragão et al. Citation2005; Espírito-Santo et al. Citation2005; Pereira et al. Citation2013). The climate is classified as AmW by Köppen with average annual rainfall and temperature of 2272 mm and 26ºC, respectively. The rainy season occurs from December to May. The topography of the region varies from 80 to 200 m, and the predominant soil type is Latossolo Amarelo distrófico (Xanthic Acrustox in the USA Soil Taxonomy).
Figure 1. Location of the study area in the Brazilian state of Pará. The ALI/EO-1 bands 5 (775–805 nm), 8 (1550–1750 nm) and 4 (630–690 nm) in red, green and blue colours, respectively, were used in the false colour composite.
Within the limits of TNF, the native vegetation is classified as Dense Ombrophilous Forests with large trees and high abundance of woody lianas, palm trees and epiphytes (Gonçalves, Santos, and Treuhaft Citation2011). Outside the TNF, the surroundings present secondary succession areas that were abandoned after a productive period and/or crop rotation. These areas are currently in process of natural vegetation regrowth and are encountered in SS1, SS2 and SS3 stages (Prates-Clark, Lucas, and Santos Citation2009). However, most of the land covers are composed by pastures and a variety of crops including rice, soybean, bean and corn. A few agricultural fields of cassava, pepper, banana and coconut are also observed. Examples of land-use and land-cover studies in the Amazon were given by Maeda, Formaggio, and Shimabukuro (Citation2008), Lu et al. (Citation2011) and Li et al. (Citation2013).
A field survey was conducted in the middle of the dry season in August 2012, in the same period of image data acquisition. Besides visiting dozens of sites to collect ground truth information on the land-use and land-cover classes, we performed a floristic-structural survey over 40 sample plots of primary forest (PF) and secondary succession (SS). They had the following distribution: 12 plots of PF and 4 of SS3 both having 25 × 100 m, 11 plots of SS1 and 13 of SS2 of 20 × 50 m. We chose these plots from prior knowledge of the area and the observation of a time series of TM/Landsat-5 images from 1984 to 2010. Whenever possible, the age of each succession was determined by following its trajectory over time in the images. Several parameters were measured on each plot, including diameter at breast height (DBH) and tree height (H). The trees with DBH ≥10 cm were measured in PF and SS3, and those with DBH ≥5 cm in SS1 and SS2. A botanical identification was also performed with scientific and family names confirmed using the Brazilian Species Name Index 2013 (http://floradobrasil.jbrj.gov.br) and the Missouri Botanical Garden 2013 (http://www.tropicos.org).
The biophysical parameters of basal area and density were calculated per plot. An existing allometric equation adjusted for primary forests (Chave et al. Citation2005) estimated the aboveground biomass (AGB) (Equation (1)):
The construction of this model was based on inventories of tropical forests and measurements of DBH, H and relative density of trees (ρ). The ρ coefficient used here was a mean value of 0.69. For the secondary successions, the allometric equation by Uhl, Buschbacher, and Serrao (Citation1988) was adopted (Equation (2)):
In order to estimate the leaf area index (LAI) and percent canopy closure, six hemispherical photographs were taken (20 m intervals) on each plot using a Nikon digital camera with a fisheye 180º lens (Sigma EX DG 8 mm), as described by Galvão et al. (Citation2011).
Preprocessing of the ALI/EO-1 image and extraction of the textural attributes
The ALI/EO-1 acquired the image on 21 August 2012 with a pointing angle of 15°, solar elevation of 55º and solar azimuth of 64°. ALI acquires data in nine multispectral (MS) bands: band 1 (or MS-1p; 433–453 nm); 2 (MS-1; 450–515 nm); 3 (MS-2; 525–605 nm); 4 (MS-3; 633–690 nm); 5 (MS-4; 775–805 nm); 6 (4p; 845–890 nm); 7 (5p; 1200–1300 nm); 8 (MS-5; 1550–1750 nm); and 9 (MS-7; 2080–2350 nm). The ALI panchromatic band (480–690 nm) with 10 m spatial resolution was not used in data analysis. The pixel radiance values of these bands (L1 T processing level) were converted into surface reflectance using the Fast Line-of-Sight Atmospheric Analysis of Spectral Hypercubes (FLAASH) algorithm, which is based on the radiative transfer model MODTRAN4 (Exelis Visual Information Solutions Citation2013). The 2-Band (KT) method estimated the aerosols and visibility for atmospheric correction.
Eight metrics of GLCM texture attribute were extracted from the ALI/EO-1 surface reflectance bands (Haralick, Shanmugam, and Dinstein Citation1973): the mean, variance, contrast, dissimilarity, homogeneity, entropy, angular second moment (ASM) and correlation. Equations for each texture attribute can be found in Haralick, Shanmugam, and Dinstein (Citation1973) and Gallardo-Cruz et al. (Citation2012). The size of the moving window was determined after testing 3 × 3, 5 × 5 and 7 × 7 pixels. Due to the small size of several secondary succession plots and the mixture between adjacent pixels of the different classes, we selected 3 × 3 pixels. Asner, Bustamante, and Townsend (Citation2003) also used this window size in the Tapajós region because it presented better sensitivity to distinguish land-cover types in a Landsat scene. Furthermore, the dimension of 3 × 3 pixels matched the size of our sampling plots in the field, a criterion used by Gallardo-Cruz et al. (Citation2012). Therefore, we used a window of 3 × 3 pixels with displacement of 1 pixel and 64 grey levels to calculate 72 textural attributes (nine bands vs. eight metrics).
Data analysis
We selected nine classes to be mapped with ANN: water, crops, pasture, soil, non-photosynthetic vegetation (NPV), PF, SS1, SS2 and SS3. We chose ANN with its most applied method (multilayer perceptron (MLP)) (e.g. Wijaya, Liesenberg, and Gloaguen Citation2010). The mapping process was divided in five steps: sample preparation, training, evaluation, feature selection and simulation. In the sample preparation, 900 pixels (100 pixels vs. nine classes) were randomly selected over field-visited sites representative of each class using an automated procedure in ENVI 5.0 (Exelis Visual Information Solutions Citation2013). The spectral reflectance and eight textural metrics values were extracted for each pixel to create two input data sets (spectral and textural). The initial sample set of 900 pixels was allocated into three data sets: training (n = 450 pixels), validation (n = 225 pixels) and testing (n = 225 pixels). Training pixels promoted the learning of the input pattern, while validation pixels served to monitor the performance of the iterations and to stop the process and avoid overtraining. Finally, testing pixels represented an independent subset to evaluate the performance of the model.
The remaining steps in the classification process was carried out in MATLAB 2013a (Math Works Inc Citation2013) using the Neural Network Toolbox. The ANN with three layers (input, hidden, output) was trained by the back propagation-learning algorithm of Levenberg–Marquardt (Hagan and Menhaj Citation1994). The learning rate was 0.01, and there were two criterions to stop the training phase: root-mean-square (RMS) of 0.009 or 10 iterations without any improvement in performance. Several combinations of numbers of neurons on the hidden layer and random initial weights were iteratively tested.
In order to calculate the relative contribution of each spectral (reflectance of the nine bands) and textural (eight GLCM metrics) attribute in the classification, a feature selection approach based on ANN synaptic weights was applied upon the network. The performance was measured by the kappa index (Garson Citation1991). The selection of the best subset of attributes was based on Equation (3), which calculates the relative contribution (Qik) for each input (i) giving the ANN synaptic weights (w) between each input (i) and neuron (j) and between each neuron and output (k), where N and L represent the number of inputs and neurons:
The most relevant attributes on each data set were selected for classification purposes and for obtaining a few experimental combined data sets (spectral plus textural). The analysis of the overall classification accuracy, the kappa index and the z-test upon the kappa index determined the best-combined data set. In order to identify the data set (spectral or combined) that produced the most precise land-cover map and associated variations in classification accuracy from adding textural metrics into the reflectance data set, results from the two confusion matrices were compared to each other. To analyse the spectral and textural differences between the typologies (PF, SS1 to SS3), the best ANN land-cover map was then used to select 12 representative sample plots per typology spread over the study area. The mean and standard deviation values for each spectral band and texture metric were extracted from 100 sample pixels per typology randomly selected based on the plots.
Finally, we investigated the relationships between the spectral and textural attributes and the biophysical parameters of the 40 sample plots. Attribute values were extracted from pixels over the field-visited sample locations. Pearson’s correlation coefficients were obtained for the following biophysical parameters: basal area, AGB, LAI, percentage of canopy closure, average tree height and tree density. The r coefficient was compared between the spectral and textural attributes in order to identify the most correlated ones with the biophysical parameters. Because of the possibility of nonlinear relationships, we generated scatter plots and adjusted fit curves for the calculation of the coefficient of determination (R2).
Results and discussion
Floristic and structural characterization of vegetation
The analysis of the biophysical parameters and diversity data showed an increase in AGB, mean height, basal area, LAI, canopy closure, richness and diversity, and a decrease in density of individuals from SS1 to SS3 (). This pattern was expected due to the floristic-structural development from early to old regeneration process. Furthermore, factors such as soil nutrients and shade favour the recruitment of late successional species, which confers great increase of richness and AGB in advanced successional stages (Moran et al. Citation2000). However, even after 30 years of regeneration, associated with the history of land-use and local soil conditions, the AGB of SS3 (109.8 Mg/ha) was still much lower than that of PF (300.5 Mg/ha). It occurred due to the presence of climax individuals with huge DBH (up to 80 cm) in PF. SS3 presented greater species diversity (H′ = 4.36) than SS1 (H′ = 2.44) and SS2 (H′ = 3.90) and lower diversity than PF (H′ = 4.77). It also showed lower richness (125 sp.) than that observed for PF (214 sp.) as expected. Overall, structural and floristic results of were consistent with those obtained by other authors in the Tapajós region (e.g. Espírito-Santo et al. Citation2005; Narvaes Citation2010).
Table 1. Biophysical parameters and species diversity of primary forest (PF) and initial (SS1), intermediate (SS2) and advanced (SS3) stages of secondary succession.
The SS1 and SS2 typologies presented a large number of pioneer species of ecological succession (e.g. Cecropia palmata Willd. (Embaúba branca)). Species such as Inga alba (Sw.) Willd. (Ingá vermelho) and Guatteria schomburgkiana Mart. (Envira preta) predominated in SS3.
Primary forest and secondary succession mapping using ANN
Feature selection analysis and training of the ANN
For the spectral reflectance, the feature selection indicated that the ALI blue bands 1 and 2 had low contribution to the classification when compared to the other seven bands. The ANN was then trained with ALI bands 3 to 9 tested using a range from 18 to 28 hidden neurons and random initial weights. The best results were achieved with 27 neurons. The training stopped after 16 iterations with an RMSE value of 0.035.
For the textural data set, bands 1 and 2 were excluded prior to the analysis. The mean attribute presented the highest relative contribution, especially for bands 3 (525–605 nm), 4 (633–690 nm), 6 (845–890 nm) and 8 (1550–1750 nm) (). The bands 5 (775–805 nm) and 9 (2080–2350 nm) presented low relative contributions. This is probably due to the strong correlation of band 5 with band 6, both positioned in the near infrared (NIR), and of band 9 with band 8, both placed in the shortwave infrared (SWIR). The remaining textural metrics presented relatively low contributions when compared to the mean texture, with the exception of the dissimilarity of bands 7 (1200–1300 nm) and 8, and of the contrast of band 8. Both the contrast and dissimilarity express irregularities in forest canopy such as the differences in tree height and canopy shadows (Gallardo-Cruz et al. Citation2012). However, the performance of the texture metrics for classification is apparently dependent on the land-cover types under study. For example, textural homogeneity from Landsat data produced the greatest improvements in classification of a heterogeneous tropical area in Bolivia (Paneque-Gálvez et al. Citation2013).
Figure 2. Relative contribution of the eight texture metrics extracted from the ALI/EO-1 bands 3–9 for land-cover mapping using ANN.
The relative contribution thresholds of 2.0, 2.5, 3.0 and 5.0% were tested to promote the selection of texture metrics to compose an optimized combined data set with the reflectance data of the ALI bands 3 to 9. Lower thresholds represent the addition of more attributes (). The resultant kappa indices for each threshold were 0.855, 0.865, 0.875 and 0.835, respectively. The addition of the attribute mean of the bands 6 and 8 and of the dissimilarity of band 8 caused a statistically significant improvement in the kappa index (p = 0.012) from 0.835 (threshold of 5.0%) to 0.875 (threshold of 3.0%) ().
Table 2. Attribute selection of the candidate textural metrics to integrate the combined data set (reflectance plus texture) based on the thresholds of 2.0%, 2.5%, 3.0% and 5.0% of relative contribution, respectively.
The combined data set of best performance was then composed of the spectral reflectance of ALI bands 3 to 9 and of the texture metrics mean of bands 3, 4, 6, 7 and 8 and dissimilarity of band 8. The training phase tested a range from 12 to 22 hidden neurons and random initial weights. The best result was obtained from using 12 neurons in the hidden layer, a lesser complex and faster model. The training stopped at 19 iterations with an RMSE of 0.017.
Performance of the spectral and combined input data sets
Confusion matrices were generated using the test subsets for the spectral () and the combined () data sets. An overall accuracy improvement of 9.78% was obtained from the spectral (79.11%) to the combined (88.89%) data sets. Both kappa indices were statistically significant (p < 0.00) and the one from the combined data set was statistically higher than that obtained from the spectral data alone (p < 0.00). This means that both data sets were reliable, but that the combined one outperformed the spectral data set, thus, generating a land-cover map more consistent with the ground truth information ().
Table 3. Confusion matrix from the ANN classification of the spectral input data set (reflectance of the ALI bands 3–9), in % of classified pixels.
Table 4. Confusion matrix from the ANN classification of the combined data set (reflectance plus textural attributes), in % of classified pixels.
Figure 3. Land-cover map derived from the ANN applied to the combined input data set (reflectance plus texture metrics).
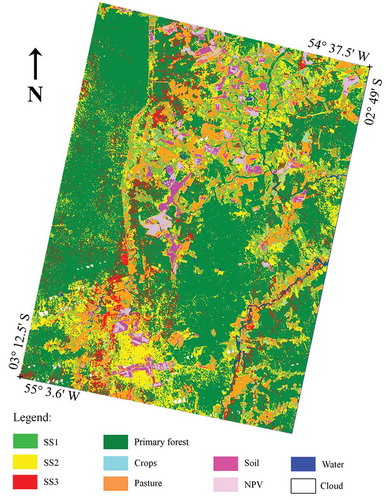
The combined data set improved the classification accuracy of PF (77–83%) because this typology was better discriminated from SS2. On the other hand, the confusion between PF and SS3 slightly increased. The cause of the confusion between PF and SS2/SS3 is probably due to small-scale human-induced events such as an old selective logging present in the south portion of the TNF. In the south portion, outside the TNF, some areas were also classified as SS2, although they were degraded PF areas. By using the combined dataset, when compared to the spectral reflectance data alone, the secondary successions presented significant increase in classification accuracy for SS1 (69% to 89%) and SS2 (35% to 63%), but there were no improvements for SS3 (62%). These results in SS1 and SS2 were related to a decrease in classification confusion between SS1/SS2 and crops, SS2 and PF, and SS1 and SS2. In relation to the other land-cover classes, the water class presented 100% of classification accuracy in both data sets. From the spectral to the combined data set, the classification accuracy improved for crop (68% to 83%) and NPV (57% to 82%) and got worse for pasture (100% to 89%). The best improvement was observed for soil (31% to 70%) due to its better discrimination from NPV, which confusion depends on factors such as the type and relative amounts of soil and NPV (Roberts, Smith, and Adams Citation1993).
The present results in the TNF region agreed with those obtained by Kimes et al. (Citation1999). They reported a gain in classification accuracy (83.5% to 89.9%) when adding texture metrics to spectral data derived from the high-resolution visible (HRV)/SPOT-1 (20 m spatial resolution) to map tropical primary and secondary forests in western Amazon. According to Ota, Mizoue, and Yoshida (Citation2011), the gain in classification accuracy of forest types from adding textural information is dependent on the spatial resolution of the sensors and increases for high spatial resolution (better than 20 m). According to them, there was no clear difference in accuracy between the combined data and spectral data alone at 30 m spatial resolution. By contrast, our 30 m spatial resolution results indicated a gain of 9.78% when using the combined spectral and textural ALI data. In extremely rugged terrains, which is not the case of the present study area, some authors have observed an improvement in land-cover mapping by integrating spectral and textural data with topographic information (e.g. Fan Citation2013). Lidar-derived topographic information and texture metrics have been also used to map forest communities (Zhang, Xie, and Selch Citation2013).
Spectral and textural variations in the primary forest and secondary successions
The reflectance of the ALI NIR band 6 decreased from SS1 to SS3, and toward the PF. The result for the ALI SWIR band 8 was similar to that of the NIR band with a slightly better differentiation between SS3 and PF (). These two ALI bands were those that best discriminated the secondary succession stages.
Figure 4. Average surface reflectance and standard deviation values of the ALI/EO-1 bands 6 (845–890 nm) and 8 (1550–1750 nm) for areas mapped with ANN representative of primary forest (PF) and the initial (SS1), intermediate (SS2) and advanced (SS3) stages of secondary succession.
The variation in the mean texture attribute of band 6 () followed the same pattern of the NIR reflectance between the typologies (). The secondary successions presented higher response in the beginning of its development (SS1), when the succession has low structural complexity and floristic diversity, high dominance of some pioneer species and, thus, a homogeneous canopy structure (Santos et al. Citation2003). The texture differences between the secondary successions and PF decreased over time with the development of vegetation structure (homogenous to heterogeneous forest canopy) and floristic diversity (appearance of individuals of late succession) (Silva Citation2014).
Figure 5. Variation in the ALI/EO-1 texture metrics mean (band 6 = 845–890 nm) and variance (band 8 = 1550–1750 nm) for areas mapped with ANN representative of primary forest (PF) and secondary successions (SS1 to SS3).
Besides the mean texture, the entropy increased from SS1 to PF, which can represent the increase of the disorder in vegetation canopy (). As expected, the ASM presented the opposite trend. Thus, both metrics expressed the increase in the vegetation canopy disorder and complexity of vegetation structure during the transition from SS1 to SS3/PF, when we have more canopy shadowing effects detected by the ALI. The remaining metrics did not present well-defined patterns across the vegetation types.
Table 5. Mean and standard deviation values for texture metrics of the ALI SWIR band 8 (1550–1750 nm) for primary forest (PF) and initial (SS1), intermediate (SS2) and advanced (SS3) secondary succession.
Relationship between the biophysical parameters of the primary forest and secondary successions with the spectral and textural attributes
The relationships between the biophysical parameters of the primary forest and secondary successions and the spectral/textural attributes were controlled by the differences in the development of canopy structure from SS1 to SS3/PF. As pointed out by Lu and Batistella (Citation2005), such relationships are different for primary forests and successional stages. For example, an increase in LAI in primary forests normally produces greater NIR reflectance values (radiation scattering by the canopy components) (Huete et al. Citation1992). Thus, positive correlations are expected between the NIR reflectance and LAI. However, when one considers primary and secondary forests together, this correlation becomes negative. In our study, biophysical parameters like AGB, basal area, mean height, LAI and canopy closure increased from SS1 to SS3/PF (), but the reflectance decreased for more well-structured canopies (SS3 and PF) due to canopy shadows. Except for the density of individuals, this gradient explains all the other negative correlations observed in . The density of individuals was greater for SS1 and SS2 when compared to SS3 and PF (), which was the cause of the positive correlations in for this biophysical parameter. The best correlations with biophysical attributes were generally observed for the reflectance of the ALI bands 3 (525–605 nm) and 8 (1550–1750 nm). Except for the mean texture, the correlations between textural attributes and biophysical parameters were not statistically significant.
Table 6. Pearson’s correlation coefficients for the relationships between the biophysical attributes and the reflectance of the multispectral ALI/EO-1 bands.
These negative correlations were consistent with those obtained by Lu and Batistella (Citation2005) when analysing the relationships of spectral/textural TM/Landsat-5 attributes with the AGB in tropical forests from Eastern Amazon. For the spectral data, the best correlations of AGB of secondary successions were observed for the spectral response of the TM bands 4 (r = −0.68) and 5 (r = −0.57), which corresponds approximately to the ALI bands 5 (775–805 nm) and 8 (1550–1750 nm). For the textural data, similarly to our study, the only statistically significant texture metric for AGB was the mean texture for all bands with r values of −0.54 (TM band 5) and −0.50 (TM band 4). Gallardo-Cruz et al. (Citation2012) also obtained negative correlations between Mexican tropical forest attributes and spectral/textural data when using high spatial resolution data, except for density of individuals, as also observed in our study. Similar results were reported by Wijaya, Liesenberg, and Gloaguen (Citation2010) using ETM+/Landsat-7 data for tropical forests from Indonesia.
Some biophysical parameters presented linear relationships with spectral/textural attributes, whereas others showed nonlinear associations. Examples are shown in and . The AGB decreased from PF to SS1, whereas the reflectance of the ALI band 8 increased nonlinearly towards the initial stage of secondary succession (). The same occurred for the relationship between the LAI and the mean texture metric of the ALI band 3, but the relationship was linear ().
Figure 6. Relationships between (a) the above ground biomass (AGB) and the surface reflectance of the ALI band 8 (1550–1750 nm); (b) the leaf area index (LAI) and the textural metric mean of band 3 (525–605 nm). Results refer to 40 sample plots of primary forest (PF) and secondary successions (SS1–SS3), indicated by symbols.
Conclusions
We investigated the ALI/EO-1 spectral and textural attributes for mapping primary and secondary forests in the TNF and surroundings and studying their correlations with biophysical parameters. Results showed that ANN applied for attribute selection and land-cover mapping using the combined data set improved the overall classification accuracy of the primary forests, secondary successions and the other land-cover classes. The use of the combined data set, which was composed by the spectral reflectance of the ALI bands 3 to 9, the GLCM mean of bands 3, 4, 6, 7 and 8 and the dissimilarity of band 8, resulted in a classification accuracy of 89% vs. 79% from the use solely of the reflectance data. There were improvements in classification accuracy for PF (77% to 83%), SS1 (69% to 89%) and SS2 (35% to 63%) with no changes for SS3 (62%).
The reflectance of the NIR and SWIR ALI bands 6 and 8 decreased from SS1 to SS3/PF. As expected, the texture attribute mean presented a similar trend. Negative correlations were observed for most of the relationships of the biophysical attributes with the spectral reflectance. This happened because of the gradient in the development of canopy structure between the typologies. More canopy shadows were observed in field towards the SS3/PF that presented the largest values in biophysical attributes such as AGB, LAI, basal area, tree height and canopy closure. The ALI bands 3 and 8 showed the strongest correlation coefficients. The only texture metric correlated with the biophysical attributes was the mean texture. Inspection of the scatterplots showed that the relationships of reflectance and GLCM texture metrics with biophysical attributes were not necessarily linear.
Future research should consider the efficiency of texture metrics extracted from high spatial resolution to capture variations in canopy structure of primary and secondary forests in the Amazon region. Further research is also needed to investigate the role played by local seasonal changes in solar elevation and their impact on canopy shadows and texture metrics.
Funding
CNPq (Conselho Nacional de Desenvolvimento Científico e Tecnológico) and CAPES (Coordenação de Aperfeiçoamento de Pessoal de Nível Superior).
Acknowledgements
The authors are grateful to (1) CAPES (Coordenação de Aperfeiçoamento de Pessoal de Nível Superior); (2) ICMBio (Instituto Chico Mendes de Conservação da Biodiversidade) for authorizing the research and access to the Tapajós National Forest; (3) MPEG (Museu Paraense Emílio Goeldi), especially to Luiz Batista Lobato, for the botanical identification; (4) LBA/Santarém (Large-Scale Biosphere Atmosphere Experiment in Amazonia) for the logistic support for the field campaign and (5) CNPq (Conselho Nacional de Desenvolvimento Científico e Tecnológico). Comments by two anonymous reviewers are highly appreciated.
References
- Aragão, L. E. O. C., Y. E. Shimabukuro, F. D. B. Espírito-Santo, and M. Williams. 2005. “Landscape Pattern and Spatial Variability of Leaf Area Index in Eastern Amazonia.” Forest Ecology and Management 211: 240–256. doi:10.1016/j.foreco.2005.02.062.
- Asner, G. P., M. M. C. Bustamante, and A. R. Townsend. 2003. “Scale Dependence of Biophysical Structure in Deforested Areas Bordering the Tapajós National Forest, Central Amazon.” Remote Sensing of Environment 87: 507–520. doi:10.1016/j.rse.2003.03.001.
- Chave, J., C. Andalo, S. Brown, M. A. Cairns, J. Q. Chambers, D. Eamus, H. Fölster, et al. 2005. “Tree Allometry and Improved Estimation of Carbon Stocks and Balance in Tropical Forests.” Oecologia 145: 87–99. doi:10.1007/s00442-005-0100-x.
- Chazdon, R. L., C. A. Peres, D. Dent, D. Sheil, A. E. Lugo, D. Lamb, N. E. Stork, and S. E. Miller. 2009. “The Potential for Species Conservation in Tropical Secondary Forests.” Conservation Biology 23: 1406–1417. doi:10.1111/j.1523-1739.2009.01338.x.
- Cochrane, M. A., and W. F. Laurance. 2002. “Fire as a Large-Scale Edge Effect in Amazonian Forests.” Journal of Tropical Ecology 18: 311–325. doi:10.1017/S0266467402002237.
- Espírito-Santo, F. D. B., Y. E. Shimabukuro, L. E. O. E. C. D. Aragão, and E. L. M. Machado. 2005. “Análise da composição florística e fitossociológica da floresta nacional do Tapajós com o apoio geográfico de imagens de satélites.” Acta Amazonica 35 (2): 155–173. doi:10.1590/S0044-59672005000200006.
- Exelis Visual Information Solutions. 2013. ENVI User Manual. Boulder, CO: Exelis Visual Information Solutions.
- Fan, H. 2013. “Land-Cover Mapping in the Nujiang Grand Canyon: Integrating Spectral, Textural, and Topographic Data in a Random Forest Classifier.” International Journal of Remote Sensing 34: 7545–7567. doi:10.1080/01431161.2013.820366.
- Fearnside, P. M. 2005. “Deforestation in Brazilian Amazonia: History, Rates, and Consequences.” Conservation Biology 19: 680–688. doi:10.1111/j.1523-1739.2005.00697.x.
- Gallardo-Cruz, J. A., J. A. Meave, E. J. González, E. E. Lebrija-Trejos, M. A. Romero-Romero, E. A. Pérez-García, R. Gallardo-Cruz, J. L. Hernández-Stefanoni, and C. Martorell. 2012. “Predicting Tropical Dry Forest Successional Attributes from Space: Is the Key Hidden in Image Texture?” PLoS ONE 7 (2): e30506–12. doi:10.1371/journal.pone.0030506.
- Galvão, L. S., J. R. Santos, D. A. Roberts, F. M. Breunig, M. Toomey, and Y. M. Moura. 2011. “On Intra-Annual EVI Variability in the Dry Season of Tropical Forest: A Case Study with MODIS and Hyperspectral Data.” Remote Sensing of Environment 115 (9): 2350–2359. doi:10.1016/j.rse.2011.04.035.
- Garson, G. D. 1991. “Interpreting Neural-Network Connection Weights.” AI Expert 6: 47–51.
- Gonçalves, F. G., J. R. Santos, and R. N. Treuhaft. 2011. “Stem Volume of Tropical Forests from Polarimetric Radar.” International Journal of Remote Sensing 32 (2): 503–522. doi:10.1080/01431160903475217.
- Hagan, M. T., and M. Menhaj. 1994. “Training Feed-Forward Networks with the Marquardt Algorithm.” IEEE Transactions on Neural Networks 5 (6): 989–993. doi:10.1109/72.329697.
- Haralick, R. M., K. Shanmugam, and I. Dinstein. 1973. “Textural Features for Image Classification.” IEEE Transactions on Systems, Man, and Cybernetics 3 (6): 610–621. doi:10.1109/TSMC.1973.4309314.
- Hoelscher, D. 1997. “Shifting Cultivation in Eastern Amazonia: A Case Study on the Water and Nutrient Balance.” Plant Research and Development 46: 68–87.
- Huete, A. R., G. Hua, J. Qi, A. Chehbouni, and W. J. D. van Leeuwen. 1992. “Normalization of Multidirectional Red and NIR Reflectances with the SAVI.” Remote Sensing of Environment 41: 143–154. doi:10.1016/0034-4257(92)90074-T.
- Kayitakire, F., C. Hamel, and P. Defourny. 2006. “Retrieving Forest Structure Variables Based on Image Texture Analysis and IKONOS-2 Imagery.” Remote Sensing of Environment 102: 390–401. doi:10.1016/j.rse.2006.02.022.
- Kimes, D. S., R. F. Nelson, W. A. Salas, and D. L. Skole. 1999. “Mapping Secondary Tropical Forest and Forest Age from SPOT HRV Data.” International Journal of Remote Sensing 20 (18): 3625–3640. doi:10.1080/014311699211246.
- Lencioni, D. E., D. R. Hearn, C. J. Digenis, J. A. Mendenhall, and W. E. Bicknell. 2005. “The EO-1 Advanced Land Imager: An Overview.” Lincoln Laboratory Journal 15 (2): 165–180.
- Li, G., D. Lu, E. Moran, and S. Hetrick. 2013. “Mapping Impervious Surface Area in the Brazilian Amazon Using Landsat Imagery.” GIScience and Remote Sensing 50: 172–183.
- Lu, D., and M. Batistella. 2005. “Exploring TM Image Texture and its Relationships with Biomass Estimation in Rondônia, Brazilian Amazon.” Acta Amazonica 35 (2): 249–257. doi:10.1590/S0044-59672005000200015.
- Lu, D., G. Li, E. Moran, L. Dutra, and M. Batistella. 2011. “A Comparison of Multisensor Integration Methods for Land Cover Classification in the Brazilian Amazon.” GIScience and Remote Sensing 48: 345–370. doi:10.2747/1548-1603.48.3.345.
- Lu, D., and Q. Weng. 2007. “A Survey of Image Classification Methods and Techniques for Improving Classification Performance.” International Journal of Remote Sensing 28 (5): 823–870. doi:10.1080/01431160600746456.
- Lucas, R. M., M. Honzák, I. D. Amaral, P. J. Curran, and G. M. Foody. 2002. “Forest Regeneration on Abandoned Clearances in Central Amazonia.” International Journal of Remote Sensing 23: 965–988. doi:10.1080/01431160110069791.
- Maeda, E. E., A. R. Formaggio, and Y. E. Shimabukuro. 2008. “Impacts of Land Use and Land Cover Changes on Sediment Yield in a Brazilian Amazon Drainage Basin.” GIScience and Remote Sensing 45: 443–453. doi:10.2747/1548-1603.45.4.443.
- Math Works Inc. 2013. MATLAB 2013a. Natick, MA.
- Moran, E. F., E. S. Brondizio, J. M. Tucker, M. C. Da Silva-Forsberg, S. Mccracken, and I. Falesi. 2000. “Effects of Soil Fertility and Land-Use on Forest Succession in Amazônia.” Forest Ecology and Management 139: 93–108. doi:10.1016/S0378-1127(99)00337-0.
- Narvaes, I. D. S. 2010. “Avaliação de dados SAR polarimétricos para estimativa de biomassa em diferentes fitofisionomias de florestas tropicais.” PhD diss., National Institute for Space Research, Brazil.
- Nepstad, D. C., C. R. De Carvalho, E. Davidson, P. H. Jipp, P. A. Lefebvre, G. H. Negreiros, E. D. Da Silva, T. A. Stone, S. E. Trumbore, and S. Vieira. 1994. “The Role of Deep Roots in the Hydrological and Carbon Cycles of Amazonian Forests and Pastures.” Nature 372: 666–669. doi:10.1038/372666a0.
- Numata, I., M. A. Cochrane, and L. S. Galvão. 2011. “Analyzing the Impacts of Frequency and Severity of Forest Fire on the Recovery of Disturbed Forest Using Landsat Time Series and EO-1 Hyperion in the Southern Brazilian Amazon.” Earth Interactions 15 (13): 1–17. doi:10.1175/2010EI372.1.
- Ota, T., N. Mizoue, and S. Yoshida. 2011. “Influence of Using Texture Information in Remote Sensed Data on the Accuracy of Forest Type Classification at Different Levels of Spatial Resolution.” Journal of Forest Research 16: 432–437. doi:10.1007/s10310-010-0233-6.
- Paneque-Gálvez, J., J. Mas, G. Moré, J. Cristóbal, M. Orta-Martínez, A. C. Luz, M. Guèzea, M. J. Macía, and V. Reyes-García. 2013. “Enhanced Land Use/Cover Classification of Heterogeneous Tropical Landscapes Using Support Vector Machines and Textural Homogeneity.” International Journal of Applied Earth Observation and Geoinformation 23: 372–383. doi:10.1016/j.jag.2012.10.007.
- Pereira, L. D. O., C. D. C. Freitas, S. J. S. Sant´Anna, D. Lu, and E. F. Moran. 2013. “Optical and Radar Data Integration for Land Use and Land Cover Mapping in the Brazilian Amazon.” GIScience and Remote Sensing 50 (3): 301–321.
- Prates-Clark, C. D. C., R. M. Lucas, and J. R. Santos. 2009. “Implications of Land-Use History for Forest Regeneration in the Brazilian Amazon.” Canadian Journal of Remote Sensing 35 (6): 534–553. doi:10.5589/m10-004.
- Roberts, D. A., M. O. Smith, and J. B. Adams. 1993. “Green Vegetation, Nonphotosynthetic Vegetation, and Soils in AVIRIS Data.” Remote Sensing of Environment 44: 255–269. doi:10.1016/0034-4257(93)90020-X.
- Santos, J. R., C. C. Freitas, L. S. Araujo, L. V. Dutra, J. C. Mura, F. F. Gama, L. S. Soler, and S. J. S. Sant’anna. 2003. “Airborne P-Band SAR Applied to the Aboveground Biomass Studies in the Brazilian Tropical Rainforest.” Remote Sensing of Environment 87: 482–493. doi:10.1016/j.rse.2002.12.001.
- Sarker, L. R., and J. E. Nichol. 2011. “Improved Forest Biomass Estimates Using ALOS AVNIR-2 Texture Indices.” Remote Sensing of Environment 115: 968–977. doi:10.1016/j.rse.2010.11.010.
- Shevliakova, E., S. Pacala, S. Malyshev, G. Hurtt, P. Milly, J. P. Caspersen, L. T. Sentman, J. P. Fisk, C. Wirth, and C. Crevoisier. 2009. “Carbon Cycling under 300 Years of Land Use Change: Importance of the Secondary Vegetation Sink.” Global Biogeochemical Cycles 23: GB2022. doi:10.1029/2007GB003176.
- Silva, R. D. 2014. “Estudo das variações espectrais e texturais em florestas primárias e sucessões secundárias na Flona Tapajós usando dados ALI/EO-1.” Master diss., National Institute for Space Research, Brazil.
- Sommer, R., M. Denich, and P. L. G. Vlek. 2000. “Carbon Storage and Root Penetration in Deep Soils under Small-Farmer Land-Use Systems in the Eastern Amazon Region, Brazil.” Plant and Soil 219: 231–241. doi:10.1023/A:1004772301158.
- Steininger, M. K. 2000. “Satellite Estimation of Tropical Secondary Forest Above-Ground Biomass: Data from Brazil and Bolivia.” International Journal of Remote Sensing 21: 1139–1157. doi:10.1080/014311600210119.
- Uhl, C., R. Buschbacher, and E. A. S. Serrao. 1988. “Abandoned Pastures in Eastern Amazonia. I. Patterns of Plant Succession.” Journal of Ecology 76: 663–681. doi:10.2307/2260566.
- Vieira, I. C. G., A. S. De Almeida, E. A. Davidson, T. A. Stone, C. J. R. De Carvalho, and J. B. Guerrero. 2003. “Classifying Successional Forests Using Landsat Spectral Properties and Ecological Characteristics in Eastern Amazônia.” Remote Sensing of Environment 87: 470–481. doi:10.1016/j.rse.2002.09.002.
- Wijaya, A., V. Liesenberg, and R. Gloaguen. 2010. “Retrieval of Forest Attributes in Complex Successional Forests of Central Indonesia: Modeling and Estimation of Bitemporal Data.” Forest Ecology and Management 259: 2315–2326. doi:10.1016/j.foreco.2010.03.004.
- Yang, X., T. Richardson, and A. Jain. 2010. “Contributions of Secondary Forest and Nitrogen Dynamics to Terrestrial Carbon Uptake.” Biogeosciences 7: 3041–3050. doi:10.5194/bg-7-3041-2010.
- Zhang, C. Y., Z. X. Xie, and D. Selch. 2013. “Fusing Lidar and Digital Aerial Photography for Object-Based Forest Mapping in the Florida Everglades.” GIScience and Remote Sensing 50 (5): 562–573.