
Abstract
Research on separation of successional stages has been an active topic for the past two decades because successional vegetation plays an important role in the carbon budget and restoration of soil fertility in the Brazilian Amazon. This article examines classification of successional stages by conducting a comparative analysis of classification algorithms (maximum likelihood classifier – MLC, artificial neural network – ANN, K-nearest neighbour – KNN, support vector machine – SVM, classification tree analysis – CTA, and object-based classification – OBC) on varying remote-sensing data-sets (Landsat and ALOS PALSAR). Through this research we obtained the following four major conclusions: (1) Landsat data provide higher classification accuracy than ALOS PALSAR data, and individual PALSAR data cannot effectively separate successional stages; (2) Fusion of Landsat and PALSAR data provides better classification than individual sensor data; (3) Depending on the data-set, the best classification algorithm varies, MLC and CTA are recommended for Landsat or fusion images; and KNN is recommended for the combination of Landsat and PALSAR data as extra bands; (4) the MLC based on fusion images is recommended for vegetation classification in the moist tropical region when sufficiently representative training samples are available.
1. Introduction
The colonization projects initiated in the 1970s and their subsequent associated road construction are major factors resulting in high deforestation in the Brazilian Amazon (Moran Citation1981; Laurance et al. Citation2004). The past four decades of deforestation has converted a vast area of mature forest into a mosaic of agricultural lands, pasture and successional vegetation (Roberts et al. Citation2002; Neeff et al. Citation2006; Lu et al. Citation2012). Successional vegetation is the regrowth of forest in deforested regions and there is not an obvious boundary between adjacent successional stages. In the Amazonian deforested regions, successional vegetation plays an important role in the carbon budget and soil fertility restoration due to its increasing area and high growth rate (Feldpausch et al. Citation2004; Orihuela-Belmonte et al. Citation2013). However, due to the large differences in biomass within successional stages, large uncertainties are created when successional vegetation is mapped as a homogenous group. Successional stages have a large variation in biomass density from less than 2 kg/m2 in initial stages to greater than 20 kg/m2 in advanced successional stage (Vieira et al. Citation2003; Lu Citation2005) due to the influence of soil fertility, land-use history and vegetation age. It is necessary to separate stages of successional vegetation and map their spatial distribution to reduce the uncertainty in carbon budget estimation.
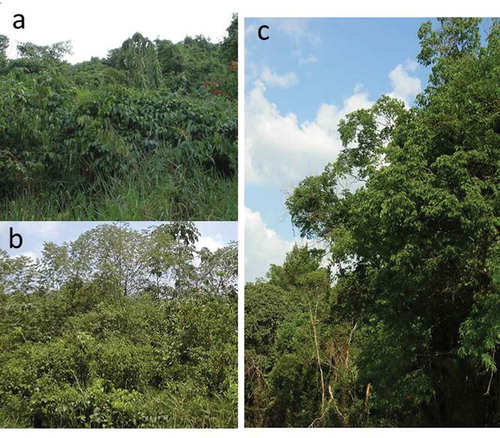
In general, successional vegetation can be grouped into three stages – initial (SS1), intermediate (SS2) and advanced (SS3) successional stages based on field measurements (Tucker, Brondizio, and Moran Citation1998; Lu et al. Citation2003) or remote-sensing data (Moran and Brondízio Citation1998; Lu Citation2005; Li et al. Citation2011; Lu et al. Citation2012). Different successional stages have their own characteristics in vegetation-stand structure (Moran and Brondízio Citation1998; Lu et al. Citation2003). As shown in , SS1 is initially characterized by dominance of grasses, herbaceous plants, vines and saplings (). Saplings are the main structural element in SS1 and represent the majority of the aboveground biomass. The vegetation structure in SS2 provides a mixture of dense sapling and young tree with higher canopy than SS1 and a small internal difference between canopy and understory individuals (). In SS3, trees occupy the canopy and present obvious stratification of forest-stand structure (). A detailed description of successional stages is provided in Lu (Citation2005).
Figure 1. A comparison of initial (SS1 – a), intermediate (SS2 – b) and advanced (SS3 – c) successional stages.
Remote-sensing data have unique characteristics (e.g. radiometric, spectral, spatial and temporal resolutions for optical sensor data and polarization options for radar data) to represent land-surface features, and have become primary data source for land cover or vegetation classification at various scales (Lu and Weng Citation2007; Aguirre-Salado et al. Citation2012; Johnston, Henry, and Gorchov Citation2012; Gong et al. Citation2013). Scientists have made great efforts using remotely sensed data for mapping stages of successional vegetation in the past two decades (Foody and Curran Citation1994; Moran et al. Citation1994; Palubinskas et al. Citation1995; Foody et al. Citation1996; Kimes et al. Citation1999; Salas et al. Citation2002; Castro, Sanchez-Azofeifa, and Rivard Citation2003; Vieira et al. Citation2003; Aguilar Citation2005; Kennaway and Helmer Citation2007; Galvão et al. Citation2009; Mello and Alves Citation2011; Li, Lu, Moran, Dutra et al. Citation2012; Lu et al. Citation2012). During the image classification procedure, selection of suitable remote-sensing variables and development of advanced classification algorithms have long been two active research topics to improve land-cover classification performance when training samples are available (Lu et al. Citation2012).
Although spectral signature has been recognized as the most important feature in land-cover classification, spatial information inherent in remote-sensing images also provides valuable information for improving classification (Li et al. Citation2011; Lu et al. Citation2012). Texture-based methods are commonly used to effectively employ spatial information in a classification procedure. Of the many texture metrics available (e.g., Haralick, Shanmugam, and Dinstein Citation1973; Marceau et al. Citation1990; Chen, Stow, and Gong Citation2004), the GLCM-based (grey-level co-occurrence matrix) texture measure is the most commonly used and has been extensively applied to land-cover classification (Marceau et al. Citation1990; Johansen et al. Citation2007; Li, Lu, Moran, Dutra et al. Citation2012; Wood et al. Citation2012).
As many types of remote-sensing data are available, it is important to effectively employ their varying features. Data fusion of different spatial resolution or sensor data can be used to integrate multispectral and panchromatic or radar data into a new data-set with improved spatial resolution while preserving multispectral features (Zhang Citation2010; Lu et al. Citation2011). The majority of data fusion techniques have been summarized in previous literature (e.g., Pohl and van Genderen Citation1998; Ehlers et al. Citation2010; Zhang Citation2010; Kandrika and Ravisankar Citation2011). In particular, the integration of optical and radar data-sets has been regarded effective in providing more new information than an individual data-set because of their different capabilities to capture land-surface features (Rignot, Salas, and Skole Citation1997; Lu et al. Citation2011; Pereira et al. Citation2013).
Many classification algorithms from traditional parametric such as maximum likelihood classifier (MLC) to non-parametric algorithms such as support vector machine (SVM), classification tree analysis (CTA), K-nearest neighbour (KNN) and artificial neural network (ANN) (Lu and Weng Citation2007; Tso and Mather Citation2009) can be used for vegetation classification. The majority of the classification methods are per-pixel-based assigning each pixel into a category and the results can be noisy due to the heterogeneity of a landscape (Lu and Weng Citation2007). An alternative to pixel-based classification is to use object-based classification (OBC) (Walter Citation2004; Mallinis et al. Citation2008; Blaschke Citation2010). Because of the difficulty in identifying an optimal algorithm for a specific study, a comparative analysis of different classification algorithms is often conducted (Li, Lu, Moran, and Sant’Anna Citation2012; Lu et al. Citation2012; Li, Im, and Beier Citation2013; Rosa and Wiesmann Citation2013; Cracknell and Reading Citation2014).
Our team has conducted research on land-use/cover classification in the moist tropical regions of the Brazilian Amazon in the past decade (see overviews by Lu et al. (Citation2012)). We have examined multiple remote-sensing variables from Landsat, ASTER, SPOT, radar (e.g. ALOS PALSAR L-band and Radarsat C-band) and their combination, and explored varying classification algorithms such as MLC, SVM, ANN and OBC for land-cover classification (Moran et al. Citation1994; Li, Lu, Moran, and Sant’Anna Citation2012; Lu et al. Citation2012). Based on our previous research, this article aims to provide a comparative analysis of data-sets and algorithms for vegetation classification in the Brazilian Amazon. This article’s primary contributions are the identification of data-sets and classification algorithms to provide the best separation of successional stages, and new insights for using remote-sensing techniques to distinguish successional stages in other moist tropical regions in the world.
2. Description of the study area
Altamira located in the northern Brazilian State of Pará was selected (see ). The study area covers approximately 3000 km2 and the dominant native vegetation is mature moist and liana forest. With the construction of the Transamazon Highway (BR-230) in the early 1970s, this population and older Caboclo settlers claimed land along the new highway and legalized their land claims. Major deforestation began in 1972, coincident with the construction of the Transamazon Highway (Moran Citation1981). In the past four decades, a large area of primary forest (e.g. mature moist and liana forest) was converted to successional vegetation, pasture and agricultural lands (Moran et al. Citation1994; Moran and Brondízio Citation1998; Li et al. Citation2011) ().
Figure 2. Study area in and around Altamira, Pará State, Brazil.
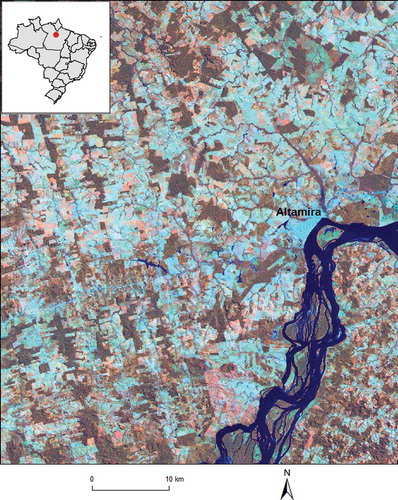
Additional environmental features in the study site, Altamira include moderately rolling uplands with highest elevation of approximately 350 m. Floodplains along the Xingu River are flat with lowest elevation of approximately 10 m. Annual rainfall in Altamira is approximately 2000 mm, concentrating from late October through early June; the dry period occurs between June and September. The average temperature is about 26°C (Tucker, Brondizio, and Moran Citation1998). Because of the relatively long land-use history and good-quality soil conditions in Altamira, successional vegetation has a wide variation of biomass density with different vegetation ages (Lu Citation2005). Therefore, this study area is ideal to examine how remote-sensing data can be used to separate successional vegetation into stages.
3. Methods
3.1. Data collection and preprocessing
Landsat and ALOS PALSAR data were selected for use in the Altamira study area. The Landsat 5 TM imagery was acquired on 2 July 2008 and six multispectral bands with 30 m spatial resolution were used. The Landsat imagery was geometrically rectified into the Universal Transverse Mercator (UTM) projection, Zone 22 South and the resulting root mean square error (RMSE) of geometric co-registration was less than 0.5 pixels. An improved image-based dark object subtraction model was then used to implement radiometric and atmospheric corrections (Chavez Citation1996; Chander, Markham, and Helder Citation2009). The ALOS PALSAR FBD (fine beam double polarization) Level 1.5 product with HH and HV polarization options (ground range, unsigned 16-bit integral number, 12.5-m pixel spacing) was acquired on 2 July 2009. The PALSAR L-band HH and HV images were registered into UTM with a RMSE value of 1.02 pixels based on 28 control points. These images were resampled to a cell size of 10 m × 10 m using the nearest neighbour sampling method during the image-to-image registration. A Lee-Sigma with a 5 × 5 window size was used to reduce the speckles in the PALSAR imagery. A detailed description of image preprocessing for Landsat TM and PALSAR L-band data was provided in Lu et al. (Citation2011).
In addition to the Landsat and PALSAR data, QuickBird imagery (acquired in 2008) and field survey data (collected in 2009) were used to collect a total of 432 sample plots. Approximately half of the sample plots (i.e. 220 plots) were randomly selected (based on the rule of minimum of 10 plots per class) for use as training plots during the image classification. The remaining 212 samples were used as test sample plots for accuracy assessment of the classified images. A detailed description of sample collection from field survey and QuickBird image was provided in our previous papers (Li et al. Citation2011; Lu et al. Citation2011). Thus, this article will not detail the data collection issue.
3.2. Comparison of different data-sets for vegetation classification
A common method to combine data-sets is to develop textural images from a radar image and incorporate the derived textural images as extra bands into multispectral image such as Landsat TM. Our research group previously examined six GLCM-based texture measures (e.g. variance, homogeneity, contrast, dissimilarity, entropy and second moment) with six window sizes (5 × 5, 9 × 9, 15 × 15, 19 × 19, 25 × 25, and 31 × 31) based on ALOS PALSAR L-band HH and HV images, and identified textures SM25 (second moment with a window size of 25 × 25 pixels) and CON31 (contrast with a window size of 31 × 31 pixels) based on HH image and textures CON25 (contrast with a window size of 25 × 25 pixels) and SM19 (second moment with a window size of 19 × 19 pixels) based on HV image provided the best separability of vegetation types (Li, Lu, Moran, Dutra et al. Citation2012). Therefore, these textural images are directly used in this research.
An alternative to combining different sensor data is the use of a data fusion technique. Many data fusion methods, such as principal component analysis, wavelet-merging technique, intensity-hue-saturation (IHS), Brovey transform, Gram Schmidt fusion and Ehlers fusion, have been developed to integrate spectral and spatial information (Pohl and van Genderen Citation1998; Chen and Stow Citation2003; Ehlers et al. Citation2010; Zhang Citation2010). Our previous research indicated use of the wavelet-merging technique to integrate Landsat TM and ALOS PALSAR L-band HH image provided the best classification performance for land-cover classification in the Amazon (Lu et al. Citation2011). Therefore, this fusion image is directly used in this research.
To compare the capabilities and functions of remote-sensing data-sets, four data-sets, (1) Landsat TM multispectral bands, (2) ALOS PALSAR HH, HV and textures, (3) combination of TM multispectral bands and textural images from PALSAR HH and HV data as extra bands and (4) data fusion result with wavelet-merging method based on TM multispectral and ALOS PALSAR L-band HH data, were used. The classification results based on these four data-sets were evaluated using the error matrix approach.
3.3. Comparison of different algorithms for vegetation classification
Classification algorithms are categorized as parametric or non-parametric. The parametric, MLC is the most commonly used for land-use/cover classification due to its robust, simple and easy to use software which is available in almost all image processing software packages. In recent decades, the CTA, ANN, KNN and SVM are commonly used non-parametric algorithms. As stated previously, because most classification algorithms are conducted on a per-pixel-based spectral image, the classification results may be noisy (Li et al. Citation2011; Lu et al. Citation2011). OBC provides an alternative for classifying remotely sensed images into a thematic map based on segments comparing with the traditional per-pixel-based classification methods. Considering the classification algorithms commonly used in land-use/cover classification in recent years, six algorithms – MLC, CTA, ANN, KNN, SVM and OBC – were selected in this research and they are briefly summarized in . Detailed description of these approaches can be found in Tso and Mather (Citation2009) and Li et al. (Citation2011).
Table 1. A summary of major characteristics of the classification algorithms.
3.4. Comparative analysis of vegetation classification results
A comparative analysis of the classification results is necessary to identify the data-set and classification algorithm with the best performance. Based on our research objectives and the characteristics of the study area, a classification system with three forest classes (i.e. upland, flooding and liana), three successional stages (i.e. initial – SS1, intermediate – SS2 and advanced – SS3), agropasture, and three non-vegetated classes (i.e. water, wetland and urban) were designed (Lu et al. Citation2011; Li, Lu, Moran, Dutra et al. Citation2012). The same training sample data were used for land-cover classification in each data-set and each selected classification algorithm. Because the objective of this research is the separation of successional vegetation stages, the comparative analysis is only on the three successional stages, that is, SS1, SS2 and SS3.
The error matrix method is used to evaluate land-cover classification results. This method provides a detailed assessment of the agreement between the classified result and reference data, and provides information on how the misclassification occurred (Congalton Citation1991; Congalton and Green Citation2008; Foody Citation2009). Because the accuracy assessment for vegetation classes in this research is partially based on our previous work on land-cover classification (Lu et al. Citation2011), we used the following methods to calculate the accuracy for each successional stage and overall vegetation classification accuracy:
4. Results and discussion
4.1. Analysis of classification results from different data-sets
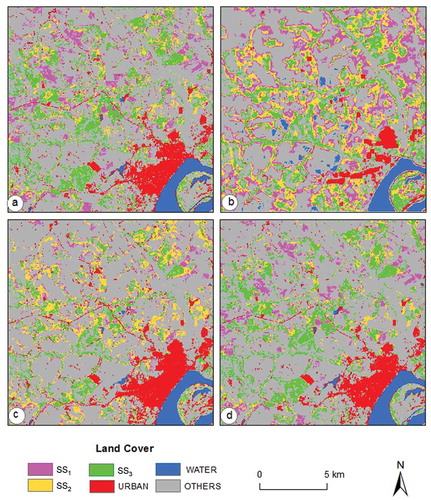
This research indicated Landsat data provided higher classification accuracy than ALOS PALSAR data, and integration of Landsat and PALSAR data with the wavelet-merging techniques further improved classification accuracy no matter which classification algorithm was used. However, the combination of Landsat and PALSAR-derived textures as extra bands may or may not improve classification depending on the classification algorithm (see ). Optical multispectral image has high classification performance for successional stages. This is because the optical sensor mainly captures land-surface features and its spectral signature can represent the change of forest-stand structure as vegetation grows (Lu Citation2005). However, the backscattering coefficients in radar data (e.g. ALOS PALSAR here) capture the roughness of land surfaces, and cannot effectively represent the difference of vegetation-stand structures. Therefore, radar data alone cannot provide satisfactory vegetation classification. Because of the different features of optical sensor and radar data, integration of both data-sets using suitable fusion techniques may combine the strengths of optical and radar data into one data-set, thus providing more information than individual sensor data. However, a simple combination of Landsat and PALSAR data as extra bands had little increase in performance for successional stages due to the poor performance of radar data. provides a comparison of vegetation distributions using the MLC based on four data-sets showing the accurate results of fusion image and poor capability of radar image for vegetation classification.
Table 2. A comparison of classification algorithms and data-sets for successional vegetation classification results in Altamira, Para State, Brazil.
Figure 3. Comparison of classification results among different data-sets using maximum likelihood classifier (a – Landsat TM multispectral image; b – ALOS PALSAR data; c – combination of TM and PALSAR data; d – fusion of TM multispectral and PALSAR L-band HH image).
4.2. Analysis of classification results using different algorithms
For accuracy in individual classification algorithm for a data-set, if the classification accuracy from the MLC is used as a baseline, non-parametric classification algorithms cannot guarantee improvement in vegetation classification for Landsat multispectral or fused multispectral images. Some algorithms such as SVM and ARTMAP produced lower classification accuracy than the MLC for four data-sets. For Landsat TM imagery, CTA, KNN and OBC only slightly improved classification accuracy compared to MLC. For PALSAR data, only OBC has higher classification accuracy than MLC. For the combination of Landsat and PALSAR as extra bands, only KNN and OBC improved classification accuracy. In contrast, for the fusion data-set all the non-parametric algorithms have poorer performance than MLC. indicates no one algorithm can provide best vegetation classification for different remote-sensing data. A synthetic analysis of indicated MLC provided high classification results compared with non-parametric algorithms, especially for TM multispectral data and the fused image. Some non-parametric algorithms such as OBC and KNN provided better classification than MLC, but it is critical to identify optimal parameters used in relevant algorithms. Improper parameterization may reduce vegetation classification.
4.3. Comparative analysis of classification results from different data-sets using various classification algorithms
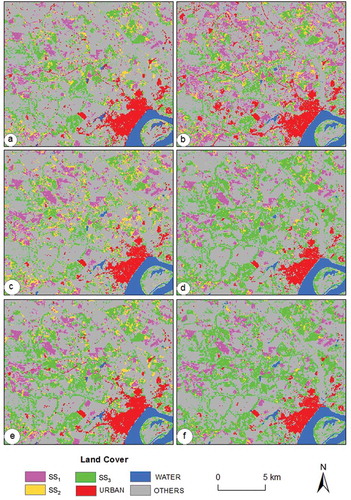
Comparing the individual successional stage, no algorithm can provide the best accuracy for all successional stages based on different data-sets. For Landsat TM multispectral image, CTA provided the best result for SS1, but OBC provided the best result for SS2 and SS3, implying the importance of reducing the spectral variation in complex forest-stand structure to improve classification. For PALSAR data, SVM provided the best for SS1 and CTA the best for SS2, but all selected algorithms had poor performance for SS3 with accuracy of less than 32%. This implies radar data are unable to separate vegetation types, especially the SS3 because of its similar stand structure to mature forest, that is, similar roughness of forest canopy. For the combination of TM and PALSAR data, KNN provided the best for SS1 and SS3, but MLC for SS2. Interestingly, all non-parametric classification algorithms have lower performance than MLC for the separation of SS2 from other vegetation types. For the fusion image, MLC provided the best for SS1, and ARTMAP provided the best for SS2 and SS3. This research indicates algorithms have various performances for succession stages, implying the necessity to combine results into a new thematic map ensuring the best result for each class. provides examples for a comparison of classification results based on the fusion image using different classification algorithms, showing different spatial patterns of vegetation classification.
Figure 4. Comparison of classification results based on fusion image using different classification algorithms (a – MLC; b – CTA; c – ARTMAP; d – KNN; e – OBC; f – SVM).
Above classification results indicated no one single data-set and no one algorithm can provide the best results for all vegetation types. A potential solution is to combine results from data-sets or algorithms. Previous research has indicated the potential of assembling classification results from variables or algorithms to further improve classification results (Waske and Braun Citation2009; Ceamanos et al. Citation2010; Chitroub Citation2010; Zhu Citation2010; Du et al. Citation2012). However, it is critical to develop suitable rules to perform this integration.
Our research indicated the challenge in separating vegetation stages using individual sensor data due to complex-stand structure. Because different sensor data – optical, radar, and LiDAR – have various capabilities in capturing forest-stand attributes, this research showed the importance of integrating optical and radar to improve vegetation classification. Since LiDAR has the capability to provide tree or canopy height information (Castillo et al. Citation2012), the integration of LiDAR and optical (and/or radar) may be valuable to improve vegetation classification. However, incorporation of LiDAR data and optical or radar data for improving vegetation classification has not been extensively used because of the constraints of availability of LiDAR data.
5. Summary
Although mapping of successional vegetation distribution has gained increased attention in the past two decades because of its importance in reducing carbon budget uncertainty and restoration of soil conditions, accurate separation of successional stages is still a challenge. Through this research, the following conclusions can be obtained:
Remote-sensing data – Landsat TM provided higher classification accuracy than ALOS PALSAR, and integration of both data-sets using wavelet-merging techniques improved classification performance of successional stages;
Classification algorithms – MLC provides reasonable good classification accuracy, and some non-parametric algorithms improved classification, but optimization of relevant parameters in the algorithm is critical;
No single remote-sensing data or classification algorithm can provide the best accuracy for each successional stage, implying the importance of combining classification results into a new result through certain rules;
When representative training samples for vegetation types are available, MLC based on the fusion image of Landsat TM and ALOS PALSAR data provided the best classification result and is recommended for vegetation classification in the moist tropical region.
Funding
The authors acknowledge the support from the Zhejiang A&F University’s Research and Development Fund for the talent startup project [2013FR052], Zhejiang Provincial Key Laboratory of Carbon Cycling in Forest Ecosystems and Carbon Sequestration at Zhejiang A&F University, and the Center for Global Change and Earth Observations at Michigan State University. The authors also would like to acknowledge the support from the National High Technology Research and Development Program of China [2013AA122802] and the National Basic Research Program of China [no. 2010CB950900].
References
- Aguilar, A. 2005. “Remote Sensing of Forest Regeneration in Highland Tropical Forests.” GIScience & Remote Sensing 42: 66–79. doi:10.2747/1548-1603.42.1.66.
- Aguirre-Salado, C. A., E. J. Treviño-Garza, O. A. Aguirre-Calderón, J. Jiménez-Pérez, M. A. González-Tagle, L. Miranda-Aragón, J. René Valdez-Lazalde, A. I. Aguirre-Salado, and G. Sánchez-Díaz. 2012. “Forest Cover Mapping in North-Central Mexico: A Comparison of Digital Image Processing Methods.” GIScience and Remote Sensing 49: 895–914. doi:10.2747/1548-1603.49.6.895.
- Blaschke, T. 2010. “Object Based Image Analysis for Remote Sensing.” ISPRS Journal of Photogrammetry and Remote Sensing 65 (1): 2–16. doi:10.1016/j.isprsjprs.2009.06.004.
- Castillo, M., B. Rivard, A. Sanchez-Azofeifa, J. Calvo-Alvarado, and R. Dubayah. 2012. “LIDAR Remote Sensing for Secondary Tropical Dry Forest Identification.” Remote Sensing of Environment 121: 132–143. doi:10.1016/j.rse.2012.01.012.
- Castro, K. L., A. Sanchez-Azofeifa, and B. Rivard. 2003. “Monitoring Secondary Tropical Forests Using Space-borne Data: Implications for Central America.” International Journal of Remote Sensing 24 (9): 1853–1894. doi:10.1080/01431160210154056.
- Ceamanos, X., B. Waske, J. A. Benediktsson, J. Chanussot, M. Fauvel, and J. R. Sveinsson. 2010. “A Classifier Ensemble Based on Fusion of Support Vector Machines for Classifying Hyperspectral Data.” International Journal of Image and Data Fusion 1 (4): 293–307. doi:10.1080/19479832.2010.485935.
- Chander, G., B. L. Markham, and D. L. Helder. 2009. “Summary of Current Radiometric Calibration Coefficients for Landsat MSS, TM, ETM+, and EO-1 ALI Sensors.” Remote Sensing of Environment 113: 893–903. doi:10.1016/j.rse.2009.01.007.
- Chavez, P. S., Jr. 1996. “Image-based Atmospheric Corrections – Revisited and Improved.” Photogrammetric Engineering and Remote Sensing 62: 1025–1036.
- Chen, D., and D. A. Stow. 2003. “Strategies for Integrating Information from Multiple Spatial Resolutions into Land-use/Land-cover Classification Routines.” Photogrammetric Engineering and Remote Sensing 69: 1279–1287. doi:10.14358/PERS.69.11.1279.
- Chen, D., D. A. Stow, and P. Gong. 2004. “Examining the Effect of Spatial Resolution and Texture Window Size on Classification Accuracy: An Urban Environment Case.” International Journal of Remote Sensing 25 (11): 2177–2192. doi:10.1080/01431160310001618464.
- Chitroub, S. 2010. “Classifier Combination and Score Level Fusion: Concepts and Practical Aspects.” International Journal of Image and Data Fusion 1 (2): 113–135. doi:10.1080/19479830903561944.
- Congalton, R. G. 1991. “A Review of Assessing the Accuracy of Classifications of Remotely Sensed Data.” Remote Sensing of Environment 37: 35–46. doi:10.1016/0034-4257(91)90048-B.
- Congalton, R. G., and K. Green. 2008. Assessing the Accuracy of Remotely Sensed Data: Principles and Practices. 2nd ed. Boca Raton, FL: CRC Press.
- Cracknell, M. J., and A. M. Reading. 2014. “Geological Mapping using Remote Sensing Data: A Comparison of Five Machine Learning Algorithms, Their Response to Variations in the Spatial Distribution of Training Data and the use of Explicit Spatial Information.” Computers and Geosciences 63: 22–33. doi:10.1016/j.cageo.2013.10.008.
- Du, P., J. Xia, W. Zhang, K. Tan, Y. Liu, and S. Liu. 2012. “Multiple Classifier System for Remote Sensing Image Classification: A Review.” Sensors 12 (12): 4764–4792. doi:10.3390/s120404764.
- Ehlers, M., S. Klonus, P. J. Johan Åstrand, and P. Rosso. 2010. “Multisensor Image Fusion for Pansharpening in Remote Sensing.” International Journal of Image and Data Fusion 1: 25–45. doi:10.1080/19479830903561985.
- Feldpausch, T. R., M. A. Rondon, E. C. M. Fernandes, S. J. Riha, and E. Wandelli. 2004. “Carbon and Nutrient Accumulation in Secondary Forests Regenerating on Pastures in Central Amazonia.” Ecological Applications 14 (sp4): S164–S176. doi:10.1890/01-6015.
- Foody, G. M. 2009. “Classification Accuracy Comparison: Hypothesis Tests and the use of Confidence Intervals in Evaluations of Difference, Equivalence and Non-inferiority.” Remote Sensing of Environment 113 (8): 1658–1663. doi:10.1016/j.rse.2009.03.014.
- Foody, G. M., and P. J. Curran. 1994. “Estimation of Tropical Forest Extent and Regenerative Stage using Remotely Sensed Data.” Journal of Biogeography 21: 223–244. doi:10.2307/2845527.
- Foody, G. M., G. Palubinskas, R. M. Lucas, P. J. Curran, and M. Honzák. 1996. “Identifying Terrestrial Carbon Sinks: Classification of Successional Stages in Regenerating Tropical Forest from Landsat TM Data.” Remote Sensing of Environment 55: 205–216. doi:10.1016/S0034-4257(95)00196-4.
- Galvão, L. S., F. J. Ponzoni, V. Liesenberg, and J. R. D. Santos. 2009. “Possibilities of Discriminating Tropical Secondary Succession in Amazônia using Hyperspectral and Multiangular CHRIS/PROBA Data.” International Journal of Applied Earth Observation and Geoinformation 11 (1): 8–14. doi:10.1016/j.jag.2008.04.001.
- Gong, P., J. Wang, L. Yu, Y. Zhao, Y. Zhao, Z. Liang, Z. Niu, et al. 2013. “Finer Resolution Observation and Monitoring of Global Land Cover: First Mapping Results with Landsat TM and ETM + Data.” International Journal of Remote Sensing 34 (7): 2607–2654. doi:10.1080/01431161.2012.748992.
- Haralick, R. M., K. Shanmugam, and I. Dinstein. 1973. “Textural Features for Image Classification.” IEEE Transactions on Systems, Man and Cybernetics 3: 610–621. doi:10.1109/TSMC.1973.4309314.
- Johansen, K., N. C. Coops, S. E. Gergel, and Y. Stange. 2007. “Application of High Spatial Resolution Satellite Imagery for Riparian and Forest Ecosystem Classification.” Remote Sensing of Environment 110 (1): 29–44. doi:10.1016/j.rse.2007.02.014.
- Johnston, S. E., M. C. Henry, and D. L. Gorchov. 2012. “Using Advanced Land Imager (ALI) and Landsat Thematic Mapper (TM) for the Detection of the Invasive Shrub.” GIScience and Remote Sensing 49: 450–462. doi:10.2747/1548-1603.49.3.450.
- Kandrika, S., and T. Ravisankar. 2011. “Multi-temporal Satellite Imagery and Data Fusion for Improved Land Cover Information Extraction.” International Journal of Image and Data Fusion 2 (1): 61–73. doi:10.1080/19479832.2010.518166.
- Kennaway, T., and E. H. Helmer. 2007. “The Forest Types and Ages Cleared for Land Development in Puerto Rico.” GIScience & Remote Sensing 44: 356–382. doi:10.2747/1548-1603.44.4.356.
- Kimes, D. S., R. F. Nelson, W. A. Salas, and D. L. Skole. 1999. “Mapping Secondary Tropical Forest and Forest Age from SPOT HRV Data.” International Journal of Remote Sensing 20: 3625–3640. doi:10.1080/014311699211246.
- Laurance, W., A. K. M. Albernaz, P. M. Fearnside, H. L. Vasconcelos, and L. V. Ferreira. 2004. “Deforestation in Amazonia.” Science 304: 1109–1111. doi:10.1126/science.304.5674.1109b.
- Li, G., D. Lu, E. Moran, L. Dutra, and M. Batistella. 2012. “A Comparative Analysis of ALOS PALSAR L-band and RADARSAT-2 C-band Data for Land-cover Classification in a Tropical Moist Region.” ISPRS Journal of Photogrammetry and Remote Sensing 70: 26–38. doi:10.1016/j.isprsjprs.2012.03.010.
- Li, G., D. Lu, E. Moran, and S. Hetrick. 2011. “Land-Cover Classification in a Moist Tropical Region of Brazil with Landsat Thematic Mapper Imagery.” International Journal of Remote Sensing 32 (23): 8207–8230. doi:10.1080/01431161.2010.532831.
- Li, G., D. Lu, E. Moran, and S. J. S. Sant’Anna. 2012. “A Comparative Analysis of Classification Algorithms and Multiple Sensor Data for Land use/Land Cover Classification in the Brazilian Amazon.” Journal of Applied Remote Sensing 6 (1): 061706. doi:10.1117/1.JRS.6.061706.
- Li, M., J. Im, and C. Beier. 2013. “Machine Learning Approaches for Forest Classification and Change Analysis using Multi-temporal Landsat TM Images over Huntington Wildlife Forest.” GIScience & Remote Sensing 50 (4): 361–384.
- Lu, D. 2005. “Integration of Vegetation Inventory Data and Landsat TM Image for Vegetation Classification in the Western Brazilian Amazon.” Forest Ecology and Management 213 (1–3): 369–383. doi:10.1016/j.foreco.2005.04.004.
- Lu, D., M. Batistella, G. Li, E. Moran, S. Hetrick, C. Freitas, L. Dutra, and S. J. S. Sant’Anna. 2012. “Land use/Cover Classification in the Brazilian Amazon using Satellite Images.” Brazilian Journal of Agricultural Research 47 (9): 1185–1208.
- Lu, D., G. Li, E. Moran, L. Dutra, and M. Batistella. 2011. “A Comparison of Multisensor Integration Methods for Land-cover Classification in the Brazilian Amazon.” GIScience & Remote Sensing 48 (3): 345–370. doi:10.2747/1548-1603.48.3.345.
- Lu, D., P. Mausel, E. Brondízio, and E. Moran. 2003. “Classification of Successional Forest Stages in the Brazilian Amazon Basin.” Forest Ecology and Management 181 (3): 301–312. doi:10.1016/S0378-1127(03)00003-3.
- Lu, D., and Q. Weng. 2007. “A survey of Image Classification Methods and Techniques for Improving Classification Performance.” International Journal of Remote Sensing 28 (5): 823–870. doi:10.1080/01431160600746456.
- Mallinis, G., N. Koutsias, M. Tsakiri-Strati, and M. Karteris. 2008. “Object-based Classification using QuickBird Imagery for Delineating Forest Vegetation Polygons in a Mediterranean Test Site.” ISPRS Journal of Photogrammetry and Remote Sensing 63: 237–250. doi:10.1016/j.isprsjprs.2007.08.007.
- Marceau, D. J., P. J. Howarth, J. M. Dubois, and D. J. Gratton. 1990. “Evaluation of the Grey-Level Co-occurrence Matrix Method for Land-cover Classification using SPOT Imagery.” IEEE Transactions on Geoscience and Remote Sensing 28: 513–519. doi:10.1109/TGRS.1990.572937.
- Mello, A. Y. I., and D. S. Alves. 2011. “Secondary Vegetation Dynamics in the Brazilian Amazon based on Thematic Mapper Imagery.” Remote Sensing Letters 2 (3): 189–194. doi:10.1080/01431161.2010.506206.
- Moran, E. F. 1981. Developing the Amazon. Bloomington, IN: Indiana University Press.
- Moran, E. F., E. Brondízio, P. Mausel, and Y. Wu. 1994. “Integrating Amazonian Vegetation, Land use, and Satellite Data.” Bioscience 44: 329–338. doi:10.2307/1312383.
- Moran, E. F., and E. S. Brondízio. 1998. “Land-use Change after Deforestation in Amazônia.” In People and Pixels: Linking Remote Sensing and Social Science, edited by D. Liverman, E. F. Moran, R. R. Rindfuss, and P. C. Stern, 94–120. Washington, DC: National Academy Press.
- Neeff, T., R. M. Lucas, J. R. Dos Santos, E. S. Brondizio, and C. C. Freitas. 2006. “Area and Age of Secondary Forests in Brazilian Amazonia 1978–2002: An Empirical Estimate.” Ecosystems 9 (4): 609–623. doi:10.1007/s10021-006-0001-9.
- Orihuela-Belmonte, D. E., B. H. J. De Jong, J. Mendoza-Vega, J. Van der Wal, F. Paz-Pellat, L. Soto-Pinto, and A. Flamenco-Sandoval. 2013. “Carbon Stocks and Accumulation Rates in Tropical Secondary Forests at the Scale of Community, Landscape and Forest Type.” Agriculture, Ecosystems and Environment 171: 72–84. doi:10.1016/j.agee.2013.03.012.
- Palubinskas, G., R. M. Lucas, G. M. Foody, and P. J. Curran. 1995. “An Evaluation of Fuzzy and Texture based Classification Approaches for Mapping Regenerating Tropical Forest Classes from Landsat TM Data.” International Journal of Remote Sensing 16: 747–759. doi:10.1080/01431169508954437.
- Pereira, L. P., C. C. Freitas, S. S. Sant´Anna, D. Lu, and E. Moran. 2013. “Optical and Radar Data Integration for Land use and Land Cover Mapping in the Brazilian Amazon.” GIScience & Remote Sensing 50 (3): 301–321.
- Pohl, C., and J. L. van Genderen. 1998. “Multisensor Image Fusion in Remote Sensing: Concepts, Methods and Applications.” International Journal of Remote Sensing 19: 823–854. doi:10.1080/014311698215748.
- Rignot, E., W. A. Salas, and D. L. Skole. 1997. “Mapping Deforestation and Secondary Growth in Rondonia, Brazil, using Imaging Radar and Thematic Mapper Data.” Remote Sensing of Environment 59 (2): 167–179. doi:10.1016/S0034-4257(96)00150-2.
- Roberts, D. A., I. Numata, K. Holmes, G. Batista, T. Krug, A. Monteiro, B. Powell, and O. A. Chadwick. 2002. “Large Area Mapping of Land-Cover Change in Rondônia using Multitemporal Spectral Mixture Analysis and Decision Tree Classifiers.” Journal of Geophysical Research 107 (D20): 8073 LBA 40-1 to 40-18. doi:10.1029/2001JD000374.
- Rosa, D., and D. Wiesmann. 2013. “Land Cover and Impervious Surface Extraction using Parametric and Nonparametric Algorithms from the Open-Source Software R: An Application to Sustainable Urban Planning in Sicily.” GIScience & Remote Sensing 50 (2): 231–250.
- Salas, W. A., M. J. Ducey, E. Rignot, and D. Skole. 2002. “Assessment of JERS-1 SAR for Monitoring Secondary Vegetation in Amazonia: II. Spatial, Temporal, and Radiometric Considerations for Operational Monitoring.” International Journal of Remote Sensing 23 (7): 1381–1399. doi:10.1080/01431160110092948.
- Tso, B., and P. M. Mather. 2009. Classification Methods for Remotely Sensed Data. London: Taylor & Francis.
- Tucker, J. M., E. S. Brondizio, and E. F. Moran. 1998. “Rates of Forest Regrowth in Eastern Amazônia: A Comparison of Altamira and Bragantina Regions, Para State, Brazil.” Interciencia 23: 64–73.
- Vieira, I. C. G., A. S. De Almeida, E. A. Davidson, T. A. Stone, C. J. R. de Carvalho, and J. B. Guerrero. 2003. “Classifying Successional Forests using Landsat Spectral Properties and Ecological Characteristics in Eastern Amazonia.” Remote Sensing of Environment 87: 470–481. doi:10.1016/j.rse.2002.09.002.
- Walter, V. 2004. “Object-based Classification of Remote Sensing Data for Change Detection.” ISPRS Journal of Photogrammetry and Remote Sensing 58: 225–238. doi:10.1016/j.isprsjprs.2003.09.007.
- Waske, B., and M. Braun. 2009. “Classifier Ensembles for Land Cover Mapping using Multitemporal SAR Imagery.” ISPRS Journal of Photogrammetry and Remote Sensing 64 (5): 450–457. doi:10.1016/j.isprsjprs.2009.01.003.
- Wood, E. M., A. M. Pidgeon, V. C. Radeloff, and N. S. Keuler. 2012. “Image Texture as a Remotely Sensed Measure of Vegetation Structure.” Remote Sensing of Environment 121: 516–526. doi:10.1016/j.rse.2012.01.003.
- Zhang, J. 2010. “Multisource Remote Sensing Data Fusion: Status and Trends.” International Journal of Image and Data Fusion 1: 5–24. doi:10.1080/19479830903561035.
- Zhu, D. 2010. “A Hybrid Approach for Efficient Ensembles.” Decision Support Systems 48: 480–487. doi:10.1016/j.dss.2009.06.007.