
Abstract
The pseudoscopic effect in satellite imagery causes perception problems for rugged terrain. The topographic relief is perceived in reverse in images with southeast illumination because of the position of land shadows and the mechanisms of human vision and depth perception. This article presents a correction method for false topographic perception phenomena. Superposition of the orthoimage and the correctly shaded digital elevation model (DEM) provides the correct three-dimensional visualization of the relief. This study demonstrates the applicability of this processing technique for the correction of such effects to provide cartography with a more useful interpretation. The resolution of the DEM employed should be in accordance with the spatial resolution of each image. The opacity level proposed for the overlapping DEM is 50%, 30% and 45% for each image type. The selection of the most appropriate local incidence angle is determined by the level of terrain roughness in the work area.
1. Introduction
In any image or photograph, the position of the light source, whether it is the sun or artificial illumination, determines the manner in which the objects in the image are perceived. There is much evidence (Okoshi Citation1976; Teittinen Citation1993; Bernabe-Poveda and Coltekin Citation2014) that relates object lighting and shading with the capacity of human vision to perceive depth. Thus, as explained in Morgenstern, Murray, and Harris (Citation2011), when we view pictures of shaded objects three-dimensionally, the human vision system solves the potential ambiguities that may arise in the interpretation of the object by assuming that the light always comes from overhead.
In the Cartography field, a longstanding convention in shaded models is that the light comes from the northwest (henceforth, NW), i.e., the upper-left corner of north-oriented maps. The first samples of this convention are from when shaded maps were made by hand. Although the origin of this practice is not entirely clear, some authors, such as Metzger (Citation2006) and Patterson (Citation2001), have suggested the following possible interpretation: the vast majority of people are right-handed and therefore, when they write or draw, they tend to place the light source at the left side such that the shadows do not interfere with their work.
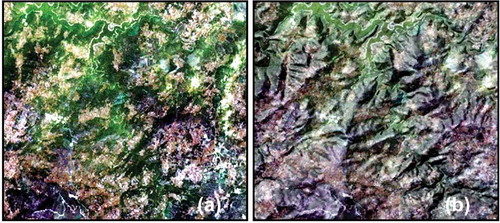
Regardless of the origin of this convention, its generalization has caused our brains to use this same idea to interpret reliefs in other related areas in which work is performed using nadir images such as aerial photos or terrain satellite images (Rock Citation1984; Toutin Citation1997). When the scene illumination comes from the lower part of the image, an optical illusion called the pseudoscopic effect in photogrammetry (Paine and Kiser Citation2012) is producedFootnote1. Contrary to the manner with which we are accustomed, the shadows are projected toward the upper part; thus, the brain assumes that the relief is inverted. Therefore, the ridges are interpreted as valleys and vice versa, which leads to errors in the photointerpretation process, as is illustrated in .
Figure 1. Original IRS image of Sierra de Ancares (a) and shaded digital elevation model (DEM) with NW illumination (b).
In the particular case of remote sensing, the pseudoscopic effect has particular importance because most of the observation satellites that take images of the Earth’s surface have polar or quasi-polar orbits in which the orbital plane is synchronized with the Sun (Sun-synchronous orbit). For such satellites, the hours of satellite daytime passes are always in the morning, between 9:00 and 11:00 A.M. solar local time in most cases, because of the optimal conditions for image capture during this time. Because images are acquired in this time slot, in the northern hemisphere,Footnote2 the images are captured when the illumination source is from the SE (southeast) direction, thereby causing the terrain reversal effect.
In spite of the fact that the false topographic perception phenomena (FTPP) are universal phenomena that occur in any place with a light source, their appearance also depends on other factors, such as the terrain itself. More rugged terrain yields a more noticeable effect because of the appearance of shadows in non-illuminated slopes. In fact, in flat areas, even with suitable lighting conditions for the appearance of FTPP (south-east illumination), FTPP are not always noticeable. Patterson (Citation2001) also notes that the perception of inverted relief is greater when the source of illumination is perpendicular to linear landforms and when linear landforms are situated amidst flat surroundings.
This article presents the following structure. Following this introduction, general solutions for correction of the FTPP problem are reported and discussed in Section 2. Section 3 describes in detail the methodology for generation of shaded relief model (SRM) and overlapping of image and SRM. Section 4 describes the parameters to use so as to correct the pseudoscopic effect. Section 5 outlines some conclusions.
2. Related work
It is difficult to define general methods for the correction of the pseudoscopic effect because self-perception of this effect is conditioned by subjective factors regarding the image user or observer and the environment or context of the image; this issue has been discussed by Liu and Todd (Citation2004), Hayashi, Umeda, and Cook (Citation2007) and Morgenstern, Murray, and Harris (Citation2011). An example of this assertion can be found in the , in which the lower position of the light source should lead to the relief inversion effect. However, in the image, the observer is able to perceive the ridge correctly because of the proximity of the sea (in black).
Figure 2. FTPP mitigation in the specific context of coastal areas.
However, in recent years, many remote sensing studies, which are detailed in the following, have proposed solutions for the FTPP problem. In all of the proposed methods, the basic idea is to change the illumination direction in the original image.
Most likely the simplest method of all is to rotate the image such that the light source is in the NW direction. This is the method applied in Saraf et al. (Citation1996) for the correct visualization of the relief in satellite images. However, the method has important drawbacks. Whereas in other areas, the method can be a quick and effective method for image viewing, in remote sensing or in cartography, it can often be uncomfortable or even confusing to work with disoriented images because of the viewers’ familiarity with the northern orientation, as noted by Bernabé, Manso, and Ballari (Citation2005) and Bernabé, Sánchez, and Çöltekin (Citation2011). In Saraf et al. (Citation2011), the authors used simple rotation to correct the effect of inverted terrain perception that can appear in images of lunar craters taken by the satellite Chandrayaan-1. Beyond the description of a method to correct FTPP, this work confirms the universality of this phenomenon, which is not only confined to the Earth’s images; rather, the phenomenon is much more obvious for the Moon’s surface or for any planet with a definite illumination pattern combined with rugged terrain because of the absence of an atmosphere and vegetation and artificial structures on their surfaces.
To correct FTPP, Gil, Armesto, and Cañas (Citation2005) used principal component analysis (PCA) of the three channels that resulted from the fusion of a Landsat-TM composite and weighted SPOT (Satellite Pour lÓbservation de la Terre – earth observation satellite) panchromatic (P) data. The fusion was performed using the intensity-hue-saturation (IHS) system, in which the intensity is replaced with the weighted P channel of the SPOT image. The subsequent PCA yielded satisfactory results in the elimination of the FTPP using the first principal component. The primary limitation of this technique is that it provides a P image. For the correction of an IRS-1C XS image of part of the Himalaya, Saraf et al. (Citation2007) proposed transforming from red–green–blue (RGB) to IHS to invert the intensities of the images (by creating negatives of them) and then again converting the image from IHS to RGB to obtain the pseudoscopic effect correction.
Another possibility for terrain reversal effect correction without digital elevation model (DEM) is to use negative views of the images generated using reverse scaling of the grey levels or simply look-up table (LUT) inversions to not alter the image. With image inversion, the shaded hillsides in the original image become illuminated and vice versa; in this manner, a correct view of the morphology of the terrain is achieved. An example application of this method is presented in Gil, Armesto, and Cañas (Citation2005), who achieved results with high-quality shaded relief using LUT inversion applied to SPOT-P images. However, for Landsat colour composites, the results are rather poor because of the alteration of radiometry and low contrast. According to Bernabé, Manso, and Ballari (Citation2005) and Bernabé, Sánchez, and Çöltekin (Citation2011), these methods may modify the colour information in such a fundamental manner that it becomes nearly impossible to distinguish the natural features.
Until now, the correction methods most commonly used are those that employ a DEM as a basis for generating a SRM with the correct illumination direction and then proceed to combine the original image with the SRM to compensate for the pseudoscopic effect. This is the case for Saraf et al. (Citation2005), who propose SRM generation with NW illumination from a DEM. In their method, the original RGB image is transformed to the IHS system. The SRM is used instead of the intensity image channel of the IHS composite. Then, an inverse transformation from IHS to RGB is performed. An FTPP-rectified image is obtained with this method.
In Bernabé, Manso, and Ballari (Citation2005) is shown a correction method for the relief inversion effect on airborne images for the specific application to a Web Map Server. The authors propose the use of the transparency capability of information layers to generate cartography. It was set up so that the ortho-photo, with a 20% transparency, was under the shading layer, with a 60% transparency. Correction of FTTP for this application is obtained, when shadow-model layer plus ortho-image layer are coupled, so that the map server automatically carries out the merging of the two layers for each consultation.
In Gil et al. (Citation2010), the authors propose a method for the correction of QuickBird P, multispectral (XS) and fused images affected by the relief inversion. A DEM generated from a 1:5000-scale contour map (with 5-m contour intervals) is then used to create a correctly illuminated SRM. By overlapping each of the images and the SRM with different opacity levels, a visualization of the true form of the terrain is obtained. This image processing does not involve any transformation of the original images; rather, it only affects the display of the relief. In this process, the DEM resolution is an important factor that should be a function of the spatial resolution of the satellite image because a model with too low resolution in relation to the image will cause distortions in the corrected image. Wu, Li, and Gao (Citation2013), assert that if the resolution of the DEM is very different from the image pixel size, the performance of the FTPP correction will be poor.
Bernabé, Sánchez, and Çöltekin (Citation2011) proposed the use of semi-transparent hill shading overlays on the ortho-photo by means of an image in an RGBA colour space: the value of the RGB channels corresponds to the value of the hill shading model, whereas the value of the alpha channel will be 0 in flat areas and will rise to 1 in hilly areas. This method has the disadvantage that de-saturates the colours in the ortho-photo.
As in Saraf et al. (Citation2011), Wu, Li, and Gao (Citation2013) used lunar images to correct the pseudoscopic effect in craters, but in this case, the correction method was again a DEM generated using data from a laser altimeter to create an SRM of the crater. The subsequent fusion of the original image of the crater and the SRM was performed using a shift-invariant discrete wavelet transform. The FTPP problem was then alleviated in the resulting image.
The present article analyses how the correction method proposed by Gil et al. (Citation2010), which employs an SRM overlapped with the satellite image, must be adapted for different sources of data: multi-platform satellite imagery with different spatial resolutions, different acquisition modes (P or XS), and different terrains and landforms. We verify the applicability and usefulness of the method for the correction of FTPP in all cases.
3. Methods
First, geometric correction of images is performed to give them cartographic validity and ensure correct overlap with the shaded model. The SRM is generated from the DEM with NW illumination with the aim of compensating for image lighting and eliminating the perception of relief inversion. The overlap of the SRM (with a certain degree of transparency) on the original image eliminates or mitigates the pseudoscopic effect. The flow chart for the method is shown in .
Figure 3. Workflow for FTPP mitigation.
3.1. Image data and cartography
To evaluate the results of the proposed method in scenes captured by different types of sensors, we used P and XS images from some of the most commonly used platforms in remote sensing, Landsat, SPOT, IRS, IKONOS and QuickBird (). The results from the merging of different images using the Canadian PCI-Geomatics® software algorithm PANSHARP were analysed also.
Table 1. Images used in the work.
An important factor in the images, besides the topography itself, is the solar position because it directly affects the appearance of shadows on the ground. From the metadata text files provided by the distribution companies, it is possible to know the solar position at the moment of image capture (). The shadows projected by elements such as buildings or trees serve as a sample with which to compare the data, as shown in .
Table 2. Examples of solar position.
Figure 4. Illumination direction in P QuickBird data (a) and IKONOS data (b).
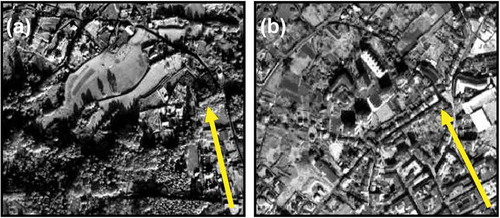
With the example data given in , it is possible to predict that the shadows projected in the QuickBird image will be higher because the angle of solar elevation is smaller than for the IKONOS image. However, it is not reliable to make accurate comparisons of the magnitude of the problem of shadow projections on the basis of the visual observation of the images in because there are no suitable references (i.e., objects with the same dimensions). Because of slight variations in latitude and in the time of acquisition of the images used in this study, variations in the solar position greatly depend on the capture date of each image.
Contour maps were used as sources for obtaining the DEMs for the subsequent generation of the SRMs with different scales to suit the spatial resolution of each image type used in the study and to correct image distortions.
A 1:5000-scale map with 5-m contour intervals was used for the DEM generation for the IKONOS images. For QuickBird, however, it was necessary to use a larger-scale map (1:2000) after verifying that the quality of the DEM shading was not adequate because of the perception of pixelization in the image. In both cases, the DEMs were obtained by rasterization of the contour maps for each image type. In all other cases (Landsat, SPOT and IRS), the digital terrain model DTM10 was directly provided and used. Each DTM10 consists of a mesh with points of elevation every 10 m that is derived from the 1:5000-scale base map.
Geometric correction was performed using the method of second-order rational functions (Shaker, Yan, and Easa Citation2010) adjusted from ground control points, and the respective DEM was used to correct the displacement caused by the terrain. The base map used to generate the DEMs was also used as a source for the capture of the control points in each case. The RE-50 European Datum (with Ellipsoid International Hayford 1924, Greenwich meridian) geodesic reference system and the UTM projection were used in all images and DEMs.
3.2. DEM shading
Each SRM was generated from the respective DEM with the correct solar position for the elimination of the pseudoscopic effect using the PCI-Geomatics software algorithm ANG (Angle of Incidence from Elevation). This algorithm allows one to define a position of artificial lighting and a surface (DEM) to generate a new image or model in which the pixel values represent the angle of incidence of the light source on the surface.
Representation of the relief shading is dependent on the specification of different parameters, such as the size of the output pixels in the SRM, the azimuth and elevation angles of the light source and the distance to the surface, which in this case is one astronomical unit or the value of the Sun–Earth distance that is about 150 million kilometres (Iqbal Citation1983). Assuming that a line connecting the point source to the northwest, corresponding to the upper left pixel of the image is drawn, the azimuth angle, 315°, is the azimuth of this line in degrees measured clockwise from the north (top of the image). The elevation angle or incidence angle is the elevation of the line measured in degrees from the horizontal.
The shaded grey level at a point is calculated as the cosine of the angle between the normal vector to the surface (i.e., slope and aspect) and the direction of illumination scaled to the range 0–255. The values for all surfaces that are not illuminated by the light source (i.e., at angles greater than 90° or with a negative cosine) are set to 0. The algorithm is described in PCI-Geomatics (Citation2003).
The corrected position of the light source has an azimuth of 315° (from the NW) and a local incidence angle that is defined according to the relief of the area. In relatively flat areas, a local incidence angle of 45° or greater allows one to project more shadows on the model such that the visualization of terrain details can be improved. In mountainous areas, however, low solar elevation causes too many shadows appear, which leads to difficulties in the interpretation of the SRM. In this type of rough terrain, by increasing the local incidence angle, it is possible to achieve the illumination of details in the shaded slopes that would otherwise be hardly perceptible, as observed in . Care must be taken, however, with the use of too-high illumination angles because this may cause the terrain flattening effect. Therefore, it was decided to generate the SRM with different values of solar elevation, depending on the particular characteristics of the field in the different images used. Thus, for example, for the QuickBird image, which is the one that has the least altimetric variation, the SRM used had a solar incidence angle of 45°, whereas for the remainder of the images, an angle of 60° was used.
Figure 5. Example of a shaded DEM with solar incidence angles of (a) 45° and (b) 75°.
As the final result of the application of this algorithm, the respective SRM is obtained. The greyscale visualization of the resulting SRM provides an immediate identification of the areas that are less and more brightened (represented as black and white, respectively) by the light source.
demonstrates that the SRM for the coastal area of the QuickBird image with illumination from NW allows one to correctly perceive the surface of the ground at a glance by eliminating the pseudoscopic effect. The shading exposes three-dimensional spatial relationships in the morphology of the terrain that are impossible to perceive in the DEM.
Figure 6. DEM (a) and SRM with NW illumination (b) of the QuickBird image.
3.3. Image and SRM overlapping
Most programs related to the processing and analysis of images in remote sensing and GIS manage information as layer channels. In this type of software, the user can freely show or hide each layer of graphic information and modify the positions of the layers in relation to each other to achieve the desired manner of display of the final map. The upper layers ‘cover’ the lower ones such that to make the lower levels visible, it is necessary to disable the upper layers or to apply a certain degree of transparency. One can take advantage of these options for the correction of inverted perception in satellite imaging, thereby using them to provide an adequate visualization of the field. By overlaying a semi-transparent SRM with lighting from the NW on the satellite image, it is possible to compensate for the lighting of the original image. Therefore, the test to set the suitable opacity level is performed using the application allowing transparencies, in our case PCI-Geomatics®. If the SRM is placed over the image with 100% of opacity, the layer beneath cannot be seen. When reducing this setting, the satellite image progressively gains relevance and the visualization of the ortho-image can be seen with the addition of the impression of relief. The proper balance of the opacity level is checked with all images employed. In this manner, the shaded slopes that appeared in the image are apparently lit by the SRM, whereas the illuminated hillsides of the image are darkened after the overlap of the SRM. This method allows, therefore, simulation of the effect of inversion of Sun position in the image and, by extension, the inversion of the perception of landforms.
4. Results and discussion
On the basis of the tests performed, it was decided to use SRMs with different degrees of transparency depending on the type of image. For the P images, a SRM with 50% opacity provided satisfactory results in visual quality of the perception of relief ( and ). In contrast, in XS imagery, working with a greyscale SRM made it necessary to reduce the opacity to 30% such that it did not interfere with the aspect of the radiometric image too greatly; otherwise, the image lost sharpness and saturation (). The fused images, which have greater spatial resolution, are better able to overlap with the SRM without any loss of identification capability. However, the reduction in the degree of saturation advises against the use of an opacity level greater than 45% for this type of images ().
Figure 7. Original image (a) and FTPP-corrected image (b) of SPOT P.
Figure 8. Original image (a) of the SRM merged with the QuickBird P image (b) and with a fusion of the QuickBird P and XS images (c).
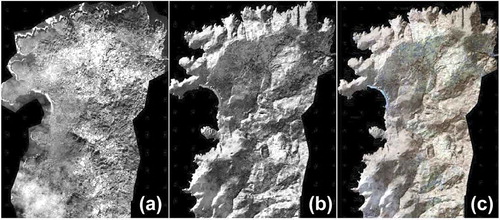
Figure 9. Original (a) and FTPP-corrected (b) colour composites for Landsat TM XS.
summarizes the main features of the shading models used for the correction of FTPP in each image.
Table 3. Primary parameters of SRM generation.
Opacity level percentages have been proposed on the basis of subjective visual analysis of the observer and generalized to the different types of images used in this study to achieve the shaded relief for distinguishing depth information of the image for the correct three-dimensional perception and so as not to confuse the bottom of a valley with the top of a mountain and vice versa. However, the degree of opacity to apply in each case can be adapted for each image, terrain, observer and particular application to achieve the desired level of perception. The appropriate balance between the mitigation of the pseudoscopic effect and the correct interpretation of the image may vary depending on those factors; therefore, the proposed values should be interpreted as indicative. Anyway, general rules have been derived for opacity-level selection with respect to the type of image and terrain roughness: the level of correction depends primarily of the acquisition mode of the image and whether the image is fused; therefore, the values of opacity can be fixed to 50% with P images and should be reduced to 45% in the case of fused images and to 30% in the cases of XS compositions so as not to de-saturate the colour especially in images with low spatial resolution. When the ground is jagged, the suitable local incidence angle to generate the SRM is 60°, but for almost-flat terrain, this value should be reduced to 45° so as to stand out terrain relief.
The existence of man-made objects is not relevant for opacity-level selection regarding relief perception, but a high opacity level can make land cover interpretation difficult. It is necessary to choose whether to outline the relief or the image texture and get the appropriate balance in each application.
The level of detail or spatial resolution of the SRM directly influences the final product; thus, it must be in accordance with the spatial resolution of the image. A low-resolution SRM causes the appearance of pixelization in the image, which degrades the image’s visual quality.
In and , the method also allows one to identify the terrain details that would be impossible to distinguish without SRM because of the already-discussed factors.
In some of the images of the study, the pseudoscopic effect is not noticeable except in specific areas because the terrain in the images is flat. In addition, certain items that appear in the images, such as clouds () or different types of land cover (), can also make interpretation of the relief difficult in itself. Even in these cases, it has been suggested that the implementation of this method makes interpretation of the landforms easier.
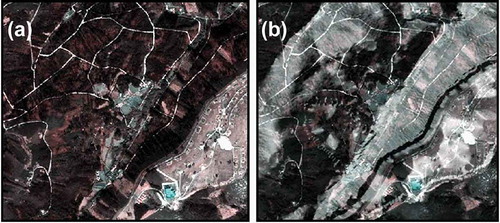
Figure 10. Original image (a) and FTPP-corrected image (b) of QuickBird XS.
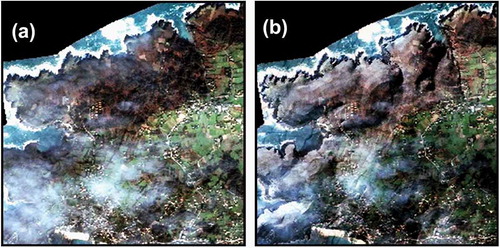
Figure 11. Original image (a) and FTPP-corrected image (b) of IKONOS XS.
The images that result from the described process have cartographic validity because they already have been orthorectified and have northern orientation. They are also suitable for photographic interpretation of the relief. Unlike with other methods that merge the image with the SRM, with the method proposed in this work, the initial radiometric characteristics are not altered. Thus, the method proposed here allows subsequent uses, such as image classification, because the image is not affected by the application of this procedure.
5. Conclusions
A correction method that uses layers with a true shading relief (SRM) with an opacity percentage over the satellite image layer has been demonstrated to be valid for multi-platform satellite imagery and images with different acquisition modes in which the pseudoscopic effect or FTPP appear.
An altimetric model that corresponds to the area of the image and the use of processing tools available in software packages are sufficient for the application of this method, which makes it a simple and fast method for mitigation of the pseudoscopic effect.
The opacity percentage of the SRM-overlapped layer at least partially mitigates the inverse relief perception. Use of the greyscale SRM with P images produces satisfactory results in terms of the appearance of the resulting image. In XS imagery or in fused images, significant visual quality is lost because of the reduction of the saturation, which is caused by the use of the greyscale SRM, and loss of sharpness, especially in images with low spatial resolution. Different opacity percentages for each image type have been proposed based on the subjective opinion of the interpreter. Factors related to the date of capture of the image or the image type have not proved sufficient to determine the level of opacity or the local incidence angle to apply in the correction. The level of correction depends primarily on the acquisition mode of the image and whether the image is fused; therefore, the values of opacity have been fixed to 50%, 30% and 45%, respectively, for the P, XS and fused images. These percentages can be considered as guide values and can be adapted and modified to enhance the terrain morphology for specific applications. The choice of the local incidence angle is determined by the roughness of the terrain in the image. For almost-flat terrain, it is desirable to reduce the angle to 45° to enable one to distinguish details, whereas in more rugged areas, it is advisable to increase the value to 60° with the objective of ensuring that excess shadows are not generated.
This procedure has been demonstrated to be more necessary when the ground is more jagged. However, in images of almost-flat areas, in which the perception of FTPP and the real relief are not evident at all, the correction allows the photograph interpreter to identify ground details that would be impossible to perceive using either the image or the DEM alone.
In all cases, the proposed method was quite successful, especially with all P images used in the work () because for those data, the radiometry of the resulting visualization was less affected than with colour composition images.
The main limitations of the method are related firstly to the fact that the superimposed SRM may partially hide image texture and secondly to the fact that this SRM is only an approximation to the true shading. However, these problems are not relevant because the shaded channel is simply added to the true image as an overlapped layer that can be turned on or off. Thus, any misinformation will quickly be exposed when the viewer simply turns off the superimposed SRM. Furthermore, the original image remains without any radiometric treatment or modification, and the procedure only affects the visualization such that the images obtained continue to have their original radiometric characteristics.
Acknowledgement
We want to thank the Galician Territorial Information System (SITGA) for the images and the cartographic material provided for the realization of this work.
Notes
1. In some cases, the effect is also called the ‘terrain reversal effect’, ‘relief inversion effect’ or ‘false topographic perception phenomena (FTPP)’. This last term, which was proposed by Saraf et al. (Citation1996), is particularly widespread in the specialized literature concerning this topic in the remote sensing field.
2. Although the effect is not exclusively a problem for the Northern Hemisphere, it has been verified that in this hemisphere, and particularly at latitudes higher than +23.5° N, the problem is compounded because at those latitudes, the pseudoscopic perception always appears regardless of the date of image capture. Moreover, at high latitudes, the solar elevation angles are smaller, thereby causing more projection of shadows on the ground (Saraf et al. Citation2011; Wu, Li, and Gao Citation2013).
References
- Bernabé, M. A., M. A. Manso, and D. Ballari. 2005. “Correction of Relief Inversion in Images Served by a Web Map Server.” International Cartographic Conference (ICC 2005), A Coruña, Spain, July.
- Bernabé, M. A., I. Sánchez, and A. Çöltekin. 2011. “Techniques for Highlighting Relief on Orthoimagery.” Vol. 21 of International Conference: Spatial Thinking and Geographic Information Sciences, Procedia - Social and Behavioral Sciences, 346–352. doi:10.1016/j.sbspro.2011.07.028.
- Bernabe-Poveda, M., and A. Coltekin. 2014. “Prevalence of the Terrain Reversal Effect in Satellite Imagery.” International Journal of Digital Earth. doi:10.1080/17538947.2014.942714.
- Gil, M., J. Armesto, and I. Cañas. 2005. “3-D Expression of Relief in Landsat Thematic Mapper and SPOT P Image.” Optical Engineering 44 (4): 047003-1-5. doi:10.1117/1.1883699.
- Gil, M., J. Ortiz, T. Rego, and L. Gelpi. 2010. “The Correction of the Pseudoscopic Effect on Quickbird Satellite Imagery.” Survey Review 42 (318): 318–326. doi:10.1179/003962610X12747001420465.
- Hayashi, T., C. Umeda, and N. Cook. 2007. “An Fmri Study of the Reverse Perspective Illusion.” Brain Research 1163: 72–78. doi:10.1016/j.brainres.2007.05.073.
- Iqbal, M. 1983. “Sun-Earth Astronomical Relationships.” In An Introduction to Solar Radiation, 1–28. Toronto, ON: Academic Press.
- Liu, B., and J. Todd. 2004. “Perceptual Biases in the Interpretation of 3D Shape from Shading.” Vision Research 44 (18): 2135–2145. doi:10.1016/j.visres.2004.03.024.
- Metzger, W. 2006. Laws of Seeing, 194. Cambridge, MA: MIT Press.
- Morgenstern, Y., F. Murray, and L. Harris. 2011. “The Human Visual System’s Assumption that Light Comes from above Is Weak.” Proceedings of the National Academy of Science. U.S.A. 108: 12551–12553. doi:10.1073/pnas.1100794108.
- Okoshi, T. 1976. Three-Dimensional Imaging Techniques, 403. New York: Academic Press.
- Paine, D. P., and J. D. Kiser. 2012. Aerial Photography and Image Interpretation, 648. Hoboken, NJ: John Wiley & Sons.
- Patterson, T. (2001). “See the Light: How to Make Illuminated Shaded Relief in Photoshop 6.0.” Online Tutorial. Accessed November 21, 2013. http://www.shadedrelief.com/retro/discussion.html
- PCI-Geomatics. 2003. Geomatica Focus Version 9.0, User´s Guide, 288. Richmond Hill, ON: PCI Geomatics Enterprises.
- Rock, I. 1984. La Percepción. Barcelona: Española Prensa Científica. Scientific American Books Cap 3 76.
- Saraf, A. K., J. D. Das, B. Agarwal, and R. M. Sundaram. 1996. “False Topography Perception Phenomena and Its Correction.” International Journal of Remote Sensing 17: 3725–3733. doi:10.1080/01431169608949180.
- Saraf, A. K., P. Ghosh, B. Sarma, and S. Choudhury. 2005. “Cover: Development of a New Image Correction Technique to Remove False Topographic Perception Phenomena.” International Journal of Remote Sensing 26 (8): 1523–1529. doi:10.1080/0143116031000101648.
- Saraf, A. K., S. T. Sinha, P. Ghosh, and S. Choudhury. 2007. “A New Technique to Remove False Topographic Perception Phenomenon and Its Impacts in Image Interpretation.” International Journal of Remote Sensing 28 (5): 811–821. doi:10.1080/01431160701269796.
- Saraf, A. K., M. Zia, J. Das, K. Sharma, and V. Rawat. 2011. “False Topographic Perception Phenomena Observed with the Satellite Images of Moon’s Surface.” International Journal of Remote Sensing 32 (24): 9869–9877. doi:10.1080/01431161.2010.550950.
- Shaker, A., W. Y. Yan, and S. Easa. 2010. “Using Stereo Satellite Imagery for Topographic and Transportation Applications: An Accuracy Assessment.” GIScience & Remote Sensing 47 (3): 321–337. doi:10.2747/1548-1603.47.3.321.
- Teittinen, M. 1993. Depth Cues in the Human Visual System. Chap. 3 in The Encyclopedia of Virtual Environments. Seattle: University of Washington. Accessed March, 2014. http://www.hitl.washington.edu/scivw/EVE/
- Toutin, T. 1997. “Qualitative Aspects of Chromo-Stereoscopy for Depth Perception.” Photogramm Engineering Remote Sensing 2 (63): 193–203.
- Wu, B., H. Li, and Y. Gao. 2013. “Investigation and Remediation of False Topographic Perception Phenomena Observed on Chang’e-1 Lunar Imagery.” Planetary and Space Science 75: 158–166. doi:10.1016/j.pss.2012.10.018.