
Abstract
Thwaites Ice Shelf in the Amundsen Sea is one of the biggest ice shelves in West Antarctica and is well known for significant mass changes. In the shear zone between Thwaites Glacier Tongue and its eastern ice shelf, shear stress forced by different flow rates of the ice shelves is causing the ice to break apart. A time series analysis of remote sensing data obtained by Landsat 7 Enhanced Thematic Mapper Plus (ETM+), TerraSAR-X, and airborne synthetic aperture radar (SAR) revealed that the shear zone has extended since 2006 and eventually disintegrated in 2008. We quantified the acceleration of Thwaites Ice Shelf with time by using the feature tracking method. The buttressing loss induced by the extension of the shear zone and progressive disintegration accelerated the flow of Thwaites Glacier Tongue, which in turn increased the shear stress on its eastern ice shelf. We determine causes of disintegration in the newly formed shear zone to be oceanic basal melting and structural weakening induced by Circumpolar Deep Water intrusion beneath the eastern ice shelf since 2000. The structural weakening was examined by using the density distribution of rifts and crevasses on the ice shelf, which were well identified from high-resolution SAR and optical satellite images.
Introduction
It is well known that ice shelves are vulnerable and undergo thinning in response to environmental changes such as atmospheric and oceanic warming (Joughin and Alley Citation2011; Padman et al. Citation2012). Although it is clear that both atmospheric and oceanic warming are major factors of the thinning and collapse of the ice shelves in Antarctica, it is difficult to identify the dominant forcing factor. Thus far, the main cause of the collapses of several ice shelves such as Larsen-A, -B, and -C and Wilkins Ice Shelves in the Antarctic Peninsula has been reported to be surface melting from atmospheric warming because these events occurred when surface melting and the cumulative amount of meltwater were at maximum levels (Doake and Vaughan Citation1991; Scambos et al. Citation2004; van den Broeke Citation2005; McGrath et al. Citation2012b). Furthermore, McGrath et al. (Citation2012a, Citation2012b) and Luckman et al. (Citation2011) suggested that basal crevasses under the ice shelves formed by oceanic melting can amplify the process of thinning and collapse in the following ways. First, the surface topography of an ice shelf above a basal crevasse can be depressed to maintain hydrostatic equilibrium. Second, small surface crevasses are formed on the ridges between the depressed surfaces due to the bending stress generated in the structure of the surface depression. These processes can also cause thinning and structural weakening of the ice shelf, contributing to the process of catastrophic collapse. Vaughan et al. (Citation2012) and Bindschadler, Vaughan, and Vornberger (Citation2011) discovered evidence that this process is occurring on the Pine Island Ice Shelf on the Amundsen Sea.
Thinning of the ice shelves on the Amundsen Sea, including Pine Island and Thwaites Ice Shelves, has been up to 7 m/year (Pritchard et al. Citation2012). Although this melting rate is significantly higher than that of the AP ice shelves (up to 0.3 m/year), rapid collapse events of ice shelves, such as that occurring in the AP, has not been reported thus far likely because of the relatively weak surface melting process of those on the Amundsen Sea. Many studies have shown that this thinning has been caused by strong basal melting induced by Modified Circumpolar Deep Water (MCDW), which is relatively warm and saline ocean water of higher than 1°C and 34.5 psu (Jacobs et al. Citation2011; Pritchard et al. Citation2012). Furthermore, several authors (Vaughan et al. Citation2012; MacGregor et al. Citation2012) suggested that strong uneven basal melting beneath the ice shelves can cause an increase in the fracturing and weakening of the ice shelves, which eventually leads to their disintegration. Such authors have reported that this process is gradually occurring around Thwaites Ice Shelf.
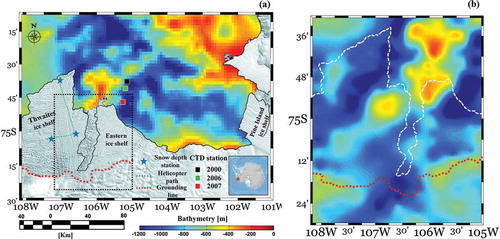
Thwaites Ice Shelf can be divided into two distinct ice shelves around its grounding line: Thwaites Glacier Tongue and its eastern ice shelf (Tinto and Bell Citation2011; MacGregor et al. Citation2012; ). The terminus of the eastern ice shelf is pinned by the bottom ridge (), which decelerates the flow beneath the ice shelf (Tinto and Bell Citation2011). This deceleration has induced a shear zone between Thwaites Glacier Tongue and its eastern ice shelf in which the ice is disintegrating. MacGregor et al. (Citation2012) showed that this shear zone is currently extending. They suggested that the rifting, disintegration, and extension of the shear zone are associated with a structural weakening of the ice shelves due to the aforementioned oceanic melting process. However, a lack of field observations has made it difficult to verify such suggestions. Field work in Antarctica is a very demanding and difficult task due to severe weather conditions and dangerous surface crevasses. As such, direct evidence of acceleration and disintegration of Thwaites Glacier Tongue from the eastern ice shelf has not been reported thus far.
Figure 1. a. Moderate Resolution Imaging Spectroradiometer composite image of the study area and in situ survey and bottom topography in the Amundsen Sea coast, West Antarctica. b. Detailed bathymetry beneath Thwaites and its eastern Ice Shelves.
In the present study, we analyze airborne and space-borne remote sensing data to explain the mechanism of the Thwaites Ice Shelf separation and acceleration that have occurred since 2008. Moreover, we quantify the flow velocity changes associated with the disintegration and acceleration of Thwaites Ice Shelf and identify the factors of structural weakening caused by oceanic melting.
Data and methods
We collected a number of satellite data including Landsat 7 Enhanced Thematic Mapper Plus (ETM+), GeoEye-1, and TerraSAR-X capturing Thwaites Ice Shelf (). In order to estimate the flow velocity of the ice shelf, we applied a feature tracking method using a total of 12 Landsat 7 ETM+ images from the years 2000 to 2012. These images were geo-rectified within one pixel accuracy (). Features were selected visually based on distinctness and the distribution of crevasses, and/or fractures, between image pairs. The travel distance (offset) of selected features (patches of 1024 by 1024 pixels) was calculated using cross-correlation method (for the regions that do not include scan line corrector (SLC) off) or visual interpretation (for the regions that include SLC-off and have many rotated features) between image pairs, and then converted to displacement in kilometers per year using the acquisition time of each image (Rabiner and Gold Citation1975; Ramsey et al. Citation2006; Huang and Li Citation2011; Long et al. Citation2013). Identification of rifts and crevasses on Thwaites Glacier Tongue and its eastern ice shelf was conducted by analyzing Landsat 7 ETM+ Band 8 (15-m resolution) and GeoEye-1 panchromatic data (0.5-m resolution). In addition, a helicopter (Model AS350) airborne synthetic aperture radar (SAR) survey was conducted by using NanoSAR system to interpret the feasibility of detecting hidden crevasses. NanoSAR system is a compact SAR system developed by ImSAR Corporation and is optimized to detect small-sized objects. Indeed, Kim et al. (Citation2013) successfully mapped small melt ponds of less than 130 m2 on summer sea ice in the Arctic Ocean by using this system. The center frequency of the system is 10.25 GHz (X-band), and the resolution capability is flexible at 0.3, 0.5, 1 and 3 m. Global Positioning System/inertial measurement unit devices and a gimbal-mounted phased array antenna were used to compensate for the flight motion of the helicopter. In this experiment, we set the maximum resolution of 0.3 m at a flight altitude of 300 m. In addition, simultaneously we acquired aerial photography data by using a GoPro HD Hero camera. The green dotted line in shows the flight path of the helicopter.
Table 1. The specification of remote sensing data used in this study.
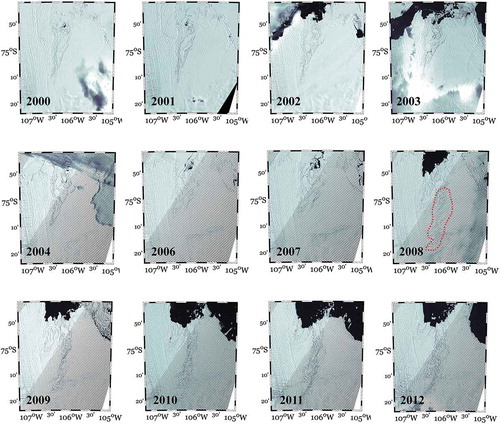
Figure 2. Landsat 7 ETM+ images from 2000 to 2012, shown by the black dotted box in . The hatched pattern is the result of the failure of the Scan Line Corrector (SLC) of Landsat in 2003, according to the statement from the United States Geological Survey.
Conductivity–temperature–depth (CTD) data collected from an area near the eastern ice shelf was also collected to determine the potential for structural weakening of the ice shelf by oceanic melting (). The obtained ocean measurements were acquired during February-to-March cruises of RV NB Palmer in 2000, 2007 and those of RV Polarstern in 2006.
Results
The shear zone between Thwaites Glacier Tongue and its eastern ice shelf was originally located along the area of the most inward curve (blue line in ). However, the numerous rifts and cracks in this zone indicated a shift toward the eastern ice shelf beginning in 2006 that extended to the end of the ice shelf (). In 2008, these cracks showed a significant increase in density and linkage with each other. Since 2008, the newly formed cracks appear to have worked as a new shear zone between Thwaites Glacier Tongue and its eastern ice shelf in an obviously different location.
Figure 3. Spatial distribution of the shear and rift zones between Thwaites and its eastern ice shelf.
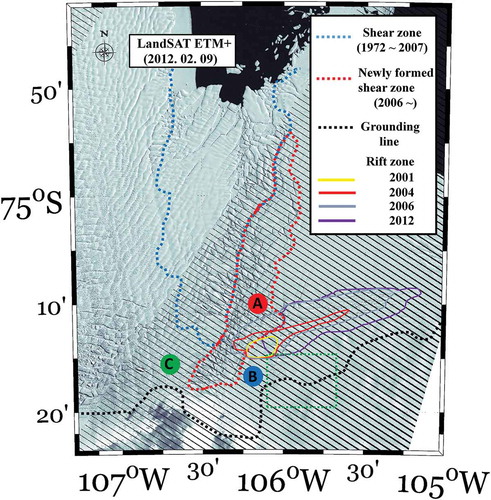
In addition to these changes, several rifts near the grounding line of the eastern ice shelf that appeared in 2001 gradually increased until 2004, followed by rapid extension in 2006 (yellow, red, and gray lines in ). In 2006, the area containing the rift zone reached up to 165 km2, which is approximately three times larger than the 50 km2 area recorded in 2004.
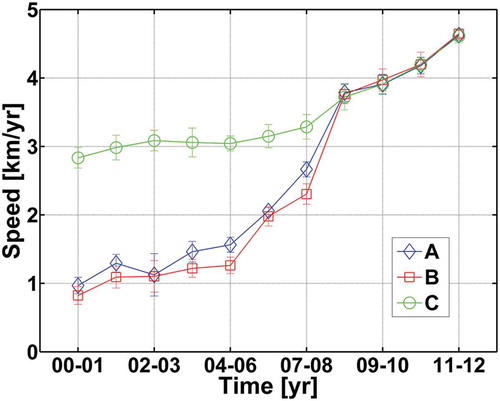
We quantitatively measured the flow velocity (speed and direction) changes of several sites on Thwaites Ice Shelf from Landsat images acquired in a time series (). We can clearly observe the overall changes of flow velocities after 2006. In particular, the flow directions near the shear zone were significantly changed to the direction of Thwaites Glacier Tongue since 2006. We further calculated the changes of flow speeds in three test sites, which are indicated as A, B, and C in . At each site, about six ground control points (GCPs) or features were selected for calculation of the flow speed. The mean ice flow speed of each site is plotted with time in . The error bars shown in represent the standard deviations of the estimated flow speeds at used GCPs and features in each site. According to this plot, the speeds at sites A and B, 1.3 and 1.1 km/year, respectively, were significantly slower than that of site C, 3.0 km/year until 2006. However, the speeds rapidly increased between 2006 and 2008 and eventually reached the speed at site C. These changes indicate that sites A and B were originally located on the eastern ice shelf before 2006. However, the boundary between Thwaites Glacier Tongue and its eastern ice shelf moved eastward between 2006 and 2008 to eventually include all sites (A, B, and C) as part of Thwaites Glacier Tongue. One of the interesting changes was that the speed at site C has also increased since 2006. It is believed that the eastern ice shelf has been restrained by the offshore ridge shallow topography in front of the eastern ice shelf (Tinto and Bell Citation2011) and that the buttressing force (cohesive force) between the ice tongue and the ice shelf restricted Thwaites Glacier Tongue to a constant flow until 2006. However, the increasing flow speed of Thwaites Glacier Tongue (site C) since 2006 implies that the buttressing force between these two ice masses was weakened. The same flow velocities at the three sites (A, B, and C) recorded since 2008 indicate that the newly formed shear zone had disintegrated. If the shear zone was still working as an elastic shear medium, the flow velocities should have varied according to the location’s distance from the boundary.
Figure 4. Variations of ice flow velocities at various locations on Thwaites Ice Shelf derived from multi-temporal Landsat images acquired from 2000 to 2012, except 2005.
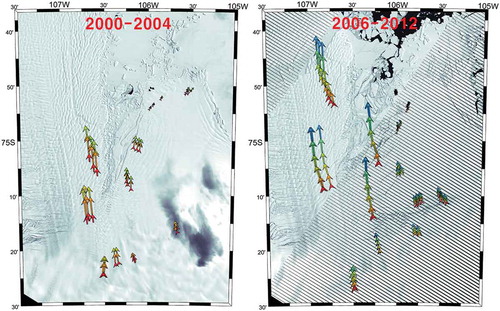
Figure 5. Mean ice flow speeds estimated from time series of Landsat data (from 2000 to 2012, except 2005) at three sites (A, B, and C) shown in .
Discussion
The results derived from the time series Landsat images indicate that the rapid velocity changes at sites A and B were induced by the loss of buttressing beginning in 2006 due to the structural weakening of the newly formed shear zone. Moreover, we conclude that the same ice flow velocities at sites A, B, and C since 2008 were caused by disintegration of the shear zone, which resulted in the acceleration of Thwaites Glacier Tongue.
Several factors may have caused the structural weakening of the ice shelf. As a major oceanic contributor, in this study, we consider the MCDW entering the deep inner continental shelf basins through bathymetric troughs (Wåhlin et al. Citation2010; Arneborg et al. Citation2012; Ha et al. Citation2014). The changes in temperature and thickness of the MCDW significantly influence the thinning and recession of Thwaites Ice Shelf. Jacobs et al. (Citation2011, Citation2013) showed that the thermocline between the cold surface and relatively warmer deep waters (i.e., MCDW) in front of Pine Island and Getz Ice Shelves in the Amundsen Sea, which, respectively, lie on eastern and western sides of Thwaites Ice Shelf, was approximately 200 m shallower in 2007 than that in 2000. These changes could provide the oceanic heat to the base of ice shelf, resulting in the strong basal melting around the grounding line. The historical CTD data collected in front of the eastern ice shelf by Carbotte et al. (Citation2007) and Jacobs (Citation2010) also showed that the thermocline depths in 2006 and 2007 were approximately 200 m shallower than that in 2000; these results are similar to those of Jacobs et al. (Citation2011), Citation2013; ). Therefore, it is possible that the base of the eastern ice shelf near the grounding line was melted by the MCDW. In such a case, the heat intrusion by the MCDW increase could have caused structural weakening of the ice shelf.
Figure 6. Profiles of conductivity–temperature–depth (CTD) data shown in . The solid and dashed lines indicate observed temperature–freezing temperature (T–Tf) and observed salinity, respectively.
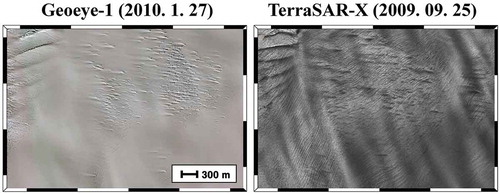
We then attempted to determine the amount of heat intrusion from the ocean necessary to cause the ice melt. Although it is difficult to determine a quantitative answer, it is clear that the required thermal energy is directly proportional to the hardness of the ice. The rift zones near the ground line and the numerous cracks in the newly formed shear zone in the eastern ice shelf in some ways appeared suddenly in 2006. We believe that the amount of oceanic heat flow was insufficient to induce such weakening and disintegration of Thwaites Ice Shelf. Therefore, we closely examined the many available SAR and optical satellite images. GeoEye-1 and TerraSAR-X images acquired on 27 January 2010, and 25 September 2009, respectively, showed densely distributed surface crevasses near the grounding line of the eastern ice shelf (green rectangle in ). As shown in , most crevasses exhibited transverse patterns. Such crevasse patterns are usually formed by varying rates of ice movement (MacGregor et al. Citation2012). It is therefore likely that the shear stress forced by the different flow rates between Thwaites Glacier Tongue and its eastern ice shelf has caused these crevasse patterns. Furthermore, the existence of hidden crevasses was distinctly recognized by a comparison of GeoEye-1 and TerraSAR-X images (). The areal extent of these crevasses was approximately 75% in the TerraSAR-X image; only 15% was observed in the GeoEye-1 image. These results clearly indicate that the eastern ice shelf near the ground line was significantly weaker than it appeared to be. Thus, such an amount of oceanic heat would have caused structural weakening of the ice shelf and eventually disintegration in the newly formed shear zone. We believe that these processes could have been accelerated (positive feedback) because the Thwaites Glacier Tongue disintegration from the eastern ice shelf could have increased its flow velocity, which then could have increased the shear stress forcing to the eastern ice shelf near the ground line in addition to the crevasse density.
Figure 7. Comparisons of crevasse patterns in TerraSAR-X and GeoEye-1 images captured on 25 September 2009, and 27 January 2010, respectively, shown by the green dotted box in .
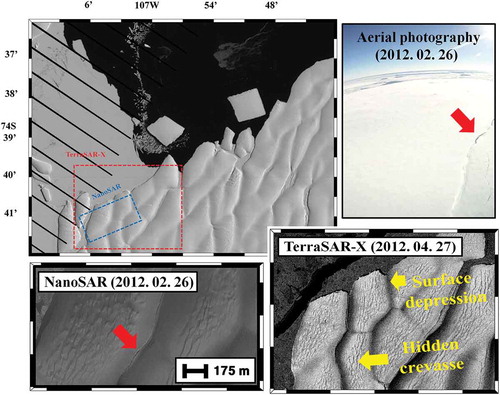
Hidden crevasses were also detected on Thwaites Glacier Tongue. The Landsat 7 ETM+ image acquired on 31 January 2009, shows surface crevasses located south of the grounding line (). Some parts of these crevasses were moved to a new location by 9 February 2012, represented, respectively, by the red and blue rectangles in , and the signatures of their patterns were diminished. The aerial photography captured from the helicopter-borne survey during a similar period on 26 February 2012, clearly shows that snow cover created a dimming of these crevasses in the optical images; the black circles in both Landsat 7 ETM+ and aerial photography indicate the same region. However, in the TerraSAR-X image captured on 3 March 2012, just a few days after the aerial photography was obtained, the signatures of the crevasses were more distinct and were similar to the original pattern located south of the grounding line; yellow arrows in the image indicate the same crevasses. These results demonstrate that SAR is a useful tool for mapping hidden crevasses. We also acquired a TerraSAR-X image on 27 April 2012, and a NanoSAR image on 26 February 2012, of the terminus of Thwaites Glacier Tongue, which are, respectively, represented by red and blue rectangles in . The area was fully covered with snow, as shown in the aerial photography in . In addition, several surface depressions >100 m in width and fractures were noted, as indicated by red arrows in the figure. All images effectively showed the surface depressions. In particular, the TerraSAR-X and NanoSAR images clearly showed the distribution of the hidden crevasses (<30 m in width); the Landsat 7 ETM+ image did not. The reason for the detection of hidden crevasses from TerraSAR-X and NanoSAR is thought to be the snow penetration capability of microwave signals when the snow is dry (the average temperature of the study area during Antarctic summer season is about −15°C). The prevalence of hidden crevasses on Thwaites Glacier Tongue (or after being iceberg) implies structural weakening of the ice mass. Such weakening could have caused a catastrophic collapse if external forces such as MCDW upwelling or atmospheric warming were applied.
Figure 8. Comparisons of crevasse patterns in Landsat 7 ETM+, aerial photography, and spaceborne SAR images near the grounding line of Thwaites Ice Shelf.
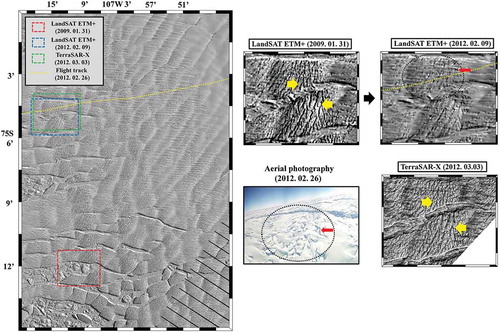
Figure 9. Comparisons of crevasse patterns in Landsat 7 ETM+, aerial photography, airborne, and spaceborne SAR images of Thwaites Ice Shelf terminus.
Conclusion
Structural weakening of ice shelves in Antarctica, including the loss of integrity due to fracturing and thinning, has been forced by strong atmospheric or oceanic melting processes (Scambos et al. Citation2004; McGrath et al. Citation2012b). Recent studies (Vaughan et al. Citation2012; MacGregor et al. Citation2012) suggest that the oceanic melting process in the Amundsen Sea, West Antarctica, is more predominant than that by the atmosphere. Thus, structural weakening and disintegration of the ice shelves in the Amundsen Sea have been gradually spreading with the recent increased delivery of warmer ocean water beneath the ice shelves. In addition, these studies suggest that the structural weakening and disintegration have the potential to cause unexpected acceleration of the ice shelves.
Our analysis of space-borne and airborne optical and SAR data have revealed numerous small surface crevasses near the grounding line of Thwaites Glacier Tongue and its eastern ice shelf. In particular, the SAR data uncovered previously unrecognizable surface crevasses that had been buried by snow. These results suggest that additional surface crevasses than those expected have formed in the vicinity of the grounding line of the eastern ice shelf, which could have resulted in the structural weakening of the ice shelf. That is, pre-existing exposed and hidden surface crevasses near the grounding line may have reduced the overall integrity of the eastern ice shelf. Furthermore, strong basal melting beneath the eastern ice shelf appeared to have been intensified by the amplification of MCDW intrusion since 2000. Therefore, the strong oceanic basal melting may have amplified the structural weakening of the eastern ice shelf by producing additional basal and surface crevasses. Owing to this process, the formation of a new shear zone between Thwaites Glacier Tongue and its eastern ice shelf began in 2006, and the ice at this newly formed shear zone began to disintegrate in 2008. Furthermore, it is evident that the flow of Thwaites Glacier Tongue has been rapidly accelerated due to the buttressing loss induced by disintegration and the increase in flow velocity since 2008.
Disclosure statement
No potential conflict of interest was reported by the authors.
Acknowledgment
The authors would like to thank Araon crews and captain for providing technical supports during the survey (ANA02C). TerraSAR-X, optic satellite, and IceBridge data were kindly provided by the German Aerospace Center (DLR), the United States Geological Survey (USGS), and National Snow and Ice Data Center (NSIDC), respectively.
Additional information
Funding
References
- Arneborg, L., A. K. Wåhlin, G. Björk, B. Liljebladh, and A. H. Orsi. 2012. “Persistent Inflow of Warm Water onto the Central Amundsen Shelf.” Nature Geoscience 5: 876−880.
- Bindschadler, R. A., D. G. Vaughan, and P. Vornberger. 2011. “Variability of Basal Melt beneath the Pine Island Glacier Ice Shelf, West Antarctica.” Journal of Glaciology 57: 581–595. doi:10.3189/002214311797409802.
- Carbotte, S. M., W. B. F. Ryan, S. O’Hara, R. Arko, A. Goodwillie, A. Melkonian, R. A. Weissel, and V. L. Ferrini. 2007. “Antarctic Multibeam Bathymetry and Geophysical Data Synthesis: An On-Line Digital Data Resource for Marine Geoscience Research in the Southern Ocean.” U.S. Geological Survey Open-File Report, 2007-1047. doi:10.3133/of2007-1047.srp002.
- Cuffey, K. M., and W. S. B. Paterson. 2010. The Physics of Glaciers. 4th ed. Amsterdam: Elsevier.
- Doake, C. S. M., and D. G. Vaughan. 1991. “Rapid Disintegration of the Wordie Ice Shelf in Response to Atmospheric Warming.” Nature 350: 328–330. doi:10.1038/350328a0.
- Ha, H. K., A. K. Wåhlin, T. W. Kim, S. H. Lee, J. H. Lee, H. J. Lee, C. S. Hong, L. Arneborg, G. Björk, and O. Kalén. 2014. “Circulation and Modification of Warm Deep Water on the Central Amundsen Shelf.” Journal of Physical Oceanography 44 (5): 1493–1501. doi:10.1175/JPO-D-13-0240.1.
- Huang, L., and Z. Li. 2011. “Comparison of SAR and Optical Data in Deriving Glacier Velocity with Feature Tracking.” International Journal of Remote Sensing 32 (10): 2681–2698. doi:10.1080/01431161003720395.
- Jacobs, S. S. 2010. “Physical Oceanography during POLSARSTERN Cruise ANT-XXIII/4.” New York: Lamoznt-Doherty Earth Observatory of Columbia University. doi:10.1594/PANGAEA.735610.
- Jacobs, S. S., C. Giulivi, P. Dutrieux, E. Rignot, F. Nitsche, and J. Mouginot. 2013. “Getz Ice Shelf Melting Response to Changes in Ocean Forcing.” Journal of Geophysical Research 118: 4152–4168.
- Jacobs, S. S., A. Jenkins, C. F. Giulivi, and P. Dutrieux. 2011. “Stronger Ocean Circulation and Increased Melting under Pine Island Glacier Ice Shelf.” Nature Geoscience 4: 519–523. doi:10.1038/ngeo1188.
- Joughin, I., and R. B. Alley. 2011. “Stability of the West Antarctic Ice Sheet in a Warming World.” Nature Geoscience 4: 506–513. doi:10.1038/ngeo1194.
- Kim, D.-J., B. J. Hwang, K. H. Chung, S. H. Lee, H.-S. Jung, and W. M. Moon. 2013. “Melt Pond Mapping with High-Resolution SAR: The First View.” Proceedings of the IEEE 101: 748–758. doi:10.1109/JPROC.2012.2226411.
- Long, J. A., R. L. Lawrence, M. C. Greenwood, L. Marshall, and P. R. Miller. 2013. “Object-Oriented Crop Classification Using Multitemporal ETM+ Scl-Off Imagery and Random Forest.” GIScience and Remote Sensing 50 (4): 418–436.
- Luckman, A., D. Jansen, B. Kulessa, E. C. King, P. Sammonds, and D. I. Benn. 2011. “Basal Crevasses in Larsen C Ice Shelf and Implications for Their Global Abundance.” The Cryosphere Discussions 5: 2035–2060. doi:10.5194/tcd-5-2035-2011.
- MacGregor, J. A., G. A. Catania, M. S. Markowski, and A. G. Andrews. 2012. “Widespread Rifting and Retreat of Ice-Shelf Margins in the Eastern Amundsen Sea Embayment between 1972 and 2011.” Journal of Glaciology 58: 458–466. doi:10.3189/2012JoG11J262.
- McGrath, D., K. Steffen, H. Rajaram, T. Scambos, W. Abdalati, and E. Rignot. 2012b. “Basal Crevasses on the Larsen C Ice Shelf, Antarctica: Implications for Meltwater Ponding and Hydrofracture.” Geophysical Research Letters 39: L16504. doi:10.1029/2012GL052413.
- McGrath, D., K. Steffen, T. Scambos, H. Rajaram, G. Casassa, and J. L. Rodriguez Lagos. 2012a. “Basal Crevasses and Associated Surface Crevassing on the Larsen C Ice Shelf, Antarctica, and Their Role in Ice-Shelf Instability.” Annals of Glaciology 53: 10–18. doi:10.3189/2012AoG60A005.
- Padman, L., D. P. Costa, M. S. Dinniman, H. A. Fricker, M. E. Goebel, L. A. Huckstadt, A. Humbert, et al. 2012. “Oceanic Controls on the Mass Balance of Wilkins Ice Shelf, Antarctica.” Journal of Geophysical Research 117. doi:10.1029/2011JC007301.
- Pritchard, H. D., S. R. M. Ligtenberg, H. A. Fricker, D. G. Vaughan, M. R. van den Broeke, and L. Padman. 2012. “Antarctic Ice-Sheet Loss Driven by Basal Melting of Ice Shelves.” Nature 484: 502–505. doi:10.1038/nature10968.
- Rabiner, L. R., and B. Gold. 1975. Theory and Application of Digital Signal Processing, 414–419. Englewood Cliffs, NJ: Prentice-Hall.
- Ramsey, E. III, Z. Lu, A. Rangoonwala, and R. Rykhus. 2006. “Multiple Baseline Radar Interferometry Applied to Coastal Land Cover Classification and Change Analyses.” GIScience & Remote Sensing 43 (4): 283–309. doi:10.2747/1548-1603.43.4.283.
- Scambos, T. A., J. A. Bohlander, C. A. Shuman, and P. Skvarca. 2004. “Glacier Acceleration and Thinning after Ice Shelf Collapse in the Larsen B Embayment, Antarctica.” Geophysical Research Letters 31: L18402. doi:10.1029/2004GL020670.
- Tinto, K. J., and R. E. Bell. 2011. “Progressive Unpinning of Thwaites Glacier from Newly Identified Offshore Ridge: Constraints from Aerogravity.” Geophysical Research Letters 38: L20503. doi:10.1029/2011GL049026.
- van den Broeke, M. R. 2005. “Strong Surface Melting Preceded Collapse of Antarctic Peninsula Ice Shelf.” Geophysical Research Letters 32: L12815. doi:10.1029/2005GL023247.
- Vaughan, D. G., H. F. J. Corr, R. A. Bindschadler, P. Dutrieux, G. H. Gudmundsson, A. Jenkins, T. Newman, P. Vornberger, and D. J. Wingham. 2012. “Subglacial Melt Channels and Fracture in the Floating Part of Pine Island Glacier, Antarctica.” Journal of Geophysical Research 117: F03012. doi:10.1029/2012JF002360.
- Wåhlin, A. K., X. Yuan, G. Björk, and C. Nohr. 2010. “Inflow of Warm Circumpolar Deep Water in the Central Amundsen Shelf.” Journal Physical Oceanogr 40: 1427–1434. doi:10.1175/2010JPO4431.1.