
 ?Mathematical formulae have been encoded as MathML and are displayed in this HTML version using MathJax in order to improve their display. Uncheck the box to turn MathJax off. This feature requires Javascript. Click on a formula to zoom.
Abstract
Accurate estimation of the land surface evapotranspiration (ET) over a heterogeneous ecosystem is important to understand the interaction between the land surface and the atmosphere with practical applications in integrated water resources management. Although numerous studies have been carried out to develop remote sensing technologies which could achieve more accurate prediction of the regional ET distributions, degrees of uncertainty remain due to the high spatiotemporal variability of the hydrometeorological parameters. A revised remote sensing-based Penman–Monteith algorithm under all sky conditions (Revised RS-PMallsky) is proposed in this study using the MODerate resolution Imaging Spectroradiometer (MODIS) (ETMODIS), and the model’s capability was assessed over the complex topography of the Korean peninsula. The ground measurements taken at two flux sites with different land cover types in 2012 were employed. The results of ETMODIS represented temporal compatibility yielding biases of −0.18 mm day−1 at Seolmacheon (SMC) site and −0.14 mm day−1 at Cheongmicheon Farmland (CFC) site and root mean square error (RMSE) values of 1.42 mm day−1 at SMC site and 1.26 mm day−1 at CFC site. Overall, ETMODIS was verified to have similar error ranges as those of the previous studies conducted over flat and heterogeneous regions. The results suggest that the revised RS-PM algorithms can be applied on a regional scale with heterogeneous topography over long-term periods if handling of the input data is carefully conducted.
1. Introduction
The terrestrial hydrological cycle is of crucial significance to building the frame of the Earth’s system processes (Mu, Zhao, and Running Citation2011). Evapotranspiration (ET) occurs as a result of interaction between the atmosphere and the land surface, whereby the amount of ET is primarily determined by the available energy, water, and atmospheric transport scheme (Batra et al. Citation2006; Yang et al. Citation2006; Ha, Gowda, and Howell Citation2011). The accurate estimation of ET is essential to understanding the terrestrial hydrological cycle (Brutsaert Citation1982).
ET is typically measured using ground-based instruments such as lysimeters, evaporation pans, or eddy covariance systems (Brutsaert Citation1982; Penman Citation1948; Twine et al. Citation2000). However, ground-based measurements have limited ability to provide representative values, because the densities of the measurement networks are always sparse (Allen et al. Citation1998; Sumner and Jacobs Citation2005). To compensate for such limitations, numerous studies have been carried out on the development of remote sensing-based ET models which can provide accurate spatial distributions of ET (Choi et al. Citation2009, Citation2011; Glenn et al. Citation2007; Hwang and Choi Citation2013; Jang et al. Citation2010, Citation2013; Kalma, McVicar, and McCabe Citation2008; Kim et al. Citation2012; Ryu et al. Citation2012).
The satellite-based ET approaches can be broadly classified into two types of algorithms: energy balance algorithms and Penman–Monteith algorithm (P–M) (Cleugh et al. Citation2007). ‘Energy balance algorithms’ have been developed in a number of previous studies (Allen, Tasumi, and Trezza Citation2007; Kustas and Norman Citation1997; Norman, Kustas, and Humes Citation1995; Roerink, Su, and Menenti Citation2000). The energy balance models compute the latent heat flux (LE) as a residual term by estimating the other energy fluxes, which include sensible heat flux (H), ground heat flux (G), and net radiation flux (RN). However, the energy balance models are difficult to apply because they depend on the quality of the ancillary in-situ measurements, and require too many input variables and complex procedures to allow computation of H (Li et al. Citation2009).
Contrary to the energy balance approach, the ‘P–M algorithm (Monteith Citation1965)’ has generally been considered more robust because they are not relatively dependent on any meteorological input parameters (Cleugh et al. Citation2007; Mu et al. Citation2007). Calculation of ET using the original P–M equation was often hindered by requirements for the aerodynamic resistance, including wind speed and surface roughness parameters, because these data-sets were not directly obtained through remote sensing data (Cleugh et al. Citation2007). Cleugh et al. (Citation2007) concluded that the remote sensing-based Penman–Monteith algorithm (RS-PM) was essentially superior to the resistance-land surface energy balance methods using MODerate resolution Imaging Spectroradiometer (MODIS) remote sensing data to provide regionally distributed ET information for evergreen forests and tropical savannas in Australia. Mu et al. (Citation2007) adapted Cleugh’s Penman-Monteith-based MODIS ET approach and improved calculation to canopy conductance using leaf area index (LAI) product and to vegetation cover fraction using enhanced vegetation index (EVI) product. They determined the canopy conductance using the vapor pressure deficit, minimum air temperature, and LAI, and then calculated the vegetation cover fraction using the EVI. The ET algorithm employed by Mu et al. (Citation2007) (hereafter called revised RS-PM) was also further improved to calculate ET (Mu, Zhao, and Running Citation2011), and the improved ET algorithm was validated for generating global ET data products, and for providing critical information on the global terrestrial water, energy cycles, and environmental changes. Jang et al. (Citation2010) performed the revised RS-PM algorithm using the 5th Generation Mesoscale Meteorological Model (MM5). The MODIS-derived meteorological and radiation variables for calculation of ET were identified through flux tower measurements in Northeast Asia.
However, the aforementioned revised RS-PM algorithm is restricted to use under clear sky conditions, as satellite sensors cannot measure cloud base parameters. To address this deficit, Bisht and Bras (Citation2010) proposed a new algorithm to calculate all components of the energy balance budgets under all sky conditions (i.e., clear and cloudy sky conditions) using the cloud parameters from the MODIS geolocation, cloud, aerosols, atmospheric, and land products at a regional scale in the US. Jang et al. (Citation2013) later used the MODIS-based ET algorithms under clear and partially cloudy conditions to conduct continuous daily ET estimates. While a large number of remote sensing-based ET studies have been presented under various climate conditions (dry condition at the US introduced in Allen, Tasumi, and Trezza Citation2007; Gowda et al. Citation2008; continental climate condition at China region in Li and Zhao Citation2010), few studies have estimated ET on the Korean peninsula using satellite data.
The present study analyzed the ET estimates from the revised RS-PM using remotely sensed data over the entire year of 2012 at a regional scale. We aimed to estimate the daily ET under all sky conditions using only the MODIS sensor data, to assess the utility and the capability of the remote sensing-based ET over the entire of South Korea through the validation with ground measurement data.
2. Study area and data-sets
2.1. Study area
The extent of the study area reached from 33° to 39° N in latitude and 124° to 131° E in longitude including the southern part of the Korean peninsula (). Dominant land cover types were heterogeneously distributed with mixed forests (40%), croplands (30%), deciduous broadleaf forests (14%), woody savannas (6%), and urban and built-up areas (5%). The west region of the study area was mostly composed of croplands while the central and east parts were covered with mixed and deciduous broadleaf forests.
Figure 1. Geographic location of the study area. For full color versions of the figures in this paper, please see the online version.
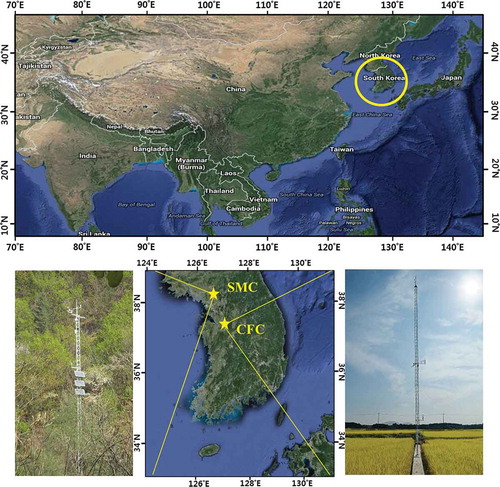
To validate the two ET approaches, two flux tower sites in South Korea were selected. The two flux tower sites, Seolmacheon (SMC) and Cheongmicheon Farmland (CFC), are located in the mid-western area of the Korean peninsula (). The CFC and SMC watersheds are administrated by the Hydrological Survey Center (HSC). The flux towers measured the surface-atmosphere exchange of carbon, water, and energy based on eddy covariance systems. The net radiation sensors (CNR2 Net Radiometer) measured both net short-wave radiation and net long-wave radiation at the heights of 19.2 m and 9.7 m above the surface at the CFC and SMC sites, respectively. For quality control of the measurement data obtained from the flux towers, the collected data were examined using theoretical and statistical tests (e.g., coordinate rotation, the control of ranges and spikes, and quality flagging) to check the reliability (Hong et al. Citation2009; Kwon et al. Citation2007). The flux tower and meteorological observation stations are shown in and the characteristics of each station are described in .
Table 1. Site descriptions.
2.2. MODIS data-sets
MODIS data-sets have been widely used for energy balance studies because they provide solid guidelines with spatiotemporally continuous information over the surface of the Earth (Tang and Li Citation2008). MODIS data from the Terra spacecraft (10:30 overpass) were used to estimate ET using equations. Among all existing MODIS products provided by the National Aeronautics and Space Administration, the atmospheric profile product, MOD07_L2 (Level 2 atmosphere product, hereafter called MOD07), which includes the air and dew point temperatures, was selected for this study. The spatial resolution of MOD07 is 5 km. It provides instantaneous geophysical variables with intermediate resolution, including latitude, longitude, air and dew-point temperature, surface pressure, total precipitable water vapor, solar zenith angle, and brightness temperature (Menzel et al. Citation2002; Seemann et al. Citation2003). Among the available data, the air temperature and dew-point temperature were employed in analysis. To calculate the radiation under cloudy sky condition, the MODIS cloud product (MOD06) was used. The cloud parameters employed from the MOD06 product include cloud top temperature, cloud fraction, cloud emissivity (5 km spatial resolution), and cloud optical thickness (1 km spatial resolution) (Bisht and Bras Citation2010).
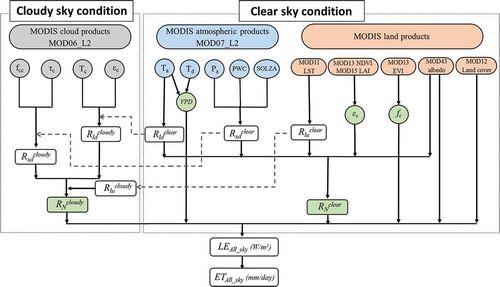
Instantaneous ET was estimated using the MODIS data of atmospheric, cloud, and land products, along with 5 km air and dew-point temperature, precipitable water content (PWC), solar zenith angle, air pressure (MOD07), cloud emissivity, cloud fraction, cloud top temperature (MOD06), 1 km cloud optical depth (MOD06), land surface temperature (MOD11), vegetation indices (NDVI and EVI) (MOD13), LAI (MOD15), and surface albedo (MOD43). The various MODIS products under all sky conditions, along with their spatial resolutions and parameters used, are described in . The sinusoidal model proposed by Bisht et al. (Citation2005) for calculation of the diurnal cycles of ET was adopted in this study. A detailed explanation of the sinusoidal model and its estimation of the hydrological parameters can be found in Bisht et al. (Citation2005) and Hwang and Choi (Citation2013).
Table 2. The MODIS data used in this study.
3. Methodology
3.1. ET algorithm using revised RS-PM under clear sky conditions
For estimation of the actual ET for clear sky pixels, the revised remote sensing-based Penman-Monteith algorithm (revised RS-PM) was employed, which is briefly presented here (Mu et al. Citation2007). The P-M equation is typically written in terms of the latent heat flux:
where is the latent heat flux under clear sky conditions (W m−2),
is the latent heat of vaporization (J kg−1),
is the slope of the curve relating the saturated water vapor pressure to temperature (kPa K−1),
is the soil heat flux (W m−2),
is the air density (kg m−3),
is the specific heat capacity of air (J kg−1 K−1),
is the saturated water vapor pressure (Pa),
is the actual water vapor pressure (Pa),
is the aerodynamic resistance (s m−1),
is the psychrometric constant which is set to the constant value of 0.66 Pa K−1, and
is the surface resistance (s m−1). The detailed procedure was as described in previous studies (Hwang and Choi Citation2013; Mu et al. Citation2007).
Net radiation (RN), which is the energy budget between the incoming and outgoing energy fluxes at the land surface, is a key hydrometeorological variable used to estimate ET. Since RN is employed as a major input parameter in the ET models, accurate estimation of RN should be a prerequisite to achieving a reliable evaluation of ET (Monteith Citation1965; Priestley and Taylor Citation1972). This study focused on the physically based methods with fewer input parameters for estimation of the robust radiation components, because previous studies were seldom conducted on a complex topography (Bisht et al. Citation2005; Bisht and Bras Citation2010; Jin, Randerson, and Goulden Citation2011; Ryu et al. Citation2008). The radiation estimation methods were applied using the MODIS atmosphere and land products only when ground observations were needed, which are not readily available over a large area.
RN under clear sky conditions at the land surface can be calculated as follows:
where is albedo,
and
are the downward and upward long-wave radiation fluxes (W m−2), respectively,
is the downward short-wave radiation flux (W m−2), and
is the broadband surface emissivity.
was simply extracted from the MCD43B3 albedo product.
was calculated using the Brutsaert model (Brutsaert Citation1975) as follows:
where is the actual vapor pressure (hPa),
is the air temperature (K), and
is the Stefan–Boltzmann constant (5.67 × 10⁻⁸ W m−2 K−4). The Brutsaert model is a physically based method which uses radiative transfer theory and has been verified as a robust estimation method (Choi, Jacobs, and Kustas Citation2008; Kjaersgaard, Plauborg, and Hansen Citation2007). In this study, the MOD07_L2 atmospheric profile products including Ta and dew-point temperature (Td) were used as the input parameters to calculate ea.
was simply estimated using the Stefan–Boltzmann equation:
where is the broadband surface emissivity, set to 0.97, and
is the land surface temperature (K). The MOD11A1 land surface temperature and emissivity product was employed as the
distribution.
Allen, Tasumi, and Trezza (Citation2007) proposed a remote sensing-based estimation method during introduction of the Mapping Evapotranspiration with Internalized Calibration (METRIC) model.
can be estimated by separation of the broadband atmospheric transmissivity into direct and diffuse components:
where is the solar constant (1367 W m−2),
is the solar incidence angle,
is the inverse squared relative Earth–Sun distance, and
is the broadband atmospheric transmissivity (Allen, Tasumi, and Trezza Citation2007). Pa is the air pressure (kPa), Kt is a turbidity coefficient with values ranging from 0 to 1, and PWC is the water in the atmosphere (mm). Similar to the calculation process for
, the MOD07_L2 atmospheric profiles products (
, Pa, and PWC) were used in this algorithm.
3.2. ET algorithm using revised RS-PM under all sky conditions
The actual ET algorithm for all and cloudy sky conditions is a revision of the original ET algorithm for clear sky conditions, as follows:
The original cloudy sky algorithm was based on the net radiation method (Bisht and Bras Citation2010):
where is albedo,
and
are the downward and upward long-wave radiation fluxes (W m−2) under the cloudy sky conditions, respectively,
is the downward short-wave radiation flux (W m−2) under cloudy sky conditions, and
is the broadband surface emissivity (unitless).
was simply extracted from the MCD43B3 albedo product.
is based on the Brutsaert model (Brutsaert Citation1975), and can be calculated as a combination of the downward radiation from the land surface and cloud conditions (Bisht and Bras Citation2010; Forman and Margulis Citation2009).
was estimated as follows:
where is the actual vapor pressure (hPa),
is the air temperature (K), and
is the Stefan–Boltzmann constant (5.67 × 10⁻⁸ W m−2 K−4).
and
are the cloud emissivity (unitless) and cloud top temperature (K), respectively.
and
were extracted from the MOD06 cloud product.
can simply be estimated using the Stefan–Boltzmann equation, and is equivalent to
under clear sky conditions, such that
is calculated as a combination of the linear equation for the radiation under clear and cloudy sky conditions, weighted by the cloud cover fraction from the MOD06 product according to the parameterization proposed by Allen, Tasumi, and Trezza (Citation2007) in the introduction of the METRIC model:
where is the solar constant (1367 W m−2),
is the solar incidence angle,
is the inverse squared relative Earth–Sun distance,
is the broadband atmospheric transmissivity,
is the cloud cover fraction (unitless), and
is the cloud optical thickness.
and
were extracted from the MOD06 cloud product.
Finally, to estimate the diurnal cycles of and the daily average
, the sinusoidal model (proposed by Bisht et al. Citation2005) was adopted in this study. In addition, for comparison with the ground measurement data, daily average ET values were computed through conversion of the units from W m−2 to mm day−1. presents the flowchart illustrating the method of ET estimation from the MODIS data-sets for all sky conditions.
Figure 2. Flowchart to estimate ET from the MODIS data for all sky conditions.
4. Results and discussion
4.1. Temporal variations of ET and comparisons with ground observations
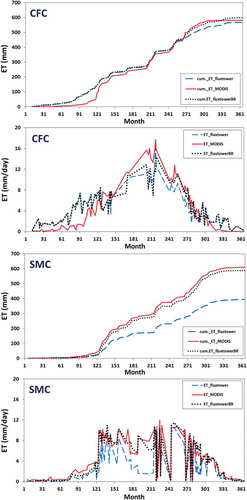
shows the temporal distributions of the monthly average ET obtained using the revised RS-PM algorithm (ETMODIS) under all sky conditions and the ground measured ET flux at the two flux tower measurement sites (SMC and CFC sites) in the South Korean region for the entire period of 2012. The temporal variation of the ETMODIS calculation was similar with that of the ground measured ET at both sites. The ETMODIS values were higher than the flux tower ground measurement data, because energy flux measurements using the eddy covariance technique often have technical limitations of energy closure in that the sum of the latent and sensible heat flux tends to be less than the available energy (Brotzge and Crawford Citation2003; Mahrt Citation1998; Moore Citation1976; Prueger et al. Citation2005; Twine et al. Citation2000). For this reason, the Bowen ratio (BR) method was adopted to correct the flux measurements (Twine et al. Citation2000). The observed available energy was partitioned into the corrected latent and sensible heat fluxes with the BR, which was defined as the ratio of the sensible heat flux to the latent heat flux. The BR method was widely applied as a useful correction method for the latent heat flux observation in the previous studies (Choi et al. Citation2009; Hwang and Choi Citation2013; Sumner and Jacobs Citation2005). Compared to the ground observations, ETMODIS robustly reproduced temporal trends at both sites. In the case of the CFC site, ETMODIS showed moderate estimates during the growing season (from May to September) (). However, distinctively larger values at the SMC site were also determined by ETMODIS for the period of April to October ().
Figure 3. Temporal variations of daily estimated ET in 2012.
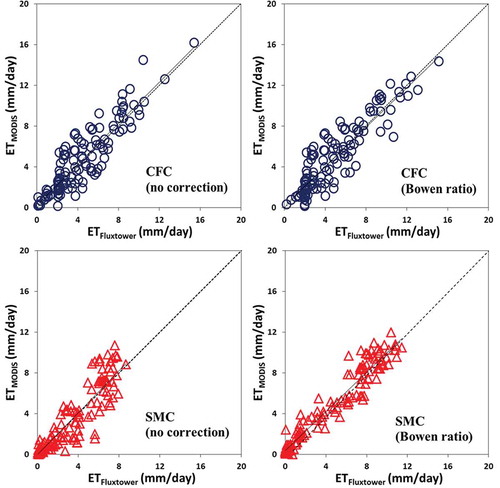
Validation of the ETMODIS product was performed using the flux tower measurements, the results of which are presented in and . The ETMODIS overestimated ET value compared with the ground measured ET flux (ETFluxtower) at the SMC flux tower site, as shown in . The ETMODIS and the ETFluxtower had a relatively high correlation coefficient, r = 0.85, bias = −0.18 mm day−1, and RMSE = 1.42 mm day−1. The statistical results of adopted BR method showed correlation coefficient r = 0.97, bias = −0.03 mm day−1, and RMSE = 0.90 mm day−1. In the case of the CFC site, reasonable agreement between the ETMODIS and flux tower measurement data was observed. The ETMODIS and the ETFluxtower had a relatively high correlation coefficient, r = 0.87, bias = −0.14 mm day−1, and RMSE = 1.26 mm day−1, while the adopted BR method obtained the values of r = 0.91, bias = 0.01 mm day−1, and RMSE = 1.24 mm day−1. Above all statistical results, results of the SMC site with BR method showed the best performance. These results were fairly similar to those observed in several of the previous studies (Byun, Liaqat, and Choi Citation2014; Baik and Choi Citation2015). Byun, Liaqat, and Choi (Citation2014) performed validation analyses and assessed the accuracy of three different algorithms (point-based Surface Energy Balance System (SEBS_P), regional-scaled SEBS (SEBS_R), and revised RS-PM under clear sky condition (R-RS-PM)) corresponding to geographical locations of the ground measurements. They also showed the statistical results of ET (mm day−1) at the same study sites examined herein. In the case of the CFC site, the following results were reported for the three models tested in Byun, Liaqat, and Choi (Citation2014): (1) ETSEBS_P and ETFluxtower: bias = 0.96 and RMSE = 1.27, and for the BR method bias = −0.45, RMSE = 0.87; (2) ETSEBS_R and ETFluxtower: bias = 0.82, RMSE = 1.11, and for the BR method bias = −0.59, RMSE = 1.12; (3) ETR-RS-PM and ETFluxtower: bias = 0.06, RMSE = 1.25, and for the BR method bias = −1.35, RMSE = 2.07. In case of the SMC site, the following results were reported: (1) ETSEBS_P and ETFluxtower: bias = 1.75, RMSE = 2.04, and for the BR method bias = 0.22, RMSE = 1.10; (2) ETSEBS_R and ETFluxtower: bias = 1.46, RMSE = 1.69, and for the BR method bias = −0.07, RMSE = 1.10; (3) ETR-RS-PM and ETFluxtower: bias = 2.20, RMSE = 2.70, and for the BR method bias = 0.67, RMSE = 1.32. Compared with the above results, the reliabilities of our estimated results displayed more confidence. The systematic errors in ETMODIS, mainly caused by overestimation of the MODIS LAI products, may induce exaggerated ET flux values, especially during the growing season (Hwang and Choi Citation2013; Mu et al. Citation2007). The ETMODIS proportionally employs LAI to estimate the canopy conductance, which may seriously affect the transpiration calculation (Hwang and Choi Citation2013). As such, ETMODIS was found to provide a more slightly accurate value for the CFC than the SMC site, due to topographical differences between the two sites. The CFC site, which was a flat region with a rice paddy, was fully irrigated during the growing season, and showed similar properties with a wetland (Ryu et al. Citation2012). Ryu et al. (Citation2012) asserted that rice paddy sites showed higher ET values because there is no water limitation due to irrigation and higher vapor pressure deficit.
Table 3. Statistic comparing observed and estimated ET.
Figure 4. Comparison between observed and estimated ET.
4.2. Spatial distributions of ETMODIS under all sky conditions
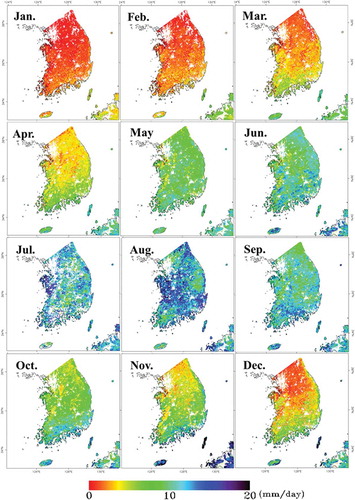
shows the spatial distributions of the ETMODIS under all sky conditions in the South Korean region for the entire period of 2012. The study area had a heterogeneous topography with various types of land, and the ETMODIS values were well distributed with few variations. However, the altitude had an influence on the values of the ETMODIS calculations, with higher ETMODIS values observed in the areas at higher elevations () (Kim et al. Citation2012; Hwang and Choi Citation2013). The mid-eastern parts of the Korean peninsula were representative of high elevation areas, where the ETMODIS calculations were distinctively higher than in other nearby areas. The geographic location was found to be an essential contributing parameter to the value of ETMODIS (Gao et al. Citation2014; Kim et al. Citation2012; Hwang and Choi Citation2013; Ryu et al. Citation2008). Higher ETMODIS values were found in the areas near the coastline, and gradually decreased inland. When compared to a previous study by Jang et al. (Citation2013), in which MODIS-based ET was conducted over North East Asia, the spatial patterns were very similar to those of the Korean peninsula observed herein. In addition, Kim et al. (Citation2012) evaluated the MODIS 16 ET product over South Korea under clear sky conditions and showed similar spatial trends as those obtained herein. The estimated ETMODIS values ranged from 5 to 10 mm day−1 in the western flat region and 10 to 20 mm day−1 in the eastern mountainous forest region of Korea. Even though the ETMODIS values in the western region were substantially underestimated, the general tendency of the ETMODIS values in South Korea was in agreement with the highest ET values measured over the eastern forested regions and the lowest ET values in the inland region (Jang et al. Citation2013; Kim et al. Citation2012; Sur and Choi Citation2013).
Figure 5. Spatial distribution of monthly estimated ET under all sky conditions in 2012. For full color versions of the figures in this paper, please see the online version.
5. Conclusion
In this study, we focused on examining the applicability of the remote sensing-based ET algorithm (ETMODIS) under all sky conditions in mixed forest and cropland regions on the Korean peninsula. The ETMODIS estimates were well correlated with the ground measurements, displaying high values of the correlation coefficient (ETMODIS: r = 0.85 in SMC and r = 0.86 in CFC; r = 0.97 in SMCBR and r = 0.91 in CFCBR) over topographically different sites. Overall, the ETMODIS showed good agreements for the cropland (CFC site), while the ET of the mixed forest (SMC site) was overestimated when compared with the flux tower measurements. These results may be due to the spatiotemporal scale mismatch between the eddy covariance system and the remote sensing-based forcing data-sets. However, this study focused on examining the reliability of a stand-alone MODIS-based ET algorithm under all sky conditions (revised RS-PMallsky algorithm) in South Korea. The results obtained regarding the revised RS-PMallsky algorithm provide impetus for future development, as the algorithm was found to be applicable over different two land cover type regions compared with several previous studies.
Disclosure statement
No potential conflict of interest was reported by the authors.
Acknowledgement
The authors send special thanks to the Hydrological Survey Center for their data collection efforts.
Additional information
Funding
References
- Allen, R. G., L. S. Pereira, D. Raes, and M. Smith. 1998. Crop Evapotranspiration: Guidelines for Computing Crop Water Requirements. Rome: United Nations FAO Irrigation and Drainage.
- Allen, R. G., M. Tasumi, and R. Trezza. 2007. “Satellite-Based Energy Balance for Mapping Evapotranspiration with Internalized Calibration (METRIC) - Model.” Journal of Irrigation Drainage Engineering 133: 380–394. doi:10.1061/(ASCE)0733-9437(2007)133:4(380).
- Baik, J., and M. Choi. 2015. “Evaluation of Remotely Sensed Actual Evapotranspiration Products from COMS and MODIS at Two Different Flux Tower Sites in Korea.” International Journal of Remote Sensing 36: 375–402. doi:10.1080/01431161.2014.998349.
- Batra, N., S. Islam, V. Venturini, G. Bisht, and L. Jiang. 2006. “Estimation and Comparison of Evapotranspiration from MODIS and AVHRR Sensors for Clear Sky Days over the Southern Great Plains.” Remote Sensing of Environment 103: 1–15. doi:10.1016/j.rse.2006.02.019.
- Bisht, G., and R. L. Bras. 2010. “Estimation of Net Radiation from the MODIS Data under All Sky Conditions: Southern Great Plains Case Study.” Remote Sensing of Environment 114: 1522–1534. doi:10.1016/j.rse.2010.02.007.
- Bisht, G., V. Venturini, S. Islam, and L. Jiang. 2005. “Estimation of the Net Radiation Using MODIS (Moderate Resolution Imaging Spectroradiometer) Data for Clear Sky Days.” Remote Sensing of Environment 97: 52–67. doi:10.1016/j.rse.2005.03.014.
- Brotzge, J. A., and K. C. Crawford. 2003. “Examination of the Surface Energy Budget: A Comparison of Eddy Correlation and Bowen Ratio Measurement Systems.” Journal of Hydrometeorology 4 (2): 160–178. doi:10.1175/1525-7541(2003)4<160:EOTSEB>2.0.CO;2.
- Brutsaert, W. 1975. “On a Derivable Formula for Long-Wave Radiation from Clear Skies.” Water Resources Research 11: 742–744. doi:10.1029/WR011i005p00742.
- Brutsaert, W. 1982. Evaporation into the Atmosphere: Theory, History, and Applications. Dordrecht: D. Reidel.
- Byun, K., U. W. Liaqat, and M. Choi. 2014. “Dual-Model Approaches for Evapotranspiration Analyses over Homo- and Heterogeneous Land Surface Conditions.” Agricultural and Forest Meteorology 197: 169–187. doi:10.1016/j.agrformet.2014.07.001.
- Choi, M., J. M. Jacobs, and W. P. Kustas. 2008. “Assessment of Clear and Cloudy Sky Parameterizations for Daily Downwelling Longwave Radiation over Different Land Surfaces in Florida, USA.” Geophysical Research Letters 35: L20402. doi:10.1029/2008GL035731.
- Choi, M., T. W. Kim, M. Park, and S. J. Kim. 2011. “Evapotranspiration Estimation Using the Landsat-5 Thematic Mapper Image over the Gyungan Watershed in Korea.” International Journal of Remote Sensing 32: 4327–4341. doi:10.1080/01431161.2010.486417.
- Choi, M., W. P. Kustas, M. C. Anderson, R. G. Allen, F. Li, and J. H. Kjaersgaard. 2009. “An Intercomparison of Three Remote Sensing-Based Surface Energy Balance Algorithms over a Corn and Soybean Production Region (Iowa, U.S.) during SMACEX.” Agricultural and Forest Meteorology 149: 2082–2097. doi:10.1016/j.agrformet.2009.07.002.
- Cleugh, H. A., R. Leuning, Q. Mu, and S. W. Running. 2007. “Regional Evaporation Estimates from Flux Tower and MODIS Satellite Data.” Remote Sensing of Environment 106: 285–304. doi:10.1016/j.rse.2006.07.007.
- Forman, B. A., and S. A. Margulis. 2009. “High-resolution Satellite-based Cloud-coupled Estimates of Total Downwelling Surface Radiation for Hydrologic Modelling Applications.” Hydrology and Earth System Sciences 13: 969–986. doi:10.5194/hess-13-969-2009.
- Gao, Z., Q. Wang, X. Cao, and W. Gao. 2014. “The Responses of Vegetation Water Content (EWT) and Assessment of Drought Monitoring along a Coastal Region Using Remote Sensing.” GIScience & Remote Sensing 51 (1): 1–16. doi:10.1080/15481603.2014.882564.
- Glenn, E. P., A. R. Huete, P. L. Nagler, K. K. Hirschboeck, and P. Brown. 2007. “Integrating Remote Sensing and Ground Methods to Estimate Evapotranspiration.” Critical Reviews in Plant Sciences 26: 139–168. doi:10.1080/07352680701402503.
- Gowda, P., T. Howell, S. Evett, J. Chavez, and L. New. 2008. “Remote Sensing of Contrasting Tillage Practices in the Texas Panhandle.” International Journal of Remote Sensing 29 (12): 3477–3487. doi:10.1080/01431160701581810.
- Ha, W., P. H. Gowda, and T. A. Howell. 2011. “Downscaling of Land Surface Temperature Maps in the Texas High Plains with the TsHarp Method.” GIScience & Remote Sensing 48 (4): 583–599. doi:10.2747/1548-1603.48.4.583.
- Hong, J., H. Kwon, J.-H. Lim, Y.-H. Byun, J. Lee, and J. Kim. 2009. “Standardization of KoFlux Eddy-Covariance Data Processing.” Korean Journal of Agricultural and Forest Meteorology 11: 19–26. doi:10.5532/KJAFM.2009.11.1.019.
- Hwang, K., and M. Choi. 2013. “Seasonal Trends of Satellite-Based Evapotranspiration Algorithms over a Complex Ecosystem in East Asia.” Remote Sensing of Environment 137: 244–263. doi:10.1016/j.rse.2013.06.006.
- Jang, K., S. Kang, J. Kim, C. B. Lee, T. Kim, J. Kim, R. Hirata, and N. Saigusa. 2010. “Mapping Evapotranspiration Using MODIS and MM5 Four-Dimensional Data Assimilation.” Remote Sensing of Environment 114: 657–673. doi:10.1016/j.rse.2009.11.010.
- Jang, K., S. Kang, Y.-J. Lim, S. Jeong, J. Kim, J. S. Kimball, and S. Y. Hong. 2013. “Monitoring Daily Evapotranspiration in Northeast Asia Using MODIS and a Regional Land Data Assimilation System.” Journal of Geophysical Research: Atmospheres 118: 12927–12940. doi:10.1002/2013JD020639.
- Jin, Y., J. T. Randerson, and M. L. Goulden. 2011. “Continental-Scale Net Radiation and Evapotranspiration Estimated Using MODIS Satellite Observations.” Remote Sensing of Environment 115: 2302–2319. doi:10.1016/j.rse.2011.04.031.
- Kalma, J., T. McVicar, and M. McCabe. 2008. “Estimating Land Surface Evaporation: A Review of Methods Using Remotely Sensed Surface Temperature Data.” Surveys in Geophysics 29: 421–469. doi:10.1007/s10712-008-9037-z.
- Kim, H., K. Hwang, Q. Mu, S. O. Lee, and M. Choi. 2012. “Validation of Modis 16 Global Terrestrial Evapotranspiration Products in Various Climates and Land Cover Types in Asia.” KSCE Journal of Civil Engineering 16: 229–238. doi:10.1007/s12205-012-0006-1.
- Kjaersgaard, J. H., F. L. Plauborg, and S. Hansen. 2007. “Comparison of Models for Calculating Daytime Long-Wave Irradiance Using Long Term Data Set.” Agricultural and Forest Meteorology 143: 49–63. doi:10.1016/j.agrformet.2006.11.007.
- Kustas, W. P., and J. M. Norman. 1997. “A Two-Source Approach for Estimating Turbulent Fluxes Using Multiple Angle Thermal Infrared Observations.” Water Resources Research 33: 1495–1508. doi:10.1029/97WR00704.
- Kwon, H., S. Park, M. Kang, J. Yoo, R. Yuan, and J. Kim. 2007. “Quality Control and Assurance of Eddy Covariance Data at the Two Koflux Sites.” Korean Journal of Agricultural and Forest Meteorology 9: 260–267. doi:10.5532/KJAFM.2007.9.4.260.
- Li, S., and W. Zhao. 2010. “Satellite-Based Actual Evapotranspiration Estimation in the Middle Reach of the Heihe River Basin Using the SEBAL Method.” Hydrological Processes 24 (23): 3337–3344. doi:10.1002/hyp.v24:23.
- Li, Z.-L., R. Tang, Z. Wan, Y. Bi, C. Zhou, B. Tang, G. Yan, and X. Zhang. 2009. “A Review of Current Methodologies for Regional Evapotranspiration Estimation from Remotely Sensed Data.” Sensors 9: 3801–3853. doi:10.3390/s90503801.
- Mahrt, L. 1998. “Flux Sampling Errors for Aircraft and Towers.” Journal of Atmospheric and Oceanic Technology 15 (2): 416–429. doi:10.1175/1520-0426(1998)015<0416:FSEFAA>2.0.CO;2.
- Menzel, W. P., S. W. Seemann, J. Li, and L. E. Gumley. 2002. MODIS Atmospheric Profile Retrieval Algorithm Theoretical Basis Document (MOD07). Madison: University of Wisconsin–Madison Press.
- Monteith, J. L. 1965. “Evaporation and Environment.” Symposia of the Society for Experimental Biology 19: 205–234.
- Moore, C. J. 1976. “Eddy Flux Measurements above a Pine Forest.” Quarterly Journal of the Royal Meteorological Society 102: 913–918. doi:10.1002/(ISSN)1477-870X.
- Mu, Q., F. A. Heinsch, M. Zhao, and S. W. Running. 2007. “Development of a Global Evapotranspiration Algorithm Based on MODIS and Global Meteorology Data.” Remote Sensing of Environment 111: 519–536. doi:10.1016/j.rse.2007.04.015.
- Mu, Q., M. Zhao, and S. W. Running. 2011. “Improvements to a MODIS Global Terrestrial Evapotranspiration Algorithm.” Remote Sensing of Environment 115: 1781–1800. doi:10.1016/j.rse.2011.02.019.
- Norman, J. M., W. P. Kustas, and K. S. Humes. 1995. “A Two-Source Approach for Estimating Soil and Vegetation Energy Fluxes in Observations of Directional Radiometric Surface Temperature.” Agricultural and Forest Meteorology 77: 263–293. doi:10.1016/0168-1923(95)02265-Y.
- Penman, H. L. 1948. “Natural Evaporation from Open Water, Bare Soil and Grass.” Proceedings of the Royal Society A: Mathematical, Physical and Engineering Sciences 193: 120–145. doi:10.1098/rspa.1948.0037.
- Priestley, C. H. B., and R. J. Taylor. 1972. “On the Assessment of Surface Heat Flux and Evaporation Using Large-Scale Parameters.” Monthly Weather Review 100: 81–92. doi:10.1175/1520-0493(1972)100<0081:OTAOSH>2.3.CO;2.
- Prueger, J. H., J. L. Hatfield, T. B. Parkin, W. P. Kustas, L. E. Hipps, C. M. U. Neale, J. I. MacPherson, W. E. Eichinger, and D. I. Cooper. 2005. “Tower and Aircraft Eddy Covariance Measurements of Water Vapor, Energy and Carbon Dioxide Fluxes during SMACEX.” Journal of Hydrometeorology 6 (6): 954–960. doi:10.1175/JHM457.1.
- Roerink, G. J., Z. Su, and M. Menenti. 2000. “S-SEBI: A Simple Remote Sensing Algorithm to Estimate the Surface Energy Balance. Physics and Chemistry of the Earth, Part B: Hydrology.” Oceans and Atmosphere 25: 147–157.
- Ryu, Y., D. D. Baldocchi, T. A. Black, M. Detto, B. E. Law, R. Leuning, A. Miyata, et al. 2012. “On the Temporal Upscaling of Evapotranspiration from Instantaneous Remote Sensing Measurements to 8-Day Mean Daily-Sums.” Agricultural and Forest Meteorology 152: 212–222. doi:10.1016/j.agrformet.2011.09.010.
- Ryu, Y., S. Kang, S.-K. Moon, and J. Kim. 2008. “Evaluation of Land Surface Radiation Balance Derived from Moderate Resolution Imaging Spectroradiometer (MODIS) over Complex Terrain and Heterogeneous Landscape on Clear Sky Days.” Agricultural and Forest Meteorology 148: 1538–1552. doi:10.1016/j.agrformet.2008.05.008.
- Seemann, S. W., J. Li, W. P. Menzel, and L. E. Gumley. 2003. “Operational Retrieval of Atmospheric Temperature, Moisture, and Ozone from MODIS Infrared Radiances.” Journal of Applied Meteorology 42: 1072–1091. doi:10.1175/1520-0450(2003)042<1072:OROATM>2.0.CO;2.
- Sumner, D. M., and J. M. Jacobs. 2005. “Utility of Penman-Monteith, Priestley-Taylor, Reference Evapotranspiration, and Pan Evaporation Methods to Estimate Pasture Evapotranspiration.” Journal of Hydrology 308: 81–104. doi:10.1016/j.jhydrol.2004.10.023.
- Sur, C., and M. Choi. 2013. “Evaluating Ecohydrological Impacts of Vegetation Activities on Climatological Perspectives Using MODIS Gross Primary Productivity and Evapotranspiration Products at Korean Regional Flux Network Site.” Remote Sensing 5: 2534–2553. doi:10.3390/rs5052534.
- Tang, B., and Z. Li. 2008. “Estimation of Instantaneous Net Surface Longwave Radiation from MODIS Cloud-Free Data.” Remote Sensing of Environment 112: 3482–3492. doi:10.1016/j.rse.2008.04.004.
- Twine, T. E., W. P. Kustas, J. M. Norman, D. R. Cook, P. R. Houser, T. P. Meyers, J. H. Prueger, P. J. Starks, and M. L. Wesely. 2000. “Correcting Eddy-Covariance Flux Underestimates over a Grassland.” Agricultural and Forest Meteorology 103: 279–300. doi:10.1016/S0168-1923(00)00123-4.
- Yang, F., M. A. White, A. R. Michaelis, K. Ichii, H. Hashimoto, P. Votava, A.-X. Zhu, and R. R. Nemani. 2006. “Prediction of Continental-Scale Evapotranspiration by Combining MODIS and AmeriFlux Data through Support Vector Machine.” IEEE Transactions on Geoscience and Remote Sensing 44: 3452–3461. doi:10.1109/TGRS.2006.876297.