
Abstract
Demand for orthoimages is increasing as a crucial component of geographic information systems (GISs). Orthoimages are geometrically equivalent to planimetric maps, which show true geographic locations of terrain features. To produce orthoimages, geometric distortions from camera tilt and relief displacement from perspective images must be corrected. Traditionally, removing such distortions has been accomplished by differential rectification in a pixel-by-pixel fashion. However, this method cannot produce true orthoimages because of the double-mapping problem. We propose a method of generating patch-based true orthoimages for surface patches in buildings. The proposed method utilizes three-dimensional (3D) building model data. Patches from the data were projected onto aerial images to extract image patches and analysis of the superstructures was performed. Because orthoimages are generated for each building, the orthoimage quality is enhanced when using building data with a high level of detail. Instead of performing the complex visibility analysis of existing approaches, this article identifies occlusion areas based on unit surfaces of buildings and presents mutual recovery of occlusions using multiple images. To evaluate the feasibility of the method, experiments were performed with real datasets: (1) a building with a dome superstructure, (2) high-rise buildings close to each other, and (3) buildings with various shapes.
1. Introduction
A key product of spatial information and various information media, maps are widely utilized for efficient decision-making in administrative and civilian affairs. In addition to spatial information acquisition and information processing technology, map production technology has advanced rapidly. In particular, orthoimages are an important element in systems providing spatial information. Topographic maps are integrated with aerial and satellite images to visualize the real world and enhance cognitive effects, thereby facilitating the extraction of useful information. There has been an increase in demand for realistic image maps.
Geometric characteristics of the aerial images taken from optical cameras are dictated by perspective projection, which causes geometric distortions such as scale variation and displacement of terrain features. Such distortions are affected by focal length, flying height, camera tilting (interior and exterior orientation parameters (IOPs and EOPs) of the aerial images), and surface relief. Oriented images and digital elevation models (DEMs) are essential data to correct distortions for generating true orthoimages (Gil, Corbelle, and Ortiz Citation2011). The IOPs can be provided from camera calibration protocols and the EOPs are obtained through aerial triangulation. Aerial Triangulation is a process of establishing geometric relationships between individual images and a reference coordinate system using ground control points (GCPs), an on-board global positioning system and inertial navigation system (Wolf and Dewitt Citation2000). The main objective of aerial triangulation is to produce sufficient points in the photogrammetric models to ensure that each model can be oriented accurately. IOPs provide accurate focal length and the origin of the image coordinate system (i.e., the principal point) of the camera. IOPs and EOPs are used to extract surface patches from the images through the collinearity equations described in Section 2.1.
Orthoimages offer advantages over planimetric maps that utilize lines and symbols plotted to a specific scale because orthoimages provide pictorial quality with continuous-tone imagery of unlimited numbers of ground features. Therefore, better interpretation and analysis are possible with orthoimages compared with conventional maps. On the other hand, producing vector maps (topographic vector maps that consist of points, lines, and polygons with coordinates to represent terrain features graphically) requires map generalization that results in incomplete rendering of real-world objects (Cheng et al. Citation2013; Shi and Charlton Citation2013). Orthoimages can be used as maps for cartometry including measurements of distances, directions, areas, and coordinates of the features (Wolf and Dewitt Citation2000).
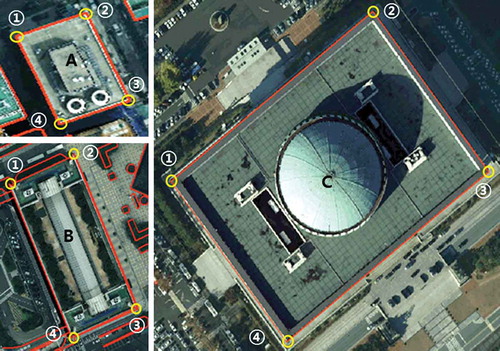
The crucial tasks in true orthoimage generation are identifying occlusion areas (or hidden areas) and recovering them. Occlusions occur on the ground surfaces and surrounding buildings. In addition, occlusions can also occur on roofs because of complicated roof shapes and superstructures, as shown in . As used in this study, superstructures refer to facilities or structures (e.g., elevator towers) installed on rooftops and loft roofs. This study focuses on detecting and recovering all possible occlusions to generate accurate true orthoimage.
Figure 1. Occlusion areas on aerial images (subscripts L and R denote left and right image, respectively). For full colour versions of the figures in this paper, please see the online version.
In related studies, Amhar, Josef, and Ries (Citation1998) identified occlusion areas using the ZI-buffer by masking out building areas from images with a digital building model (DBM) and digital terrain model (DTM). The ZI-buffer technique adds geometric data to the Z-buffer method, which contains information on pixels and distances. Occlusion areas were assigned the value of 0 to facilitate identification and recovered using overlapping images. Schickler and Thorpe (Citation1998) employed a digital city model with a triangular irregular network (TIN) to designate buildings as blank areas and detected occlusion areas. In the recovery of occlusion areas, aimed at generating high-quality orthoimages, the following conditions were considered: (1) pixels of images close to the plumb points of aerial images (i.e., points at which a vertical line through the perspective center of the camera pierces the image plane); (2) pixels of images with small angles formed by the nadir lines of scan direction and TIN; and (3) pixels of images close to occlusion areas.
Sheng, Gong, and Biging (Citation2003) studied the production of orthoimages by using a Z-buffer and compositing methods to remove seam lines between images. Zhou et al. (Citation2004) combined the methods of Amhar, Josef, and Ries (Citation1998) and Schickler and Thorpe (Citation1998) to propose an improved technique for generating orthoimages. Their method generates orthoimages by combining them with occlusion areas detected from the Z-buffer method using DBM and a bottom-up back-projecting method using DTM. Kuzmin, Korynik, and Long (Citation2004) employed a polygon-based technique for the generation of orthoimages. Correction was performed using an existing method of relief displacement, and DBM was used to detect occlusion areas outside building areas.
Habib, Kim, and Kim (Citation2007) suggested using the adaptive radial-sweep method and the spiral-sweep method to detect occlusion areas. The adaptive radial-sweep method moves in the direction of light from the nadir point and determines whether occlusion has occurred in each DEM cell. This method offers improved accuracy in occlusion detection using angle and building height. The angle-based spiral-sweep method detects occlusion areas while moving in the direction of light, and enables direct calculations without additional arrangement or DEM segmentation. Zhou, Xie, and Cheng (Citation2008) proposed a method for enhancing the accuracy of orthoimages based on an increased number of GCPs and improved geometric distribution. Corner points of buildings and other constraints were established as mathematical models, and the corrected coordinates were then used to generate orthoimages. Zhong et al. (Citation2010) calculated the actual areas of buildings in images based on the relationship between building polygons for efficient detection of occlusion areas, and compared the accuracy of the proposed method with that of Z-buffer and projection-ray angle-based methods.
In recent studies, Wang and Xie (Citation2012) adopted an iteration strategy to detect occlusion areas caused by roofs as well as building walls. Bagheri and Sadeghian (Citation2013) suggested using genetic algorithms and artificial neural networks to generate orthophotos. Chen et al. (Citation2014) proposed a true orthophoto-generation method using point clouds created by matching multiview aerial images. Building outlines were acquired from the point clouds by edge detection, and an outline refinement process was performed for accurate orthophoto generation. Deng et al. (Citation2015) applied a back-projection and intersection method based on DBM to detect occlusion areas and compensating double-mapping effects. The basic idea of their method is similar to the method suggested in this article. However, hierarchical analysis of building structures to recover various occlusion areas is included in our model.
The existing Z-buffer method has various disadvantages. The resolution of the DEM and images must be the same otherwise detection is inaccurate. When the terrain surface has a large curvature, inaccurate detection can occur when an inclined plane faces the projection line. The same problem arises if occlusion is not detected for DEMs without wall surfaces. Known as the M-portion problem (Rau, Chen, and Chen Citation2000; Habib, Kim, and Kim Citation2007; Zhong et al. Citation2010), this occurs when the occlusion areas of roof surfaces are not included in the occlusion areas of walls. Wall surfaces must be added to the DEM or the DBM must be used to distinguish wall surfaces in images.
The method proposed by Habib, Kim, and Kim (Citation2007) is efficient, but varying increment of azimuth angle causes problems. A small increment leads to time-consuming calculations, while a large increment can cause occlusion areas to be detected along the building outline inaccurately. Most of the above studies, except those of Kuzmin, Korynik, and Long (Citation2004) and Zhong et al. (Citation2010), performed a visibility analysis based on the Z-buffer or projection-ray angle. Kuzmin, Korynik, and Long (Citation2004) excluded analysis of superstructures and did not consider building occlusion arising from surrounding buildings.
The proposed method can be applied to larger areas for which both aerial images and building data are available. Because orthoimages are generated image by image, a mosaicking process is necessary for large areas to join the individual orthoimages. For better visual quality of the mosaicked orthoimages, some special processes such as feathering seamlines between orthoimages might be required. Because the main purpose of this article is to verify the feasibility of the proposed method using data for limited local areas, we did not use mosaicking. The main features of the present method include occlusion area detection of the various cases without visibility analysis, and occlusion area recovery using multiple images.
2. Methodology
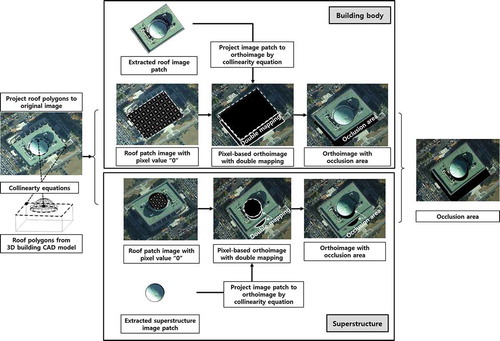
The generation of orthoimages corrects relief displacement caused by the central projection of the camera (Novak Citation1992) and detects occlusion areas. Image patches are extracted by projecting the patches of 3D building data composed of unit surfaces including superstructures, followed by detection of patch-based occlusion areas under various conditions. By performing mutual recovery of occlusion areas from multiple images, true orthoimages can be generated for urban areas in which buildings and complex structures are densely distributed. Building data are created by manually digitizing stereo aerial images. The building data are included in the building layer of the topographic maps. Once the building data are available, all the other processes can be performed automatically without manual intervention.
The building data can be obtained from the existing digital topographic maps. Other sources of building data are also available from various geographic information system (GIS) databases. Therefore, 3D building model data are becoming more available from various sources. In this article, 3D building data from topographic maps were used. However, some of the buildings were not represented with a high level-of-detail (LoD). For example, some of the superstructures on roofs were not digitized. In this case, extra work to digitize detailed features was performed. This study proposes a method of generating true orthoimages through recovery of occlusion areas not only in terrain surfaces and surrounding buildings, but also in walls and rooftops without performing a visibility analysis. The steps below are carried out to generate true orthoimages with the patch as the basic unit ().
Figure 2. Work flow of proposed method.
2.1. Roof patch extraction
The coordinates, building index, and patch index were extracted for each patch of the 3D building model. shows an example of reorganizing (or restructuring) building data with drawing exchange format (DXF). The reorganizing process was performed automatically without manual intervention in the following steps: a building index was assigned to each building; a polygon index was assigned to each polygon in the individual buildings; 3D coordinates of the polygon vertices were extracted; and an S-identifier determined the existence of the superstructure.
Figure 3. Building the data structure of DXF.
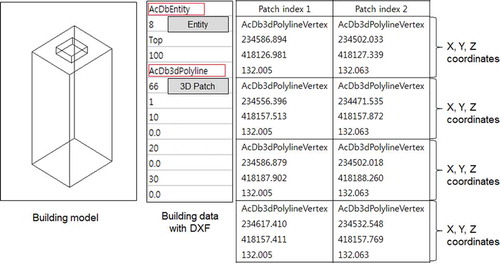
The generated building data are shown in . The patch index, which defines single patches each constituting a building, is used to extract building patches from images. The building index, assigned for each building, is used to detect superstructures and occlusion areas. The detection of superstructures is carried out with patches within the same building, while detection of occlusion areas relies on the building index to identify buildings containing occlusion areas.
Table 1. Reorganized 3D building model data of .
Based on the generated building data, collinearity Equations (1) and (2) were employed for the extraction of building patches from aerial images. These equations require 3D building model data, IOPs (xp, yp, c), and EOPs (Xo, Yo, Zo, ω, φ, κ). The extracted building patches generate data consisting of pixel values and binary data composed of 0 and 1 for the superstructure analysis and occlusion detection.
where (X, Y, Z) are patch coordinates from building data and (x, y) are corresponding image patch coordinates. (xp, yp) are coordinates of the principal point, c is the camera focal length. (Xo, Yo, Zo) are coordinates of the perspective center. (ω, φ, κ) are rotation angles of the image with respect to the X-, Y-, and Z-axes, respectively.
2.2. Superstructure analysis
A superstructure analysis map was generated to express the geometric relationship of superstructures. This method is more efficient than using only coordinates of patches. The superstructure analysis map, which is binary data generated for the projection of patches that constitute rooftops, can be used to analyze the presence, shape, and organization of the superstructures. Using binary data and the height value (Z), the analysis of superstructures is performed as follows:
To detect superstructures, rooftop patches for each building unit are projected onto images. The single patch areas are assigned a value of 1 while the remaining areas are designated 0, thereby generating binary data.
Superstructure detection is conducted for each building, and the binary data generated in (1) are overlapped and summed according to pixels. Because roof patches have been assigned one, the sum becomes greater than two if a superstructure is present on rooftops. The sum becomes three if another superstructure exists on top of a superstructure. Nonoverlapping areas do not contain superstructures.
Z-coordinates are detected from 3D building model data of patches in overlapping areas, and patches with large height values are recognized as superstructures. An S-identifier is assigned to the identified patches: rooftops are designated as 0, and superstructures existing on top of superstructures are given values of 1, 2, 3… n in increasing order.
Among patches recognized as superstructures, those with areas smaller than a certain threshold value are excluded. In this case, relief displacement is not corrected, but the quality of the orthoimages is not significantly affected as the structures are likely to be small (e.g., ventilation facilities).
Because polygons are identified by the coordinates of the vertices, the topological relationships among the polygons can be analyzed; i.e., polygons can be recognized as inside or outside each building. Therefore, the S-identifier indicates the existence of the superstructure. If there is no superstructure, the S-identifier is set to 0 and n means there are n superstructures inside a specific superstructure, as shown in . Some buildings might have several superstructures on a superstructure. In other words, a hierarchical scheme was used to analyze the shapes of roofs. These steps are necessary for automatic detection of the occlusion areas on the roofs caused by superstructures.
Figure 4. Hierarchical superstructure analysis map.
2.3. Detection of occlusion areas
This study detected occlusion areas caused by buildings, including sidewalls and superstructures. For recovery of occlusion areas, occlusion analysis maps were generated by assigning a 0 value to the detected occlusion areas (). Occlusion areas caused by sidewalls occurred frequently in areas with dense distributions of high-rise buildings, and sidewall patches of the 3D building data were projected onto images.
Figure 5. Detection of occlusion areas.
2.3.1. Occlusion areas of terrain and roof by buildings
Detection of the occlusion areas by buildings is performed in the following steps: to separate buildings from ground features, the patches of roofs and walls of buildings were projected onto images. Patches defined in images were set to 0 while the other areas were set to 1, thereby generating binary data.; to detect occlusion areas without visibility analysis, pixel-based orthoimages were generated using the binary data; and to identify occlusion areas from the pixels set to 0, the extracted roof patches are projected onto orthoimages. The pixels with 0 (i.e., black areas in the images) represent occlusion areas.
2.3.2. Occlusion areas of buildings by surrounding buildings
In areas where buildings are densely distributed, full or partial occlusion can occur because of surrounding buildings. Roof patches must be generated in consideration of occlusion caused by other buildings. To detect occlusion areas caused by surrounding buildings, all patches constituting the building must be set to 1, and the binary data generated for each building are summed. Areas for which the sum of overlapping areas is greater than two are detected and occlusion areas of other overlapped buildings are identified for the highest building.
2.4. Recovery of occlusion areas
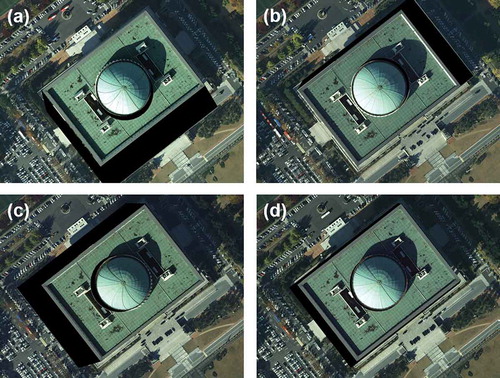
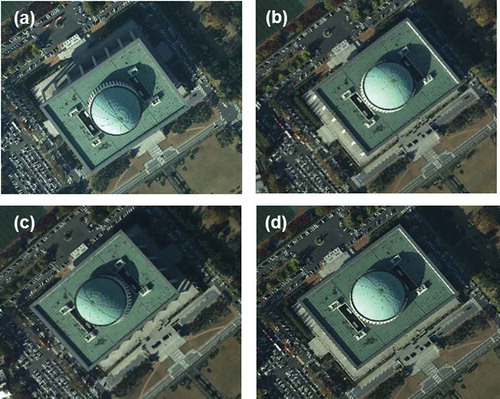
Occlusion analysis maps containing patch and occlusion areas generated in the previous step are used to recover occlusion areas. The occlusion areas are detected differently depending on the shooting location. Occlusion areas can be recovered using mutual recovery from multiple images captured at different locations. Occlusion areas defined as 0 in each orthoimage are compared one-to-one with other orthoimages to detect those with values other than 0. There were occlusion areas in all orthoimages generated up to the above step, as shown in . The occlusion areas in all orthoimages were recovered by a mutual recovery scheme using the orthoimages; i.e., all orthoimages were compared with each other to replace pixels in the occlusion areas with pixels in nonoccluded areas from other orthoimages. For example, occlusion areas on the ground and roof (represented with black areas) of “orthoimage (a)” were recovered by using orthoimages (b), (c), and (d) in .
Figure 6. True orthoimages before recovering occlusion areas. (a) Left image in strip 1. (b) Right image in strip 1. (c) Left image in strip 2. (d) Right image in strip 2.
3. Experimental results
For verification of the proposed method, the acquired information was applied to analyze the results. Busy urban cities were selected as target areas to detect occlusion areas caused by superstructures and walls, and to verify the recovery method. The experiment was performed on three areas containing a dense distribution of high-rise buildings or buildings with various roof shapes. The selected areas were the National Assembly Building (NAB), Government Complex-Daejeon (GCD), and Korea World Trade Center (KWTC). Aerial images used in the experiment were taken using Intergraph’s Digital Mapping Camera (DMC). The DMC generates 10 cm ground resolution with 120 mm focal length and 12 μm pixel size. To find model key points, the 3D building model data were mapped in high LoD from the aerial images. Some of the detailed information about images and data could not be presented explicitly because of national security laws.
3.1. National assembly building
The first area was the NAB in Seoul, Korea. A Yeouido landmark, the building includes a dome-shaped superstructure. Four images were selected for analysis from two strips intersecting at right angles in the target area. Building patches were extracted from the 3D building model data. Superstructures were detected based on an analysis of building roofs in the images. Superstructure analysis maps were generated for the roofs, and the areas with a sum greater than 2 because of overlapping roofs were detected. Patch heights corresponding to detected areas were compared to designate the area with the highest roof as the superstructure. Orthoimages were generated based on superstructure analysis maps, and occlusion analysis maps were generated using patches of superstructures with corrected relief displacement to detect occlusion areas ().
Figure 7. True orthoimage generation process of NAB (occlusion area: black). (a) Image patches and occlusion areas by superstructures. (b) Image patches and occlusion areas by building roof and superstructures. (c) Occlusion areas. (d) Final true orthoimage.
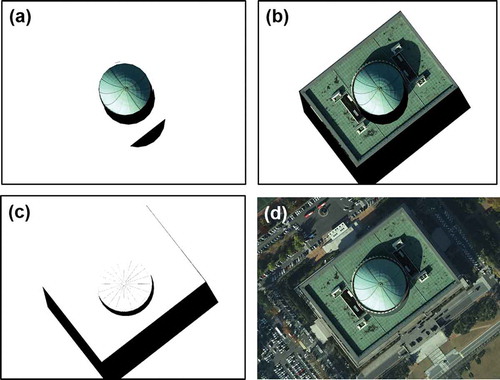
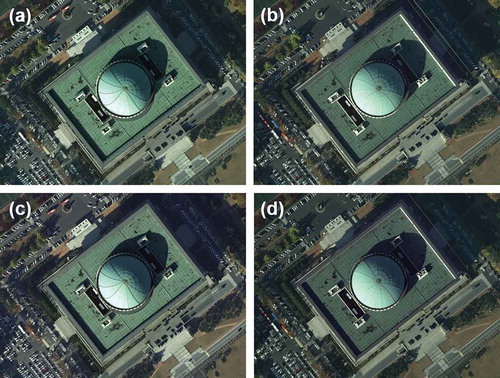
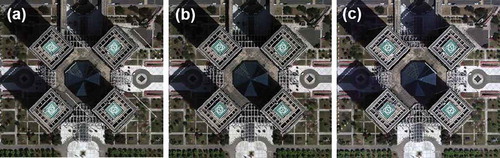
After generating orthoimages using superstructure analysis maps to define roofs and walls, occlusion analysis maps were generated using the same method as that used for superstructures. shows the occlusion areas detected from patches, and presents occlusion areas based on binary images. The final results for occlusion areas detected in the four images can be different depending on the shooting location. The occlusion areas in each image can be restored through mutual recovery (). – are all true orthoimages of the same area resulting from mutual recovery of the occlusion areas.
Figure 8. Final true orthoimages of NAB. (a) Left image in strip 1. (b) Right image in strip 1. (c) Left image in strip 2. (d) Right image in strip 2.
3.2. Government complex-Daejeon
The second area was the GCD, which consists of various buildings and superstructures. Three continuous images from one strip were selected for the experiment. Superstructure patches were determined after generating superstructure analysis maps for the roofs and detecting overlapping areas. Occlusion areas arising from superstructures were detected (), followed by those caused by buildings (). The binary images of detected occlusion areas are shown in . The true orthoimages recovered from the three continuous images are presented in . Because the second experiment involved three adjacent images from a single strip, occlusion areas exist in the same location. An error of one or two pixels occurred along the building outline, and this was caused by errors in the 3D building model data. – are all true orthoimages as explained in .
Figure 9. True orthoimage generation process of GCD (occlusion area: black). (a) Image patches and occlusion areas by superstructures. (b) Image patches and occlusion areas by building roof and superstructures. (c) Occlusion areas. (d) Final true orthoimage.
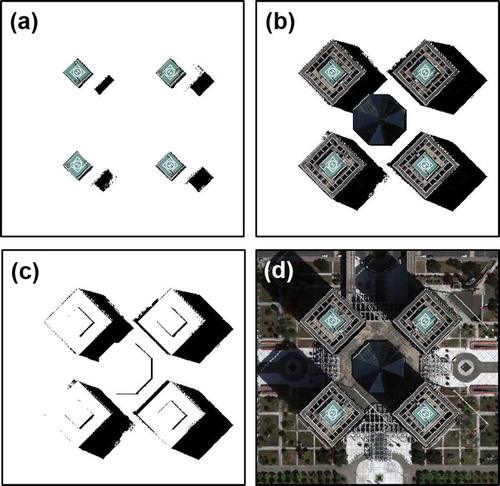
Figure 10. Final true orthoimages of GCD. (a) Left image. (b) Center image. (c) Right image.
3.3. Korea world trade center
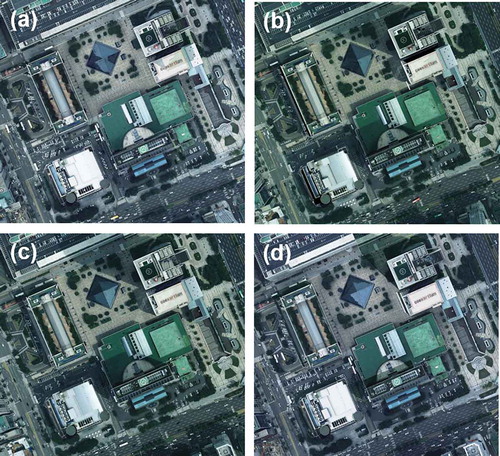
The third area was the KWTC, which consists of buildings and superstructures of various structures. Given the dense distribution of high-rise buildings, there was occlusion by surrounding buildings. Four images, including the target area, were selected from the image block. To minimize occlusion areas, orthoimages were generated with increased overlapping areas by using strips in the east–west direction for left-to-right stereo images, and strips in the north–south direction for top-to-bottom stereo images.
This area contained more complex buildings than the other two areas. shows the occlusion areas detected from level-2 patches, while shows those obtained from level-1 patches. gives the results of occlusion areas from superstructures and building bodies, and presents the binary images of occlusion areas. The final orthoimages with recovered occlusion areas can be seen in . While most occlusion areas were recovered, some occlusion occurred in the same area throughout the four images and thus could not be restored. This issue can be resolved by adding more images of the same area. – are all true orthoimages as explained in .
Figure 11. True orthoimage generation process for KWTC (occlusion area: black). (a) Image patches and occlusion areas by 2nd-level superstructures. (b) Image patches and occlusion areas by 1st-level superstructures (c) Image patches and occlusion areas by building roof and superstructures. (d) Occlusion areas. (e) Final true orthoimage.
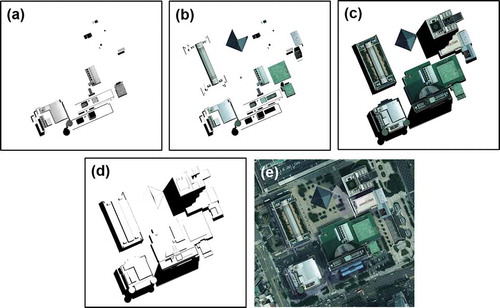
Figure 12. Final true orthoimages of KWTC area. (a) Left image in strip 1. (b) Right image in strip 1. (c) Left image in strip 2. (d) Right image in strip 2.
4. Analysis and evaluation
To assess the quality of the orthoimages, geometric accuracy and radiometric quality must be considered. Geometric accuracy could be evaluated objectively. In general, the positional accuracy of the objects at well-defined points (i.e., checkpoints) is examined. In this article, coordinates of the building corners in the orthoimages were compared with reference maps in terms of root-mean-square-error (RMSE). However, evaluating radiometric quality such as color tone, contrast, and shadow is a subjective task. In addition, it is not easy to measure the radiometric characteristics. Visual inspection is commonly used for quality validation. Because the occlusion areas were recovered using multiple images, there are mixed patches from different images. In consequence, inconsistent hue, tone, and color change might occur. To resolve such problems, specialized image-processing techniques are required. However, these are mostly ad hoc methods and are not guaranteed in every case. In this article, the radiometric aspect is not considered when assessing the quality of the final orthoimages. Schickler and Thorpe (Citation1998) attempted to improve the radiometric quality of orthoimages. They suggested using pixels close to the nadir points of the images for recovering occlusion areas.
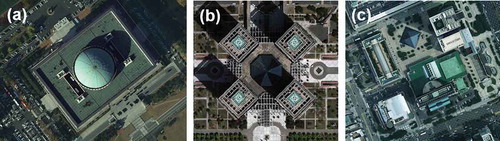
One of the quantitative analyses was based on the occlusion area recovery. We calculated the number of pixels in the detected occlusion areas, the number of pixels in unrecovered occlusion areas, and the recovery rate (). shows the unrecovered occlusion areas for each experiment. Expressed as a percentage, the overlap is the amount by which one image covers the same area as covered by another. Overlaps of images of 70% were available for the experiments in this article. The occlusion area recovery rate could be improved by increasing the overlap between images. In general, 60%–70% overlap is used for conventional topographic mapping projects. For urban areas with high-rise buildings, 80% or more overlap might be required to reduce the occlusion areas (Mikhail, Bethel, and McGlone Citation2001). In some special imaging systems, several cameras are mounted to view different directions (i.e., vertical and oblique viewing), which could reduce the occlusion areas (Rupnik, Nex, and Remondino Citation2014; Wang, Schultz, and Giuffrida Citation2008).
Table 2. Occlusion area recovery rate (1: 1st strip, 2: 2nd strip, L: left image, C: center image; R: right image).
Figure 13. Unrecovered occlusion areas. (a) NAB. (b) GCD. (c) KWTC.
Orthoimage quality mainly depends on the accuracy of the EOPs and building data, image resolution, and image resampling for pixel transformation between original image and orthoimage. Quantitative evaluation of the orthoimages was performed by computing RMSE on the ground between orthoimages and reference maps of 1/1000 scale using Equations (3)–(5) below. The accuracy of the reference maps (published by the national mapping agency) is 0.7 m or better at 95% confidence level. American Society for Photogrammetry and Remote Sensing (Citation1990) and Federal Geographic Data Committee (Citation1998) explained the topographic map accuracy standard. The RMSEs for each orthoimage were computed at the checkpoints, which are usually the corners of buildings.
where Xortho and Xmap denote the X-coordinates in the orthoimage and reference map, respectively. Yortho and Ymap denote the Y-coordinates in the orthoimage and reference map, respectively. n is the number of checkpoints. RMSEX, RMSEY, and RMSEplan are RMSEs of the X-coordinate, Y-coordinate, and planimetric RMSE, respectively. The orthoimages are 2D images like planimetric maps, so there is no Z-coordinate.
The pixel coordinates of the orthoimages were measured on the monitor manually. Therefore, some measurement errors might be unavoidable in visual identification of exact checkpoints. shows example overlays of the orthoimages and topographic maps (lines along the building boundaries), and some of the checkpoints (circles). shows coordinates of the checkpoints displayed in and coordinate differences between orthoimages and the maps. The RMSEs shown in were computed using many more checkpoints. The RMSEs represent overall positional accuracy of each orthoimage. Ground sampling distance (GSD) is the ground resolution of the orthoimage.
Table 3. Examples of coordinates of checkpoints.
Table 4. RMSEs of orthoimages.
Figure 14. Examples of checkpoint locations.
As shown in , geometric accuracy is obviously related to GSD. The RMSEs of NAB and GCD orthoimages are almost equivalent to the GSD except for the KWTC orthoimage. The overall accuracy is between 0.18 and 0.46 m (i.e., equivalent to one and four pixels, respectively) on the ground. The positional accuracy of the orthoimages satisfies the map accuracy standard of the 1/1000 topographic maps.
The algorithm was implemented using MATLAB programming. Information related to executing the program is presented in . Central processing unit (CPU) time depends on several factors such as GSD, number of polygons, and area, as shown in . The main factor is the number of polygons in the building data because the proposed method is a patch-based approach. More experiments would be required for the detailed analysis of the relationships among these factors.
Table 5. Processing information for each orthoimage.
The missing pixels are artifacts that reduce the quality of the orthoimages. Some missing pixels appear as white lines, apparently along building boundaries. When the polygons of the building data were projected back onto the original aerial images, some of the polygons might not exactly coincide with the boundaries of the buildings in the images because of inaccurate EOPs and digitizing. Some white lines are shown in the original images (e.g., the thick white line on the roof in and ). The missing pixels that appeared as white lines in the final orthoimages do not correspond to the recovery rate. The missing pixels are the artifacts as previously mentioned.
Figure 15. Original aerial images of NAB. (a) Left image in strip 1. (b) Right image in strip 1. (c) Left image in strip 2. (d) Right image in strip 2.
By analyzing the detected occlusion areas, the image with the least occlusion and the image with the shortest distance from the center to the shooting location were selected as optimal true orthoimages. Because distortion is caused by central projection and relief displacement, EOPs were used to calculate the shortest distances between perspective centers and principal points of the images. The image with the shortest distance has the least relief displacement and the smallest occlusion area ().
Figure 16. Optimal true orthoimages. (a) Right image of NAB in strip 2. (b) Center image of GCD. (c) Left image of KWTC in strip 2.
Optimal orthoimages should be selected based on not only distortion correction and occlusion recovery, but also quality-affecting radial factors such as color, brightness, uniformity of contrast ratio, shadow correction, and presence of seam lines. However, it is difficult to determine optimal orthoimages based on a comprehensive analysis of radial aspects. This is a visual problem requiring qualitative and objective judgment, and is beyond the scope of this study.
5. Conclusions
Demand for high-quality orthoimages has increased for urban area mapping. Orthoimages are precisely georeferenced distortion-free aerial images with constant scale that can be used as maps. The goal of orthoimage generation is to produce images of the parallel (or orthogonal) projection. It is impossible to obtain orthoimages from optical sensors directly because of the nature of central projection. Therefore, significant steps are involved in orthoimage generation, including detection and recovery of the occlusion areas. To date, there have been no studies on automatic generation of orthoimages with detection and recovery of occlusion areas based on a geometric analysis of superstructures. Instead of performing a complex visibility analysis, this study detected all possible occlusion areas in images. In addition to mutual recovery of occlusion areas using multiple aerial images, we conducted geometric distortion correction of superstructures and recovery of occlusion areas in an efficient and effective manner.
Based on the proposed method of patch-based true orthoimage generation, the following conclusions were derived:
True orthoimages can be generated for urban areas in which high-rise buildings of diverse structures are densely distributed. This method incorporates a superstructure analysis, not performed in previous research, and detects occlusion areas occurring on roofs as well as surrounding buildings.
Occlusion areas occurring because of buildings with complex structures were recovered by hierarchical analysis of the roof shape. This scheme can detect and recover various kinds of occlusion areas effectively.
The accuracy of EOPs and building model data affects the geometric quality of the true orthoimages. The overall positional accuracy of the final orthoimages satisfies accuracy standards of large-scale topographic maps.
Recovery of occlusion areas using different images causes color, tone, and contrast inconsistency. It is a challenging task to resolve such radiometric problems and evaluate the quality of orthoimages automatically.
An advantage of the proposed method is that all images involved in mutual recovery of the occlusion areas are orthoimages covering the same area. Therefore, the proposed method provides an opportunity to choose visually optimal orthoimages that cover the mapped area.
The proposed method requires high-LoD building data for the recovery of all possible occlusions. Such data are becoming more available from various sources including spatial data infrastructure, building databases, 3D digital maps, and urban models. Therefore, the proposed method could be feasible to generate more realistic orthoimages.
Disclosure statement
No potential conflict of interest was reported by the authors.
Additional information
Funding
References
- American Society for Photogrammetry and Remote Sensing. 1990. “ASPRS Accuracy Standards for Large-scale Maps.” Photogrammetric Engineering & Remote Sensing 55 (7): 1068–1070.
- Amhar, F., J. Josef, and C. Ries. 1998. “The Generation of True Orthophotos Using a 3D Building Model in Conjunction with a Conventional DTM.” International Archives of Photogrammetry and Remote Sensing, Stuttgart, September 7–10.
- Bagheri, H., and S. Sadeghian. 2013. “Ortho Image and DTM Generation with Intelligent Methods.” International Archives of the Photogrammetry, Remote Sensing and Spatial Information Sciences, Tehran, October 5–8. doi:10.5194/isprsarchives-XL-1-W3-475-2013.
- Chen, Y., C. Briese, W. Karel, and N. Pfeifer. 2014. “True Orthophoto Generation Using Multi-view Aerial Images.” International Archives of the Photogrammetry, Remote Sensing and Spatial Information Sciences, Zurich, September 5–7. doi:10.5194/isprsarchives-XL-3-67-2014.
- Cheng, B., Q. Liu, X. Li, and Y. Wang. 2013. “Building Simplification Using Backpropagation Neural Networks: A Combination of Cartographers’ Expertise and Raster-based Local Perception.” GIScience and Remote Sensing 50 (5): 527–542.
- Deng, F., J. Kang, P. Li, and F. Wan. 2015. “Automatic True Orthophoto Generation Based on Three-dimensional Building Model Using Multiview Urban Aerial Images.” Journal of Applied Remote Sensing 9 (1): 095087. doi:10.1117/1.JRS.9.095087.
- Federal Geographic Data Committee. 1998. Geospatial Positioning Accuracy Standards, Part 3: National Standard for Spatial Data Accuracy. Reston, VI: Federal Geographic Data Committee.
- Gil, M., E. Corbelle, and J. Ortiz. 2011. “Orthorectification of Quickbird Ortho-Ready Imagery: A Case Study Over Montainous Terrain.” Survey Review 43 (320): 199–209. doi:10.1179/003962611X12894696205064.
- Habib, A. F., E.-M. Kim, and C.-J. Kim. 2007. “New Methodologies for True Orthophoto Generation.” Photogrammetric Engineering & Remote Sensing 73 (1): 25–36. doi:10.14358/PERS.73.1.25.
- Kuzmin, Y. P., S. A. Korynik, and O. Long. 2004. “Polygon-Based True Orthophoto Generation.” 20th ISPRS Congress Proceedings, Istanbul, July 12–23.
- Mikhail, E., J. Bethel, and J. McGlone. 2001. Introduction to Modern Photogrammetry. New York: John Wiley & Sons.
- Novak, K. 1992. “Rectification of Digital Imagery.” Photogrammetric Engineering and Remote Sensing 58 (3): 339–344.
- Rau, J. Y., N. Y. Chen, and L. C. Chen. 2000. “Hidden Compensation and Shadow Enhancement for True Orthophoto Generation.” Proceedings of Asian Conference on Remote Sensing, Taipei, December 4–8.
- Rupnik, E., F. Nex, and F. Remondino. 2014. “Oblique Multi-Camera Systems: Orientation and Dense Matching Issues.” The International Archives of the Photogrammetry, Remote Sensing and Spatial Information Sciences 40 (3): 107–114. doi:10.5194/isprsarchives-XL-3-W1-107-2014.
- Schickler, W., and A. Thorpe. 1998. “Operational Procedure for Automatic True Orthophoto Generation.” International Archives of Photogrammetry and Remote Sensing, Stuttgart, September 7–10.
- Sheng, Y., P. Gong, and G. S. Biging. 2003. “True Orthoimage Production for Forested Areas from Large-scale Aerial Photographs.” Photogrammetric Engineering & Remote Sensing 69 (3): 259–266. doi:10.14358/PERS.69.3.259.
- Shi, S., and M. Charlton. 2013. “A New Approach and Procedure for Generalising Vector-Based Maps of Real-World Features.” GIScience and Remote Sensing 50 (4): 473–482.
- Wang, X., and J. Xie. 2012. “A Method for True Orthophoto Generation Based on Projection and Iteration Strategy.” 22nd ISPRS Congress, Melbourne, August 25–September 1. doi:10.5194/isprsannals-I-4-311-2012.
- Wang, Y., S. Schultz, and F. Giuffrida. 2008. “Pictometry’s Proprietary Airborne Digital Imaging System and Its Application in 3D City Modelling.” The International Archives of Photogrammetry, Remote Sensing and Spatial Information Sciences 37 (B1): 1065–1070.
- Wolf, P. R., and B. A. Dewitt. 2000. Elements of Photogrammetry with Applications in GIS. New York: McGraw-Hill.
- Zhong, C., H. Li, Z. Li, and D. Li. 2010. “A Vector-Based Backward Projection Method for Robust Detection of Occlusions When Generating True Ortho Photos.” GIScience & Remote Sensing 47 (3): 412–424. doi:10.2747/1548-1603.47.3.412.
- Zhou, G., W. Schickler, A. Thorpe, P. Song, W. Chen, and C. Song. 2004. “True Orthoimage Generation in Urban Areas with Very Tall Buildings.” International Journal of Remote Sensing 25 (22): 5163–5180. doi:10.1080/01431160410001705079.
- Zhou, G., W. Xie, and P. Cheng. 2008. “Orthoimage Creation of Extremely High Buildings.” IEEE Transactions on Geoscience and Remote Sensing 46 (12): 4132–4141. doi:10.1109/TGRS.2008.2002694.