
Abstract
Defense Meteorological Satellite Program (DMSP)/Operational Linescan System (OLS) nighttime imagery provides a valuable data source for mapping urban areas. However, the spatial extents of large cities are often overestimated because of the effect of over-glow from nighttime light if a fixed thresholding technique is used. In the work reported here, an inside buffer method was developed to solve this issue. The method is based on the fact that the area overestimated is proportional to the extent of the lit area if a fixed threshold is used to extract urban areas in a region/county. Using this method, the extents of urban areas in North China were extracted and validated by interpretations from Landsat Thematic Mapper images. The results showed that the lit areas had a significant linear relationship with the urban areas for 120 representative cities in North China in 2000, with an R2 value of over 0.95. This demonstrates that the inside buffer method can be used to extract urban areas. The validation results showed that the inside buffer model developed in 2000 can be directly used to extract the extent of urban areas using more recent nighttime light imagery. This is of great value for the timely updating of urban area databases in large regions or countries.
1. Introduction
Urban areas currently occupy only a very small fraction of the land surface of the Earth, with estimates ranging from 0.3 to 3.53 million km2 (Pandey, Joshi, and Seto Citation2013); however, 54% of the current world population lives in urban areas (Schneider, Friedl, and Potere Citation2009; UN-DESAPD Citation2014). Projections suggest that another 2.5 billion people will be living in urban areas by 2050, with about 90% of the increase concentrated in Asia and Africa (UN-DESAPD Citation2014). Urbanization and urban growth affect the Earth’s climate, biogeochemical cycles, and ecosystems as a result of increases in the extent of urban surfaces, and the release of anthropogenic greenhouse gases (Tran et al. Citation2006; Lu and Weng Citation2006; Ma, Kuang, and Huang Citation2010; Ma et al. Citation2012). For instance, urban areas contribute 70% of the world’s total carbon dioxide emissions and are responsible for more than 70% of the world’s total energy use (Pandey, Joshi, and Seto Citation2013). The expansion of urban areas has therefore attracted much attention from researchers.
Satellite-based observations with various spatial, temporal, and spectral resolutions have been used to map the patterns and changes of urban areas (Ma et al. Citation2012). These observations have included data from Landsat Thematic Mapper (TM)/Enhanced Thematic Mapper Plus (ETM+) images, SPOT/High Resolution Visible images, and the Moderate Resolution Imaging Spectroradiometer (MODIS). In addition, radar data are also used to estimate human populations and to analyze urban growth (Pandey, Joshi, and Seto Citation2013).
There has been an increasing amount of research into mapping the spatial extent of urban areas using nighttime light images from the Defense Meteorological Satellite Program (DMSP)/Operational Linescan System (OLS) (Imhoff et al. Citation1997; Elvidge et al. Citation2001; Liu et al. Citation2012; Li et al. Citation2013; Wei et al. Citation2014; Zhang, He, and Liu Citation2014; Yu et al. Citation2014; Bagan, Yamagata Citation2015; Shi, Huang, et al. Citation2014). There are several reasons why these data are widely used. First, DMSP/OLS provides a long time series of data, extending from 1992 to the present day (Elvidge et al. Citation2009). Second, with 14 orbits each day, each OLS can generate global daytime and nighttime coverage of the Earth every 24 hours. Third, satellite imagery of nighttime light provides an economical and straightforward way of visualizing the spatial extent of urban areas on global and national scales (Cao et al. Citation2009; Pandey, Joshi, and Seto Citation2013). Therefore, the long-term archives of DMSP/OLS nighttime imagery provide consistent and valuable data sources for investigating urban growth, economic development, and energy consumption, although the data must be inter-calibrated as a result of differences between the sensors used in different years (Amaral et al. Citation2005; Chen and Nordhausa Citation2011; Pandey, Joshi, and Seto Citation2013; Zhang, Schaaf, and Seto Citation2013; Shi, Yu et al. Citation2014; Keola, Andersson, and Hall Citation2015; Shi et al. Citation2015).
The thresholding technique, including global fixed and locally optimized thresholding, is often used to extract urban areas or human settlements from DMSP/OLS data as a result of its simplicity (Imhoff et al. Citation1997; Cao et al. Citation2009; Pandey, Joshi, and Seto Citation2013). However, it has previously been shown that this technique can cause problems, especially when comparing cities of different sizes or at different levels of economic development. In most instances, the spatial extent of large cities will be overestimated as a result of the effects of over-glow, whereas small settlements may be underestimated, resulting in loss of information from the spatial pattern (Su et al. Citation2015). It is therefore extremely difficult to use a single brightness threshold to accurately extract urban areas (Cao et al. Citation2009). To solve this problem, efforts have been made to improve the accuracy of extracting the spatial extent of urban areas (Imhoff et al. Citation1997). For example, to map settlements in southeastern China, Lu et al. (Citation2008) created a human settlement index based on the combined use of multiple remotely sensed data, including DMSP/OLS nighttime light, the MODIS normalized difference vegetation index (NDVI), and ETM+ images. Combining MODIS NDVI data with nighttime lights, Zhang, Schaaf, Seto, et al. (2013) used the vegetation adjusted night-time light urban index to reduce the effects of nighttime light saturation and to strengthen the inter-urban variability of nighttime light values to characterize urban areas. Cao et al. (Citation2009) developed a support vector machine-based region-growing algorithm to semi-automatically extract urban pixels from DMSP/OLS and SPOT NDVI data.
These approaches combine the use of NDVI and DMSP/OLS data to greatly reduce the overestimation of lit areas (Shao and Liu Citation2014; Liu et al. Citation2015; Zhang, Li, and Cai Citation2015). However, in these studies, the significant effects of city size on the overestimation of lit areas are still ignored in the extraction of the extent of urban areas using the nighttime light data (Small, Pozzi, and Elvidge Citation2005; Zhou et al. Citation2014) because some parcels with lower NDVI values, such as bare land, may be wrongly regarded as urban areas at the over-extent of lit areas. This study proposes a different approach to eliminating the effects of the over-glow of nighttime light. This approach first describes the relationship between city size and nighttime light intensity (NTLI) and then measures the over-extent of the lit areas of differently sized cities. The over-extent of differently sized cities is then directly eliminated using an inside buffer model and the urban areas are mapped. This study also quantifies the relationship between the over-extent of data from lit areas and the size of urban areas, which may deepen our understanding of the over-extent of lit areas from nighttime light images.
2. Study area and data
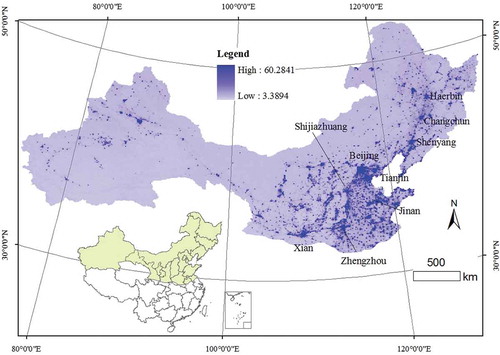
North China was selected as the study area in this work (). As a result of large regional variations in both the physical environment and socioeconomic development, mainland China is traditionally divided into North China and South China, mainly based on differences in the natural environment. This division is bounded by the geographical line of the Huai River and the Qinling Mountains, which approximates the 800 mm average annual rainfall in China.
Figure 1. Map of North China showing the digital number (DN) distribution in 2010. For full colour versions of the figures in this paper, please see the online version.
In this study, land-use data from the years 2000 and 2010 with a spatial resolution of 100 m were obtained from Landsat TM remotely sensed data provided by the Resources and Environment Data Center of the Chinese Academy of Sciences. These data are produced through the visual interpretation of Landsat TM images. An outdoor survey and random sample check verified that the average interpretation accuracy for land use/land cover was >90% (Liu et al. Citation2002; Liu, Liu, and Zhuang Citation2003). Land-use data have previously been used successfully to study land-use changes in China (Tan et al. Citation2005).
Global land-cover data for 2010 at a spatial resolution of 300 m, obtained from the European Space Agency (ESA), were also used to validate the extent of urban areas extracted from the nighttime light data. In this study, artificial surfaces and associated areas from 23 land-cover classes were extracted as a reference map.
The nighttime light data in 1999, 2000, and 2010 with 30 arc second grids of the DMSP/OLS nighttime light data set were obtained from the National Geophysical Data Center website (http://www.ngdc.noaa.gov/eog/dmsp/downloadV4composites.html; accessed October 15, 2014) and included data from two DMSP satellites: F14 and F18. Many constraints were applied to select the highest quality data for entry into the composites. For instance, sunlit data, moonlit data, cloudy data, and light features were excluded. The data were from the center half of the 3000-km-wide OLS swaths, which gives a better geolocation for the data and more consistent radiometry. The intensity of nighttime lights was coded in a grid format as six-bit digital numbers (DNs) ranging from 0 (no light) to 63 (Elvidge et al. Citation2009).
3. Methods
3.1. Inter-calibration
The individual composites of nighttime light data were inter-calibrated using an empirical procedure (Elvidge et al. Citation2009; Bennie et al. Citation2014; Hsu et al. Citation2015). This inter-calibration improves the comparability of the nighttime light data for different years by reducing the differences between sensors. The data from satellite F12 in 1999 had the highest digital values and were therefore used as the reference; data from the other two years were adjusted to match the F12 1999 data range. The nighttime light data were inter-calibrated using the methods developed by Elvidge et al. (Citation2009) and Elvidge et al. (Citation2014) according to the following equation:
where DNadjusted is the adjusted DN and C0, C1, and C2 are coefficients from Elvidge et al. (Citation2014).
3.2. Comparison between lit areas and land-use data
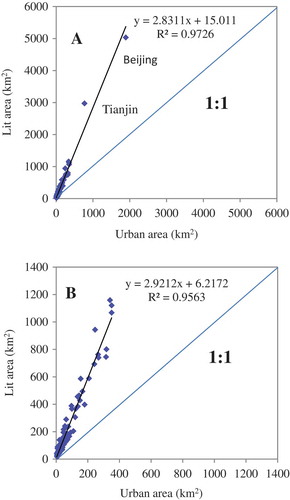
To compare the extent of the urban areas extracted from the nighttime light data with the extent of the urban areas interpreted from Landsat TM images, 120 cities with areas ranging from 6.2 to 1305 km2 were randomly selected ( and Figure S1). An average DN value of 15 was used as a fixed threshold to extract the lit areas because information for all the cities in the study region could be extracted using this threshold value. The results showed that there were significant linear relationships between the extents of the lit areas and urban areas obtained from land-use data (R2 > 0.95). However, the lit areas were much larger than the urban areas obtained from land-use data as a result of the spatial over-extent of the lit area (Small, Pozzi, and Elvidge Citation2005). The area of over-extent is proportional to the size of the city (Zhou et al. Citation2014). This makes it possible to correct for the spatial over-extent and to extract the extent of urban areas using nighttime light data.
Figure 2. (A) Comparison of extent of lit areas and urban areas of 120 representative cities in 2000. (B) Comparison of extent of lit areas and urban areas of the representative cities in 2000, excluding the two largest cities, Beijing and Tianjin. The data for the urban areas were obtained from the Resources and Environment Data Center of the Chinese Academy of Sciences.
3.3. Method for extraction of urban areas for different sizes of city
To examine the relationship between the size of urban areas and the NTLI, I overlapped the land-use map and the nighttime light image for the year 2000. The average DN value for a city is regarded as its NTLI. The NTLI can be calculated using the following equation:
Here, Intensityi is the NTLI of city i and Pixelin is the DN value of pixel n of city i.
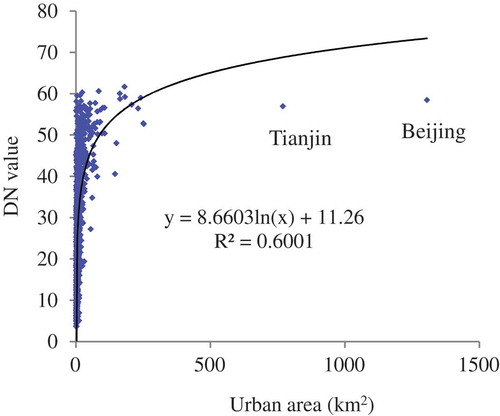
clearly shows that the NTLI had a logarithmic relationship with city size. The value of R2 was about 0.6 for all cities in the study area. Therefore it is very difficult to use a fixed threshold to extract the urban areas for cities of different sizes. However, indicates that there was no significant difference in the NTLIs of some of the large cities, the provincial capitals, with urban areas >160 km2 (e.g. Beijing, Tianjin, Shenyang, Changchun, Haerbin, Xian, Shijiazhuang, Zhengzhou, and Jinan) (). The spatial extents of these cities are very complicated and include some urban parcels separated from the downtown areas. As a result of the over-glow of nighttime light, these urban parcels often merged into the larger built-up areas when a threshold value of 15 was used. For the other cities, the NTLI tended to increase with increasing city size.
Figure 3. Relationship between city size measured as the urban area interpreted from Landsat TM images and the corresponding NTLI in northern China for 120 cities in 2000.
The cities in the study area can therefore be divided into two classes: major provincial cities and other cities. The spatial extents of the major cities can therefore be directly extracted using a threshold value. The threshold value was calculated using the following equation:
where Threshold is the threshold value of the major cities. Intensityi is the intensity of the nighttime light of city i. For the major cities, the average NTLI is 58.
For the other cities, the lit areas were extracted using the lower fixed threshold of 15.0. There is no doubt that the lit areas overestimate the extent of the urban areas for these cities (Table S1 can show this clearly). To reduce this over-extent, an inside buffer method was developed. This method created buffers on the inside of each lit area to directly remove the spatial over-extent of the lit areas. The buffer width (CityR–r) was equal to the difference between the radius of the lit area (CityR) of a city and the corresponding radius of the urban area (Cityr) obtained from the land-use map. The values of CityR and Cityr were calculated using the following equations:
where the areas SR and Sr represent the lit area and the urban area from the land-use map of the city, respectively. The ratio (Ratio) between CityR–r and CityR was then easily calculated using the following equation:
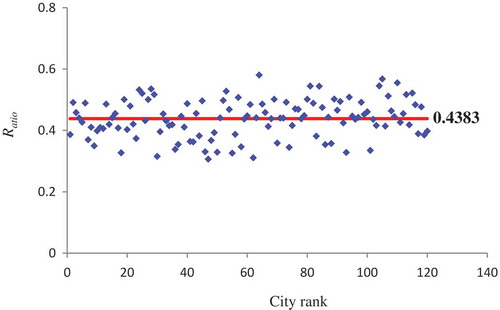
demonstrates that the values of Ratio had no significant relationship with the size of the cities. The values of Ratio fluctuated slightly around an average value of 0.4383 for 120 cities (Table S1). It is therefore convenient to calculate the value of CityR–r only using the value of CityR as follows:
Figure 4. Relationship between the ratios and city ranks of 120 representative cities in the year 2000. Note: the vertical axis refers to the values of Ratio that were calculated according to Equation (7), and the average value for 120 cities was 0.4383. The horizontal axis shows city ranks by size of the urban areas, and the city with the largest area is ranked 1.
where P and SR are the perimeter and area of a lit area, respectively. A lower value means that there is a shorter perimeter and shorter radius for each unit of the lit area, implying that the lit area is more compact. Figure S2 shows the shape indexes of some lit areas. Thus, when the shape of the lit area is taken into consideration, the parameter CityR–r becomes (City(R–r)adjust):
Based on these equations, the values of City(R–r)adjust for all cities except the major provincial cities were calculated. This method is simple and the buffer widths (City(R–r)adjust) for a large number of cities can easily be calculated using ArcGIS software.
In this study, the inside buffer method was used to model not only the urban areas in the year 2000, but also those in the year 2010, because the nighttime light data were comparable after the inter-calibration. The City(R–r)adjust value for each city could therefore be calculated from the shape indices of the lit areas and the average ratios (0.4383) between the values of CityR–r and CityR. The over-extents of the lit areas were thereby eliminated and the size of the urban areas in the year 2010 could be extracted.
4. Results and discussion
4.1. Extraction of urban areas
Using the inside buffer method, the urban areas were extracted from the lit areas for the year 2000. In northern China, the total size of the urban areas was about 24,000 km2, which was similar to the total urban area (22,600 km2) from the land-use map in the year 2000. The main reason for the difference between these results is that some areas of industrial land near the cities were included with the urban areas when extracting the urban areas from the nighttime light data. The proportion of urban areas in northern China (about 0.43% of the total area in 2000) was very low.
Because the differences between sensors had been reduced by inter-calibration (Elvidge et al. Citation2014), this study used the average DN value of 15 as a threshold to extract the extents of lit areas in both 2000 and 2010. The inside buffer method was then used to remove the effects of the over-glow of light, and the extents of the urban areas in 2000 and 2010 were extracted. The results showed that urban areas had expanded quickly during this time period. In northern China, however, the amount of urban area increased by 83% during the period 2000–2010, less than the national average (114%) based on data interpreted from Landsat images (Liu et al. Citation2014).
4.2. Validation of urban areas extracted from 2010 data
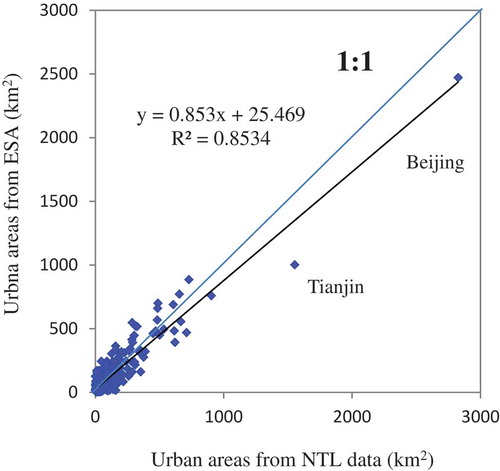
To validate the extent of the urban areas extracted from the lit areas by this method, the urban land-use maps for Beijing, Tianjin, Hebei, and Shandong provinces in 2010 interpreted from Landsat TM images were used as reference data, taking into account the availability of data. By comparing the extent of urban areas modeled by this study with the extent of urban areas from the land-use map at the county level, I found that the relationship between them was statistically significant and that the R2 value was about 0.95 (). This study compares the extent of urban areas for large, medium, and small cities. and show the extents of urban areas for Beijing and Tianjin, respectively. The two maps both demonstrate that the extents of the urban areas of these large cities agreed well with the reference maps. shows similar results for medium and small cities – that is, the extent of urban areas modeled by this study approximated the extent of urban areas from the land-use maps. The spatial accuracy of the results was assessed quantitatively using a confusion matrix. The results showed that the overall accuracy was 89.84% and that the omission error and commission error were 0.89 and 13.31%, respectively. Similarly, the study by Shi, Huang, and Yu et al. (Citation2014), using nighttime light imagery to extract 12 large cities in China, shows that the overall accuracies vary between 82.87% and 97.98%. The commission error was very low. This may be because the nighttime light data in this study were only classified into two types: urban areas and non-urban areas. This study also validated the extent of urban areas extracted from nighttime light data using a global land-cover product from the ESA in 2010 at a spatial resolution of 300 m. shows that there was a linear relationship between these areas, with an R2 value of about 0.85. These results and their validation demonstrates that the method used in 2000 was still valid for extracting the extent of urban areas during the following decade.
Figure 5. Comparison of extents of urban areas modeled by this study and the extent of urban areas from the land-use map at the county level in the region including Beijing, Tianjin, Hebei, and Shandong provinces in 2010. Source: the land-use map is from the Resources and Environment Data Center of the Chinese Academy of Sciences.
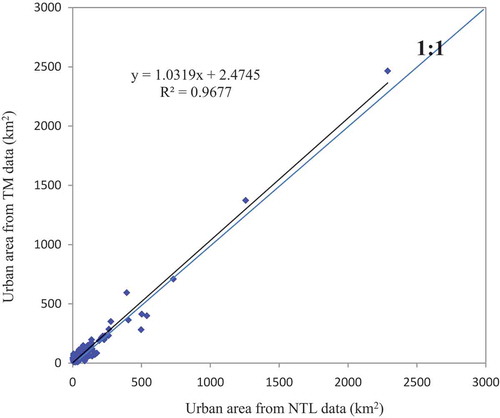
Figure 6. Urban areas modeled by this study and urban areas from the land-use map in Beijing in 2010. Source: the land-use map is from the Resources and Environment Data Center of the Chinese Academy of Sciences.
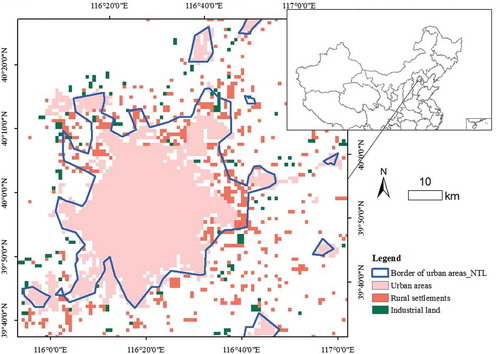
Figure 7. Urban areas modeled by this study and urban areas from the land-use map in Tianjin in 2010. Source: the land-use map is from the Resources and Environment Data Center of the Chinese Academy of Sciences.
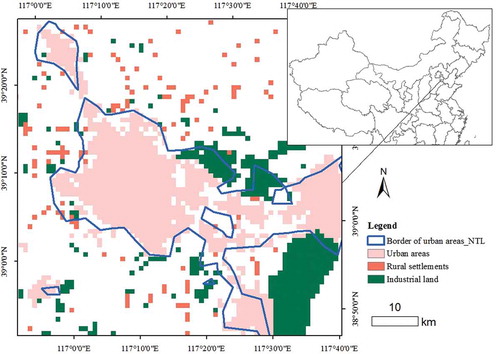
Figure 8. Urban areas modeled by this study and urban areas from the land-use map of medium and small cities or towns in 2010. Note: Jinan city, as the capital of Shandong province, was extracted from nighttime light imagery using the fixed threshold value of 58. Source: the land-use map is from the Resources and Environment Data Center of the Chinese Academy of Sciences.
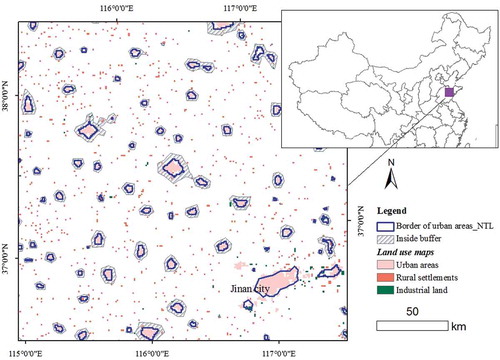
Figure 9. Comparison of the extent of urban areas modeled by this study and the extent of urban areas from the land-cover map obtained from the European Space Agency at the county level in North China in 2010.
4.3. Discussion
shows that there is a relationship between city size and the average DN value that can be described using a logarithmic function. The average value tended to be larger in larger cities. As a result, using a fixed threshold to extract the extent of urban areas in a region/country may overestimate the spatial extent of large cities (Small, Pozzi, and Elvidge Citation2005). By randomly selecting 120 cities in northern China in the year 2000, this study found that there was a significant linear relationship between the lit areas and the urban areas interpreted from the Landsat TM images (R2 about 0.95) and that the lit areas were much larger than the urban areas. This is similar to the results of a previous study in which a comparison of a lit area with the over-extent for 10 lit islands suggested a linear proportionality of 1.25 of lit area to the diameter of the urban areas estimated from Landsat imagery (Small, Pozzi, and Elvidge Citation2005). These results provide a substantial basis for developing a scale-dependent over-extent correction method to eliminate over-glow effects. This study used ArcGIS software with negative buffer values, which depended only on the area and shape of lit areas. In northern China, on average, the buffer width (City(R–r)adjust) of all cities was about 0.31 of the radius of its lit area, taking into consideration the effects of the shape of the lit area, if using the average value of the NTLI (15) as a fixed threshold to extract the lit areas in the study region. Furthermore, the validation results in 2010 showed that the inside buffer model developed in 2000 can also be directly used to extract the extent of urban areas using more recent nighttime light imagery, according to only the radii and shape indices of lit areas and the average ratios between the values of CityR-r and CityR, if the nighttime light data have been calibrated. This may be of great value for the timely updating of urban area databases in large regions or countries.
This method can be used to extract the extent of urban areas in other countries or regions. However, because the level of economic development may affect the nighttime light intensity, the threshold value for extracting lit areas for all cities may vary across countries. Therefore, it is necessary to validate the ratios between the values of CityR–r and CityR using reference data. Since these global land-cover data with a resolution of 300 m from the ESA can be freely downloaded, they can also be used as a reference map to calibrate nighttime light imagery in other countries or regions.
5. Conclusions
Many studies have mapped the extent of urban areas using nighttime light imagery. However, it is very difficult to use a fixed light threshold to extract the extent of urban areas, because the threshold may overestimate the urban extent. To overcome this problem, an inside buffer method was developed, the two main steps of which were as follows:
For the major provincial cities, there was no significant difference in the NTLI. The average NTLI value was about 58. Therefore, the spatial extents of these cities could be extracted using this threshold value.
For the other cities, buffers were created on the inside of each lit area to remove the over-glow effect.
This method has been developed based on the following information. If the average value of the NTLI (15) was used as a fixed threshold to extract the lit areas, the extracted lit area had a significant linear relationship with the land-use data interpreted from Landsat TM images in the year 2000 and R2 > 0.95. This means that the over-extent area of a city is proportional to its size. This study also found that the ratio between the radii of lit areas and the inside buffer widths had no significant relationship with the sizes of the cities and fluctuated slightly around a constant value (0.4383). This implies that the inside buffer widths can be easily calculated using this constant value, together with the radii and shape indices of the lit areas.
Using this method, patterns of urbanization in the study area were extracted for the years 2000 and 2010. The urban patterns were validated by land-use maps interpreted from Landsat TM imagery. The extent of the urban area extracted from the lit areas had a significant linear relationship with the urban areas extracted from land-use data at the county level (R2 > 0.95) in the study region in 2010. The validation results showed that the inside buffer model developed for data from the year 2000 can be used to extract the extent of urban areas from the lit areas using more recent nighttime light imagery because the differences between the sensors have been reduced by inter-calibration, thereby allowing direct inter-year comparison of the nighttime lights data.
Highlights
Overestimated area is proportional to the extent of the lit area
Using inside buffer method to remove over-glow effect of nighttime light
Inside buffer is calculated considering the shape indexes of lit areas
Inside buffer model can be used to extract extent of urban areas in the next decade
supplementary_material.docx
Download MS Word (224.2 KB)Acknowledgments
Valuable suggestions and comments from anonymous reviewers are greatly appreciated.
Disclosure statement
No potential conflict of interest was reported by the author.
Supplemental data
Supplemental data for this article can be accessed here.
Additional information
Funding
Related Research Data
References
- Amaral, S., G. Câmara, A. M. V. Monteiro, J. A. Quintanilha, and C. D. Elvidge. 2005. “Estimating Population and Energy Consumption in Brazilian Amazonia Using DMSP Night-Time Satellite Data.” Computers, Environment and Urban Systems 29 (2): 179–195. doi:10.1016/j.compenvurbsys.2003.09.004.
- Bagan, H., and Y. Yamagata. 2015. “Analysis of Urban Growth and Estimating Population Density Using Satellite Images of Nighttime Lights and Land-Use and Population Data.” GIScience & Remote Sensing 52: 765–780. doi:10.1080/15481603.2015.1072400.
- Bennie, J., T. W. Davies, J. P. Duffy, R. Inger, and K. J. Gaston. 2014. “Contrasting Trends in Light Pollution across Europe Based on Satellite Observed Nighttime Lights.” Scientific Reports, no. 4: 3789. doi:3710.1038/srep03789.
- Cao, X., J. Chen, H. Imura, and O. Higashi. 2009. “A SVM-Based Method to Extract Urban Areas from DMSP-OLS and SPOT VGT Data.” Remote Sensing of Environment 113 (10): 2205–2209. doi:10.1016/j.rse.2009.06.001.
- Chen, X., and W. D. Nordhausa. 2011. “Using Luminosity Data as a Proxy for Economic Statistics.” Proceedings of the National Academy of Sciences 108 (21): 8589–8594. doi:10.1073/pnas.1017031108.
- Elvidge, C. D., E.-C. Hsu, K. E. Baugh, and T. Ghosh. 2014. “National Trends in Satellite Observed Lighting: 1992-2012.” In Global Urban Monitoring and Assessment Through Earth Observation, edited by Q. Weng. Boca Raton, FL: CRC Press.
- Elvidge, C. D., M. L. Imhoff, K. E. Baugh, V. R. Hobson, I. Nelson, J. Safran, J. B. Dietz, and B. T. Tuttle. 2001. “Night-Time Lights of the World: 1994–1995.” ISPRS Journal of Photogrammetry and Remote Sensing 56 (2): 81–99.
- Elvidge, C. D., D. Ziskin, K. E. Baugh, B. T. Tuttle, T. Ghosh, D. W. Pack, E. H. Erwin, and M. Zhizhin. 2009. “A Fifteen Year Record of Global Natural Gas Flaring Derived from Satellite Data.” Energies 2: 595–622.
- Hsu, F.-C., K. E. Baugh, T. Ghosh, M. Zhizhin, and C. D. Elvidge. 2015. “DMSP-OLS Radiance Calibrated Nighttime Lights Time Series with Intercalibration.” Remote Sensing 7: 1855–1876. doi:10.3390/rs70201855.
- Imhoff, M. L., W. T. Lawrence, D. C. Stutzer, and C. D. Elvidget. 1997. “A Technique for Using Composite DMSP/OLS“City Lights” Satellite Data to Map Urban Area.” Remote Sensing of Environment 61: 361–370. doi:10.1016/S0034-4257(97)00046-1.
- Keola, S., M. Andersson, and O. Hall. 2015. “Monitoring Economic Development from Space: Using Nighttime Light and Land Cover Data to Measure Economic Growth.” World Development 66: 322–334. doi:10.1016/j.worlddev.2014.08.017.
- Li, X., X. Chen, Y. Zhao, J. Xu, F. Chen, and H. Li. 2013. “Automatic Intercalibration of Nighttime Light Imagery Using Robust Regression.” Remote Sensing of Letters 4 (1): 45–54.
- Liu, J., W. Kuang, Z. Zhang, X. Xu, Y. Qin, J. Ning, and W. Zhou, 2014. “Spatiotemporal Characteristics, Patterns, and Causes of Land-Use Changes in China since the Late 1980s.” Journal of Geographical Sciences 24 (2): 195–210.
- Liu, J., M, Liu, X. Deng, D. Zhuang, Z. Zhang, and D. Luo. 2002. “The Land Use and Land Cover Change Database and Its Relative Studies in China.” Journal of Geographical Sciences 12 (3): 275–282. doi:10.1007/BF02837545.
- Liu, J., M. Liu, and D. Zhuang. 2003. “Study on Spatial Pattern of Land-Use Change in China during 1995-2000, Science in China (Series D).” Science in China (Series D) 46 (4): 373–384.
- Liu, Y., Y. Wang, J. Peng, Y. Du, X. Liu, S. Li, and D. Zhang. 2015. “Correlations between Urbanization and Vegetation Degradation across the World’s Metropolises Using DMSP/OLS Nighttime Light Data.” Remote Sensing 7: 2067–2088. doi:10.3390/rs70202067.
- Liu, Z., C. He, Q. Zhang, Q. Huang, and Y. Yang. 2012. “Extracting the Dynamics of Urban Expansion in China Using DMSP-OLS Nighttime Light Data from 1992 to 2008.” Landscape and Urban Planning 106 (1): 62–72. doi:10.1016/j.landurbplan.2012.02.013.
- Lu, D., H. Tian, G. Zhou, and H. Ge. 2008. “Regional Mapping of Human Settlements in Southeastern China with Multisensor Remotely Sensed Data.” Remote Sensing of Environment 112: 3668–3679. doi:10.1016/j.rse.2008.05.009.
- Lu, D., and Q. Weng. 2006. “Spectral Mixture Analysis of ASTER Images for Examining the Relationship between Urban Thermal Features and Biophysical Descriptors in Indianapolis, Indiana, USA.” Remote Sensing of Environment 104: 157–167. doi:10.1016/j.rse.2005.11.015.
- Ma, T., C. Zhou, T. Pei, S. Haynie, and J. Fan. 2012. “Quantitative Estimation of Urbanization Dynamics Using Time Series of DMSP/OLS Nighttime Light Data: A Comparative Case Study from China’s Cities.” Remote Sensing of Environment 124: 99–107. doi:10.1016/j.rse.2012.04.018.
- Ma, Y., Y. Kuang, and N. Huang. 2010. “Coupling Urbanization Analyses for Studying Urban Thermal Environment and Its Interplay with Biophysical Parameters Based on TM/ETM+ Imagery.” International Journal of Applied Earth Observation and Geoinformation 12: 110–118. doi:10.1016/j.jag.2009.12.002.
- Pandey, B., P. K. Joshi, and K. C. Seto. 2013. “Monitoring Urbanization Dynamics in India Using DMSP/OLS Night Time Lights and SPOT-VGT Data.” International Journal of Applied Earth Observation and Geoinformation 23: 49–61.
- Schneider, A., M. A. Friedl, and D. Potere. 2009. “A New Map of Global Urban Extent from MODIS Satellite Data.” Environmental Research Letters 4: 044003. doi:10.1088/1748-9326/4/4/044003.
- Shao, Z., and C. Liu. 2014. “The Integrated Use of DMSP-OLS Nighttime Light and MODIS Data for Monitoring Large-Scale Impervious Surface Dynamics: A Case Study in the Yangtze River Delta.” Remote Sensing 6: 9359–9378. doi:10.3390/rs6109359.
- Shi, K., C. Huang, B. Yu, B. Yin, Y. Huang, and J. Wu. 2014. “Evaluation of NPP-VIIRS Nighttime Light Composite Data for Extracting Built-Up Urban Areas.” Remote Sensing Letters 5 (4): 358–366. doi:10.1080/2150704X.2014.905728.
- Shi, K., B. Yu, Y. Hu, C. Huang, Y. Chen, Y. Huang, Z. Chen, and J. Wu. 2015. “Modeling and Mapping Total Freight Traffic in China Using NPP-VIIRS Nighttime Light Composite Data.” GIScience & Remote Sensing 52 (3): 274–289. doi:10.1080/15481603.2015.1022420.
- Shi, K., B. Yu, Y. Huang, Y. Hu, B. Yin, Z. Chen, L. Chen, and J. Wu. 2014. “Evaluating the Ability of NPP-VIIRS Nighttime Light Data to Estimate the Gross Domestic Product and the Electric Power Consumption of China at Multiple Scales: A Comparison with DMSP-OLS Data.” Remote Sensing 6 (2): 1705–1724. doi:10.3390/rs6021705.
- Small, C., F. Pozzi, and C. D. Elvidge. 2005. “Spatial Analysis of Global Urban Extent from DMSP-OLS Night Lights.” Remote Sensing of Environment 96 (3–4): 277–291.
- Su, Y., X. Chen, C. Wang, H. Zhang, J. Liao, Y. Ye, and C. Wang. 2015. “A New Method for Extracting Built-Up Urban Areas Using DMSP-OLS Nighttime Stable Lights: A Case Study in the Pearl River Delta, Southern China.” GIScience & Remote Sensing 52 (2): 218–238. doi:10.1080/15481603.2015.1007778.
- Tan, M., X. Li, H. Xie, and C. Lu. 2005. “Urban Land Expansion and Arable Land Loss in China: A Case Study of Beijing-Tianjin-Hebei Region.” Land Use Policy 22 (3): 187–196. doi:10.1016/j.landusepol.2004.03.003.
- Tan, M., X. Li, C. Lu, W. Luo, X. Kong, and S. Ma. 2008. “Urban Population Densities And Their Policy Implications in China.” Habitat International 32: 471–484. doi:10.1016/j.habitatint.2008.01.003.
- Tran, H., D. Uchihama, S. Ochi, and Y. Yasuoka. 2006. “Assessment with Satellite Data of the Urban Heat Island Effects in Asian Mega Cities.” International Journal of Applied Earth Observation and Geoinformation 8 (1): 34–48. doi:10.1016/j.jag.2005.05.003.
- UN-DESAPD, United Nations Department of Economic and Social Affairs Population Division. 2014. “2014 Revision of the World Urbanization Prospects.” http://www.un.org/en/development/desa/publications/2014-revision-world-urbanization-prospects.html
- Wei, Y., H. Liu, W. Song, B. Yu, and C. Xiu. 2014. “Normalization of Time Series DMSP-OLS Nighttime Light Images for Urban Growth Analysis with Pseudo Invariant Features.” Landscape and Urban Planning 128: 1–13. doi:10.1016/j.landurbplan.2014.04.015.
- Yu, B., S. Shu, H. Liu, W. Song, J. Wu, L. Wang, and Z. Chen. 2014. “Object-Based Spatial Cluster Analysis of Urban Landscape Pattern Using Nighttime Light Satellite Images: A Case Study of China.” International Journal of Geographical Information Science 28 (11): 2328–2355. doi:10.1080/13658816.2014.922186.
- Zhang, Q., C. He, and Z. Liu. 2014. “Studying Urban Development and Change in the Contiguous United States Using Two Scaled Measures Derived from Nighttime Lights Data and Population Census.” GIScience & Remote Sensing 51 (1): 63–82. doi:10.1080/15481603.2014.883212.
- Zhang, Q., C. Schaaf, and K. C. Seto. 2013. “The Vegetation Adjusted NTL Urban Index: A New Approach to Reduce Saturation and Increase Variation in Nighttime Luminosity.” Remote Sensing of Environment 129: 32–41.
- Zhang, X., P. Li, and C. Cai. 2015. “Regional Urban Extent Extraction Using Multi-Sensor Data and One-Class Classification.” Remote Sensing 7: 7671–7694.
- Zhou, Y., S. J. Smith, C. D. Elvidge, K. Zhao, A. Thomson, and M. Imhoff. 2014. “A Cluster-Based Method to Map Urban Area from DMSP/OLS Nightlights.” Remote Sensing of Environment 147: 173–185.