
Abstract
Drought is a natural climatic phenomenon that occurs throughout the world and impacts many sectors of society. To help decision-makers reduce the impacts of drought, it is important to improve monitoring tools that provide relevant and timely information in support of drought mitigation decisions. Given that drought is a complex natural hazard that manifests in different forms, monitoring can be improved by integrating various types of information (e.g., remote sensing and climate) that is timely and region specific to identify where and when droughts are occurring. The Vegetation Drought Response Index for Canada (VegDRI-Canada) is a recently developed drought monitoring tool for Canada. VegDRI-Canada extends the initial VegDRI concept developed for the conterminous United States to a broader transnational coverage across North America. VegDRI-Canada models are similar to those developed for the United States, integrating satellite observations of vegetation status, climate data, and biophysical information on land use and land cover, soil characteristics, and other environmental factors. Collectively, these different types of data are integrated into the hybrid VegDRI-Canada to isolate the effects of drought on vegetation. Twenty-three weekly VegDRI-Canada models were built for the growing season (April–September) through the weekly analysis of these data using a regression tree-based data mining approach. A 15-year time series of VegDRI-Canada results (s to 2014) was produced using these models and the output was validated by randomly selecting 20% of the historical data, as well as holdout year (15% unseen data) across the growing season that the Pearson’s correlation ranged from 0.6 to 0.77. A case study was also conducted to evaluate the VegDRI-Canada results over the prairie region of Canada for two drought years and one non-drought year for three weekly periods of the growing season (i.e., early-, mid-, and late season). The comparison of the VegDRI-Canada map with the Canadian Drought Monitor (CDM), an independent drought indicator, showed that the VegDRI-Canada maps depicted key spatial drought severity patterns during the two targeted drought years consistent with the CDM. In addition, VegDRI-Canada was compared with canola yields in the Prairie Provinces at the regional scale for a period from 2000 to 2014 to evaluate the indices’ applicability for monitoring drought impacts on crop production. The result showed that VegDRI-Canada values had a relatively higher correlation (i.e., r > 0.5) with canola yield for nonirrigated croplands in the Canadian Prairies region in areas where drought is typically a limiting factor on crop growth, but showed a negative relationship in the southeastern Prairie region, where water availability is less of a limiting factor and in some cases a hindrance to crop growth when waterlogging occurs. These initial results demonstrate VegDRI-Canada’s utility for monitoring drought-related vegetation conditions, particularly in drought prone areas. In general, the results indicated that the VegDRI-Canada models showed sensitivity to known agricultural drought events in Canada over the 15-year period mainly for nonirrigated areas.
Introduction
Monitoring drought stress of vegetation is a critical component of proactive drought planning. Systematic approaches that characterize the spatial extent, intensity, and duration of drought-related vegetation stress provide essential information for a wide range of management and planning decisions (Wardlow et al. Citation2012). In addition, accurate and timely agricultural drought monitoring is essential to understand each drought event, including its progression and potential impacts, and to provide information to support drought mitigation decisions. For example, the 2001–2002 drought had devastating impacts on Canada’s agricultural sector, causing about $5.8 billion in Gross Domestic Product losses (Wheaton et al. Citation2008). Such extreme drought events need more proactive approaches to reduce the impacts using improved drought monitoring tools.
Given the complexity of drought, monitoring can be improved by integrating relevant types of information that is both timely and region specific to identify where and when droughts are happening. This information allows decision-makers to implement best management practices under varying drought conditions to reduce drought vulnerability and take appropriate mitigation actions. For example, agricultural producers and water resource managers could use the information in monitoring pasture productivity and stocking rates or adjusting crop irrigation schedules. Traditionally, climate and point-based weather station data have been the primary sources for drought information used to support decision-making. However, over the past 30 years, satellite observations have provided near-daily global coverage that provide an alternative perspective from ground-based observations that improved spatially continuous information across the landscape for monitoring and characterizing vegetation dynamics over large areas (Hayes et al. Citation1999; Tadesse, Brown, and Hayes Citation2005). For example, satellite-based observations from global imagers such as the Advanced Very High Resolution Radiometer (AVHRR) have been used for vegetation monitoring since the early 1980s. More recently, satellite-based sensors such as the MODerate resolution Imaging Spectroradiometer (MODIS) have been widely used for large-area monitoring of vegetation conditions (Wardlow and Egbert Citation2008; Lunetta et al. Citation2006; Loveland et al. Citation2000; DeBeurs and Henebry Citation2004). These imagers acquire near-daily global observations of the earth’s land surface, which provide continuous spectral measures across the landscape for vegetation assessments. The analysis of satellite-based vegetation indices such as the normalized difference vegetation index (NDVI), which is calculated from the multispectral data collected by these instruments, has been the standard for national to global-scale vegetation mapping and monitoring for more than three decades (Tucker, Townshend, and Goff Citation1985; Baret and Guyot Citation1991; Asner, Townsend, and Braswell Citation2000; Bayarjargala et al. Citation2006). In addition, several other satellite-based vegetation indices (VIs) have been developed to improve on the NDVI for vegetation monitoring. These include the Enhanced Vegetation Index (EVI; Huete et al. Citation2006), which minimizes atmospheric and background effects and extends index sensitivity over higher biomass areas; the Wide Dynamic Range Vegetation Index (WDRVI; Gitelson Citation2004) to estimate the leaf area index of vegetation; the normalized difference water index (NDWI) (Gao Citation1996; Gu et al. Citation2007); and the Vegetation Condition Index (VCI; Kogan Citation1990), which compares how current conditions relate to historical minimum and maximum conditions.
Collectively, this body of research illustrates the value of satellite observations for improving our capabilities to monitor the vegetation conditions over large areas. However, there are some limitations for using satellite VI data alone for drought monitoring. For example, differentiating drought-impacted areas from other locations experiencing vegetation stress due to flooding, hail, pests, and plant disease can be difficult using satellite VI data only. In addition, establishing appropriate thresholds that discriminate between drought and non-drought conditions, as well as varying levels of drought stress (e.g., moderate, severe, and extreme) is challenging. This indicates that an improved drought monitoring index that integrates satellite data with climate and other environmental factors (e.g., land cover) is essential for agricultural drought monitoring since it links the impacts (e.g., vegetation health and crop damage) with main causes (e.g., drought).
An integration of remotely sensed data with climate and other relevant environmental variables that influence vegetation holds considerable potential for improving our capabilities to identify and monitor drought stress on vegetation (Tadesse et al. Citation2010; Eidenshink Citation2006; Ji and Peters Citation2003; Funk and Brown Citation2006; Braun, Balzter, and Kohler Citation2000). Various high-quality environmental datasets (e.g., climate and remote sensing measurements) with increasing length of records (i.e., >15 years) are now available to develop new drought and vegetation monitoring techniques (Tadesse et al. Citation2010; Brown et al. Citation2008). For example, the global coverage of MODIS data now has a 17-year historical time-series of high spatial resolution (500 m or higher) observations that can be used for long-term vegetation assessment. These satellite observations can be coupled with longer historical records of climate data (e.g., more than 50 years of climate data) to monitor the vegetation conditions. In addition, the emergence of data mining techniques such as regression tree analysis has allowed diverse sets of environmental data to be collectively analyzed to identify historical spatial and temporal patterns among the data, which can be effectively integrated into hybrid vegetation-related models such as the Vegetation Drought Response Index (VegDRI) (Brown et al. Citation2008).
The VegDRI (http://vegdri.unl.edu/) is a drought monitoring tool developed for the continental United States that leverages the strengths of remote sensing-based NDVI and climate-based drought index approaches, which have commonly been used for drought monitoring, to produce 1-km resolution maps that characterize the intensity and spatial pattern of drought-induced vegetation stress over large areas (Brown et al. Citation2008; Tadesse et al. Citation2010). For the remote sensing component, the initial development of VegDRI was based on the AVHRR NDVI time series that has a lengthy historical record dating back to 1989. The 1-km NDVI images provide detailed spatial patterns of vegetation conditions, which are analyzed in combination with dryness information represented by climate-based drought index data calculated from in situ observations (spatially interpolated to grid), to identify and characterize the intensity and spatial extent of drought conditions. Biophysical parameters such as land cover type, soil-available water holding capacity, irrigation status, and ecological setting provide useful ancillary information, as these characteristics can influence climate–vegetation interactions. Since 2009, the VegDRI maps have been produced operationally every 2 weeks (weekly since 2014 using both AVHRR and MODIS VI data inputs) over the conterminous United States (CONUS), providing regional to sub-county scale information about the effects of drought on vegetation. VegDRI maps and data have been used in the United States for supporting agricultural management decisions (e.g., identifying locations to move livestock for grazing), assessing rangeland conditions to determine locations that may have hay surpluses or deficits, providing subcounty information on drought conditions to justify disaster assistance, assessing fire risk, and managing irrigation. VegDRI has been increasingly used to better characterize agricultural drought in the U.S. Drought Monitor (USDM) (Svoboda et al., Citation2002), which is linked to many federal and state-level decision-making activities that require such county to subcounty drought characterizations for drought assistance programs. It is also used as complementary information to assist in determining annual cattle stocking rates and as a source of supplemental data for federal agencies to better assess crop and rangeland conditions for their various programs. Based on this experience, extending the VegDRI model to cover Canada has strong potential to benefit both the North American Drought Monitor (NADM) and domestic programs in Canada, such as the Canadian Drought Monitor, Livestock Tax Deferral Assessment, and Climate Related Production Risk (CRPR) reporting (Champagne et al. Citation2015; Chipanshi et al. Citation2013). In addition, recently developed models that could complement the VegDRI include the Scaled Drought Condition Index (Rhee, Im, and Carbone Citation2010), a comprehensive index for assessment of agro-drought severity (Gao et al. Citation2008), the Microwave Integrated Drought Index (Zhang and Jia Citation2013), and the Synthesized Drought Index (Du et al. Citation2013) as well as an integrated method to monitor soil moisture anomalies (Anderson et al. Citation2012) from “Triple Collocation Analysis” based on merging of AMSR-E (Zwieback et al. Citation2012), Atmosphere-Land Exchange Inverse surface energy balance algorithm (Anderson et al. Citation2010), Multivariate Standardized Drought Index (Hao and AghaKouchak Citation2013), and the Noah Land Surface Model (Ek Citation2003).
This paper presents the first results of a new MODIS-based drought monitoring tool called the Vegetation Drought Response Index for Canada (VegDRI-Canada), which builds upon the initial index developed by Brown et al. (Citation2008) for the CONUS. While the U.S. VegDRI models use the AVHRR-based NDVI data, in this study, the MODIS-based NDVI data was used for VegDRI-Canada because (i) the MODIS dataset, based on surface reflectance data collected by MODIS, is of higher quality than the AVHRR NDVI due to its rigorous atmospheric correction and high geometric accuracy (Gallo et al. Citation2004), (ii) the follow-on sensor to the AVHRR, the Visible/Infrared Imager/Radiometer Suite (VIIRS), is very similar to the MODIS sensor (Justice et al. Citation2013; Shabanov et al. Citation2015), and (iii) weekly MODIS NDVI is also currently used in operational monitoring of agricultural conditions in Canada (Davidson Citation2015; Kouadio et al. Citation2014). These datasets would enable the operational implementation of VegDRI-Canada. In this paper, the VegDRI-Canada methodology is presented and tested over three targeted years (two drought years and one non-drought year). For each year, the model results were evaluated for three weekly periods of the growing season to evaluate the performance of the index during the early, middle, and late growing season. The intent of this paper is to introduce the VegDRI-Canada methodology and present initial results from a case study conducted for drought and non-drought years over the prairie region of Canada to demonstrate VegDRI-Canada’s utility for monitoring agricultural drought conditions. In partnership with the National Drought Mitigation Center (NDMC) and U.S. Geological Survey (USGS) on model development and implementation, Agriculture and Agri-Food Canada (AAFC) will produce routine maps of this data set in the future and distribute these publicly through the National Agroclimate Information Service.
Materials and methods
Study area
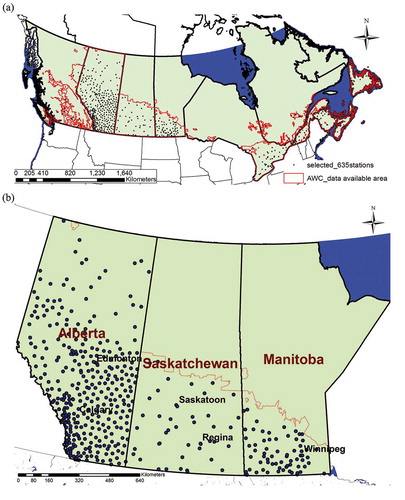
The VegDRI-Canada models were developed over the Canadian territory south of 60°N ()). The availability and geographic extent of ground and satellite observations were the main drivers in selecting this study area. The evaluation of the VegDRI-Canada models/maps in this study was focused mainly on the agricultural regions of the Canadian Prairies ()), which include three provinces (i.e., Alberta, Saskatchewan, and Manitoba) with dense weather station observations and agricultural data. The Canadian prairie region contains a large portion of the annual cropland in Canada and is primarily composed of rainfed cropping systems with high annual rainfall variability. About 80% of Canada’s farmland is located on the prairies region (The Canadian Encyclopedia (TCE) Citation2016). The major crops grown include wheat, oats, barley, rye, flax, canola, mustard and sunflowers, and wheat and canola occupy about two-thirds of the total cropland area (Statistics Canada Citation2012). Because of its large importance to the region’s agricultural economy, and the availability of a complete historical record of crop yields, the relationship between VegDRI-Canada and canola yields was examined. Precipitation across this region of Canada ranges from 300 to 500 mm (Environment Canada Citation2016). The region is characterized by semiarid to subhumid climate and rich soils that support agricultural production (Champagne et al. Citation2012). Cropland across the Canadian Prairies covers about 300,000 sq. km (30 million ha), which is more than 30% of the region (Mkhabela et al. Citation2011). The region provides a diverse study area in terms of land cover types, land use practices, and climatic conditions across which to test the capability of the VegDRI-Canada methodology.
Figure 1 (a) The 635 weather stations (dots on the map) used for VegDRI-Canada model development. The red line shows the extent of the VegDRI-Canada model development. (b) The prairie region of Canada that includes Alberta, Saskatchewan, and Manitoba was selected for model evaluation. For full color versions of the figures in this paper, please see the online version.
Input data and method for VegDRI-Canada model development
An overview of the VegDRI-Canada input data, model development processes, and final map generations is shown in . The VegDRI-Canada methodology was adapted from the U.S. VegDRI approach (Tadesse et al. Citation2015a; Brown et al. Citation2008) in an effort to produce information consistent with the U.S. maps. During development of the VegDRI-Canada model, each input variable () was processed, summarized, and organized into a training database.
Figure 2. The VegDRI-Canada model inputs, process, development, and production of maps.
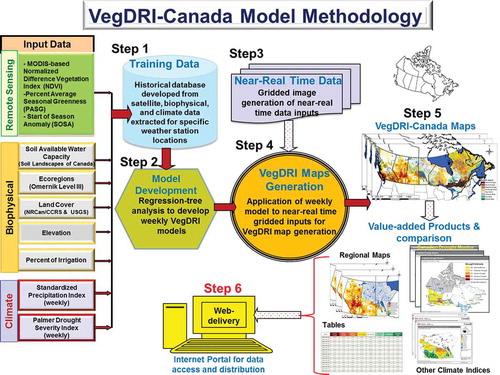
As shown in , the VegDRI-Canada model development and implementation process includes five main steps: (1) extracting training data from gridded data input variables (e.g., NDVI, land cover/land use, and soils) and combining them with tabular historical climate data in the database for each weather station location, (2) developing empirically derived VegDRI-Canada models for each weekly period by applying a classification and regression tree (CART) analysis technique to the historical information in the database, (3) generating gridded images for historical and current data inputs, (4) applying the weekly VegDRI-Canada models to the gridded geospatial data to produce VegDRI-Canada maps over the study area domain, and (5) comparing with other climate indices and Canadian Drought Monitor maps as well as using historical crop yield for assessment to provide value added information. In the future (step 6), these products will be disseminated to the general public in various ways, including an internet portal for data access and distribution ().
The VegDRI-Canada map shows seven general vegetation condition classes (left columns in ) ranging from favorably good conditions to extreme drought stress. These classes are based on the Palmer Drought Severity Index (PDSI) classification scheme (Palmer Citation1965). For the operational map, a “Pre-Drought” class (right column in ) was also added to indicate drier than normal condition that may preclude drought emergence. The input data that are shown in are briefly described below.
Table 1. VegDRI-Canada classes: The operational classes (second column) show 8 categories that include “pre-drought,” and the seven basic classes are shown in the fourth column.
Climate data inputs
Climate is one of the most important factors influencing the growth and condition of vegetation (Tadesse et al. Citation2010; Braun, Balzter, and Kohler Citation2000). Traditionally, climate-based drought indicators such as the PDSI and the Standardized Precipitation Index (SPI) have been used for drought monitoring (Wilhite Citation2000; Hayes et al. Citation1999; Wells, Goddard, and Hayes Citation2004). Thus, two commonly applied climatic indices for drought monitoring were used in the VegDRI-Canada model:
Self-Calibrated Palmer Drought Severity Index (PDSIsc) Data: The PDSIsc indicates how the soil moisture compares with normal conditions and is calculated based on parameters including precipitation, temperature, and soil moisture conditions (Palmer Citation1965). This index provides a measure of the long-term intensity and duration of drought conditions derived from the precipitation and temperature anomalies and their combined effects on soil water availability to plants. For the VegDRI model in the United States, historical records of PDSIsc data for each weather station were calculated using the PDSIsc algorithm developed by Wells, Goddard, and Hayes (Citation2004). The PDSIsc data have a value range from –8.0 to +8.0, and served as the dependent variable to classify drought severity in the VegDRI models. The PDSIsc was selected as the dependent variable for the original VegDRI model for three primary reasons (Brown et al. Citation2008): (1) unlike other climate-based drought indices, the PDSIsc accounts for the effect of both precipitation and temperature on drought conditions, (2) the PDSIsc scale has widely known classes among the drought community to identify multiple levels of drought severity (e.g., moderate, severe, and extreme), and (3) the PDSIsc is a well-recognized drought severity classification scheme. As a result, the VegDRI implements a PDSI-like classification scheme familiar to the drought community. Thus, a similar approach was used for the VegDRI-Canada model. For this purpose, the PDSIsc weekly values were calculated for the 635 selected Canadian weather stations to train the VegDRI-Canada models.
The Standardized Precipitation Index Data: The SPI (McKee, Doesken, and Kleist Citation1995) is used to identify climatic patterns of meteorological dryness at 1-week intervals to match the weekly periods of the satellite data across the historical record used to develop the VegDRI-Canada models. The SPI is based on precipitation data and has the flexibility to detect both short- and long-term precipitation deficits. Because the SPI has the inherent flexibility to be calculated over various time spans, an optimal SPI interval had to be selected. Based on the previous study by Brown et al. (Citation2008), the 36-week SPI provided the best model accuracy within VegDRI and was used for the VegDRI-Canada models. Thus, the 36-week SPI provides the cumulative effect of seasonal rainfall on vegetation condition up to 36 weeks prior to the given week. The 36-week SPI data were calculated for the 635 Canadian weather stations at a weekly time-step.
To integrate the data with other inputs (e.g., satellite data) and produce VegDRI-Canada maps, 1-km gridded data were created from the weather station observations (i.e., point data) for both PDSIsc and SPI. The inverse distance weight (IDW) interpolation method was used to create the gridded data. The spatially interpolated climate grids show that the climate-based drought indices have limited spatial precision in areas with less dense station networks. For example, weather stations are scarce in remote areas of Canada (e.g., northeast Canada) and do not have a uniform geographic distribution.
Satellite-based vegetation index products
Two variables based on satellite-derived NDVI data were used:
MODIS-based satellite data: Percent Average Seasonal Greenness (PASG). The MODIS dataset represents a complete 17-year time series of vegetation observations for the Canadian land mass, and composites are produced in near real-time during the March to October time period operationally within AAFC, which will facilitate the future operational implementation of VegDRI-Canada by AAFC. A 15-year (2000–2014) time series of weekly composited 250-m NDVI data was prepared to generate the seasonal greenness (also referred to as time-integrated NDVI), which can be considered a general proxy for vegetation performance (i.e., gross primary productivity) (Reed, Loveland, and Tieszen Citation1996; Brown et al. Citation2008; Wardlow and Egbert Citation2008; Tadesse et al. Citation2010). The seasonal greenness represents the integrated (or accumulated) NDVI above a baseline “latent” NDVI value (representative of the non-vegetated background signal from soil and non-photosynthetic plant litter) from the start of the growing season (SOS) to a specified time during the year (Brown et al. Citation2008). In this process, sequential NDVI values across the growing season are added (accumulated from the start of the season to the given week in the growing season) to provide the seasonal greenness values for a given weekly period. High seasonal greenness values reflect high green biomass conditions, whereas low seasonal greenness values reflect lower biomass levels. A model to extract seasonal greenness was developed in-house at AAFC in collaboration with the USGS following the same methodology used in the U.S. VegDRI model (Brown et al. Citation2008; Reed, Loveland, and Tieszen Citation1996). The percent average seasonal greenness (PASG) values (i.e., the SG divided by the 15-year weekly average SG and multiplied by 100) were calculated to be used in building the VegDRI-Canada model. The data were calculated at the 1-km pixel level across the Canadian territory for each weekly period of the growing season in the 15-year time series.
The start of the season anomaly (SOSA): The SOSA represents the departure of the start of the growing season for a specific year from the historical average (Schwartz, Ahas, and Aasa Citation2006) for a given space (i.e., grid or pixel). The start of the season values were extracted from the MODIS NDVI composites simultaneously with the seasonal greenness values (i.e., day of the year on which a continuous increase of the NDVI has started in a given season). Details on methods of identifying the start of season can be found in Brown et al. (Citation2008). Using the SOS values for each year at a pixel level, the anomaly is calculated for a specific year from the historical average SOS date (i.e., median values) for each grid cell/pixel. The SOSA was included in the VegDRI-Canada model to account for the different timings of emergence of natural and agricultural vegetation that can influence the seasonal vegetation performance in a given season. This 15-year time series of annual SOSA values was integrated into the training database to develop the VegDRI-Canada model. A possible error in identifying the SOSA values could be improved with longer historical records.
Biophysical parameters
In addition to climate variability, several environmental and biophysical factors that impact the temporal and spatial vegetation patterns, their phenological dynamics, and response to drought conditions (Tadesse et al. Citation2010; Brown et al. Citation2008) were included in the VegDRI-Canada model. Traditionally, many climate-based local, regional, and global models assume that vegetation conditions are exclusively dependent on climate controls as opposed to the influence of other non-climatic factors such as topography, land use/land cover (LULC) type, and soil characteristics at a given location. Studies have indicated that a comprehensive approach that includes not only climate but also soils, water (both surface and ground), and other environmental factors is necessary to build an integrated drought monitoring tool (Tadesse et al. Citation2015a; Svoboda et al. Citation2004). In developing the VegDRI for the United States, Tadesse et al. (Citation2010) and Brown et al. (Citation2008) included a number of biophysical variables (ecoregion, elevation, LULC type, and soil available water holding capacity) that influence general vegetation performance. The VegDRI-Canada model used the same suite of environmental variables in combination with climate- and satellite-related variables for modeling and monitoring drought-related vegetation stress.
To build the VegDRI-Canada model, the biophysical variables were extracted for each weather station location and integrated with the other datasets (i.e., climate and satellite data) in a training database. For each biophysical parameter that has categories (e.g., land cover), the dominant (or majority) value within a 9-km2 window (3-by-3 pixel window) surrounding each weather station was calculated from the 1-km2 resolution images and used to represent each station location in VegDRI-Canada model development. For the biophysical variables with continuous values (e.g., elevation), the average value within a 9-km2 window surrounding each weather station was calculated. Before performing these zonal calculations, pixels corresponding to predominately urban and water pixels within the 3-by-3 pixel window were removed because these LULC types were not the focus of this application and do not represent a climate and remote sensing signal indicative of vegetation-related drought stress. These biophysical data are briefly explained below.
Land Use/Land Cover Data. A 1-km LULC map was generated from a 250-m North American LULC of 2010 (Commission for Environmental Cooperation (CEC) Citation2016). This land cover map is the second in a series of maps produced by the North American Land Change Monitoring System (NALCMS). NALCMS is a collaborative initiative between Canada, Mexico, and the United States to monitor land cover and its change over time. The initial dataset used to generate this land cover information over North America was produced by the Canada Centre for Remote Sensing from observations acquired by the Moderate Resolution Imaging Spectroradiometer (MODIS/Terra) at a 250-m spatial resolution (Pouliot et al. Citation2014; Fry et al. Citation2011). For the VegDRI-Canada model, this LULC data produced by the NALCMS is used to reflect the different seasonal NDVI signals and climate-vegetation responses that are exhibited by different LULC types (e.g., cropland versus evergreen forest). The majority land cover class of the 250-m NALCMS land cover map contained within each 1-km pixel footprint was assigned as the thematic class in the output 1-km LULC map used in this project (Commission for Environmental Cooperation (CEC) Citation2016; Pouliot et al. Citation2014). All the land cover types in the polar region of Canada are categorized into one class as “others.”
Soil Available Water Capacity (AWC). The AWC variable was included in the VegDRI-Canada model to represent the potential of the soil to hold moisture and make it available to plants, which exerts control over plant growth (Churkina, Running, and Schloss Citation1999) and influences the sensitivity and response of vegetation to drought. For Canada, following the GlobalSoilMap.net specification, the “Canadian Soil Data” database, which contains detailed soil maps in GIS format (including the AWC for the top 15 cm), was used (Lelyk Citation2012). The soil data layer (SLC ver. 3.22) from the Soil Landscapes of Canada (SLC) was used to extract the Available Water Holding Capacity (AWHCTOT) to represent the top 15 cm of the soil (Soil Landscapes of Canada Working Group Citation2010). The AWHCTOT is a weighted average of the water over the 15 cm for each component in an SLC polygon. For areas outside of the agricultural regions in Canada, there was no comparable information available for AWC in the top 15 cm. Where measurements were available, these represented the AWC in the top 100 cm. These areas are largely boreal forest and subarctic with no agricultural land present, so that it is not expected to have a great impact on the results of this study.
Irrigated Agriculture (IrrigAg). The representation of irrigation in VegDRI is critical because rainfed vegetation has much greater sensitivity and response to drought than irrigated vegetation. Geospatial irrigation status information across the United States was modeled by Pervez and Brown (Citation2010). A similar approach was used to identify irrigated lands in Canada, using a combination of MODIS and county-level irrigation statistics. For VegDRI-Canada, the process incorporated 2012 satellite-derived vegetation index data at a 250-m spatial resolution observed by MODIS (to identify the annual peak of growing season productivity in a drought year), Statistics Canada irrigation statistics (i.e., number of irrigated acres) from the 2011 Census of Agriculture (Statistics Canada Citation2012), and land cover categories. The percentage of irrigated farmland in each 1-km pixel was calculated using the fraction of the area of irrigated land in a 250-m pixel. The land cover information was based on an agricultural land mask developed using the Canadian Annual Crop Inventory (Fisette et al. Citation2013).
Ecoregions (ECO). A 1-km ecoregion grid was generated from the Omernik Level III ecoregion data (Omernik Citation1987). The study area comprised different types of ecoregions that divide the regional landscape into a series of geographic areas with similar ecosystems and environmental resources, which were identified using both abiotic (e.g., climate, geology, hydrology, land use, and physiography) and biotic (e.g., vegetation and wildlife) criteria (Omernik Citation1995). Many environmental characteristics (e.g., growing season length and plant species) exhibit considerable variability across the study area, which can influence the sensitivity of vegetation to climate. The ECO variable provides a geographic framework to help account for the diverse combination of biotic and abiotic factors encountered across the study area, which can influence the vegetative response of a general land cover type (e.g., grassland) in markedly different ways in this region.
Digital Elevation Model (DEM). The DEM was included in the VegDRI-Canada model to account for the impacts of elevation on vegetation across the diverse area, which includes mountains, plains, and coastal areas. We have assessed a variety of digital elevation models for Canada, including the Canadian Digital Elevation Data (CDED) model. Because of the coarse resolution of the CDED data that was available, we used the U.S. DEM, which also includes parts of Canada. This DEM consists of a 1-km raster grid of regularly spaced elevation values that have been derived from the USGS’s 30-m DEMs (U.S. Geological Survey (USGS) Citation2016).
Weather station selection to build VegDRI-Canada
For VegDRI-Canada weekly models development, a training database was built to extract historical climate and satellite information, as well as the biophysical parameters (considered static over the 15-year record) at weather station locations across the Canadian territory south of 60°N. A total of 948 weather stations were obtained from AAFC that have long climatic historical records. However, selection of stations for actual VegDRI-Canada model development from these stations was made based on (i) identifying stations with long historical records (i.e., >30 years of climate observations) and limited missing data (i.e., <10% missing observations in the historical data record),and (ii) removal of stations located in predominately urban areas and in close proximity to large water bodies. The screening land cover criteria to remove stations in predominately urban areas or in close proximity to water was a 50% threshold of water or urban pixels within a 9-km2 area (i.e., a 3-by-3 1-km pixel window) centered on the station. If a station had 50% or more urban and water pixels, it was eliminated from the database and model development. The LULC screening was employed because stations surrounded by these two land cover types often do not have a representative signal of natural vegetation conditions in the satellite observations because of the nonvegetated nature of the cover type’s surface (i.e., water and densely built-up areas) or human activities such as municipal irrigation or lawns (Tadesse et al. Citation2010). In addition, weather stations that do not have AWC data (an important variable for calculating the PDSIsc) were excluded. Based on these screening criteria, 635 stations were selected to build the VegDRI-Canada weekly models ().
VegDRI-Canada model development, generation of experimental maps, and comparisons
A CART algorithm called Cubist (Rulequest Citation2016) was used to analyze the historical data in the training database and generate rule-based, piecewise linear regression VegDRI-Canada models for each weekly period. This CART algorithm performs a binary, recursive partitioning process that splits the initial set of training observations (root or parent node) into two child nodes that contain subsets of more homogeneous training observations. This process is repeated, further subdividing the training data into pairs of child nodes until the partitioning process is terminated by user-defined criteria (e.g., minimum rule cover or percent of cases allowed to generate a rule) (Tadesse et al. Citation2015a). The CART algorithm produces a series of rule-based models from this partitioning. Each rule set has a corresponding multivariate linear regression equation that can be used to produce model-derived VegDRI-Canada values.
VegDRI-Canada model development
To develop the VegDRI-Canada models, the regression tree analysis technique was applied to the 15 years of historical data for each of the 23 weeks during the generally defined growing season for the study area (i.e., 8 April to 15 September). Regression tree approaches are increasingly being used for environmental modeling (Tadesse et al. Citation2015a; Brown et al. Citation2008; Wylie et al. Citation2008; Zhang et al. Citation2007; De’ath and Fabricius Citation2000; Yang et al. Citation2003), given their ability to effectively analyze large data volumes, identify complex relationships among variables, and handle several types of data from different sources. Regression tree techniques can identify complex historical relationships between the suite of climate- and satellite-based variables and static biophysical variables that collectively influence drought stress and vegetation conditions. Using this approach, similar patterns in the climate and satellite records are identified to generate rules that can be applied to near real-time satellite and climate observations to characterize the pattern and severity of drought-related vegetation stress for specific time period (i.e., week). For this process, a CART algorithm called Cubist (Rulequest Citation2016; Quinlan Citation1993) was used to produce a series of rule-based models from this partitioning. These weekly models were then applied to the gridded data inputs to estimate VegDRI values for each grid cell across the study area for the map evaluation.
The VegDRI-Canada models developed in this study are composed of an unordered set of rules, with each rule having the syntax “if x conditions are met then use the associated linear regression model” (Tadesse et al. Citation2010). The following provides an example of the rules generated by the regression tree technique:
Example Rule 1:
if:
Land cover in {Cropland}
SPI ≤−1.5
AWC ≤5.46
SOSA <2.0
IrrigAg <1.0
then:
VegDRI-Canada = –1.5 + 0.6PASG +1.48SPI–0.14 AWC + 0.25 IrrigAg-0.5DEM+0.14SOSA.
If the input data associated with a specific case meet the conditional statement for the land cover (i.e., Cropland) and the threshold criteria for the four continuous variables (i.e., SPI, AWC, SOSA, and IrrigAg) identified by the regression algorithm, then the above multivariate linear regression equation is used to calculate a VegDRI-Canada value at the pixel level for a specific period (week) during the year. If two or more rules in the model apply to the case, then all models are applied and the output values from each regression equation are averaged to calculate the final modeled VegDRI-Canada value.
To produce the VegDRI-Canada maps, the VegDRI-Canada model (rules) for a specific week (e.g., 10–16 June 2009) is applied to the gridded 1-km input data for that date using MapCubist software. MapCubist is research software code (written in C+) that was developed by the USGS Earth Resources Observation and Science (EROS) Center to execute maps directed by Cubist models. During the process of applying the model to the input raster data, the values of all the input variables (listed in ) for each pixel were considered to determine the rule(s) to select. The corresponding linear regression equation(s) associated with the rule(s) selected were then applied to input data values in order to calculate the VegDRI-Canada value for each pixel across the study area.
Table 2. List of variables, update cycles, and data sources for the VegDRI-Canada model.
Results
VegDRI-Canada model performance across the growing season
The VegDRI-Canada model accuracy was evaluated using several different statistical measures, including the mean absolute difference (MAD) in PDSIsc units, that show the difference between the actual PDSI and the modeled VegDRI-Canada values, the relative error (RE) that shows the average error that would result from always predicting the mean value, and the Pearson’s Product-Moment correlation coefficient (R) (Tadesse et al. Citation2010; Yang et al. Citation2003). The evaluation of the models using these statistical measures was done on the test dataset (i.e., randomly selected 20% of the historical data of all stations over 15 years), which was not included in the remaining 80% of historical data that was used to train the rules/model.
A summary of the VegDRI-Canada models “accuracy and error terms across 23 weekly periods of the growing season (i.e., 8 April to 15 September) is given in . The error terms (i.e., the MAD and RE values for each week) revealed that the MAD values ranged from 1.3 to 1.4. The relative error term (RE) showed values ranging from 0.66 to 0.72. For the VegDRI-Canada values ranging between −8.0 and 8.0 (similar to the PDSIc values), these low MAD and RE values indicate relatively higher accuracy of the models. For example, in August, the MAD and RE values were 1.3 and 0.66, respectively. In addition, the correlation coefficient (R) values between the observed dependent PDSIsc values and modeled VegDRI-Canada values across the growing season ranged from 0.60 and 0.71. An assessment of the intra-annual model accuracy of individual weekly models across the growing season did not show substantial difference. The lowest model accuracy (i.e., higher MAD and RE values and lower R) occurred early in the growing season during the month of May. Model accuracy slightly improved as the growing season progressed and was relatively stable during the summer (peak growing season) and fall (senescence) periods (.). The lower model accuracy in the early spring may be due to low green biomass when crops are beginning to emerge and other vegetation is breaking winter dormancy, resulting in greater fluctuation of the low VegDRI-Canada values early in the growing season that can be magnified by periods of unusually warm or cold inter- and intra-annual temperatures variations that can occur over the study area. An additional evaluation of the VegDRI-Canada models was done by holding out specific years (i.e., holding out one year at a time) in training a model and comparing the model’s predicted values with the PDSIc values over all weather station locations during the hold-out year. The correlations values are shown for each period (week) in the growing season (.). These correlation values from the holdout year analysis ranged from 0.60 to 0.73. The results of the tests on holdout years and the intra-annual showed similar correlation values indicating the models’ consistency since both (i.e., holding out one unseen year and randomly selected 20% of all station data) showed similar R values.
Table 3. Evaluation of the VegDRI-Canada model on test data. The mean absolute difference (MAD) values, relative error (RE), and Pearson’s Product-Moment correlation coefficient (R) between the observed PDSIsc and modeled VegDRI-Canada values are shown for 23 weekly periods in the growing season.
Table 4. Evaluation of the VegDRI-Canada model with holdout years. The correlation values are shown for 23 weekly periods in the growing season. The dates for each period (week) are listed in .
VegDRI-Canada maps evaluation
The VegDRI-Canada map evaluation was done using two methods: (i) a qualitative comparison of the spatial patterns and intensity of the drought depicted in the VegDRI-Canada and the monthly CDM maps, and (ii) quantitatively identifying the correlation between crop yield and VegDRI-Canada values for the prairies region (i.e., agricultural region) of Canada. The CDM has been Canada’s official source for the monitoring and reporting of drought in Canada since late 2002. The monthly historical CDM dataset was produced by AAFC’s National Agroclimate Information Service (NAIS). The CDM is a composite product developed using several sources of ground observations (i.e., both meteorological and impact observations) and remote-sensed data including the PDSI, NDVI, streamflow values, and other drought indicators used by the agriculture, forest, and water management sectors as well as expert feedback from regional specialists. Federal, provincial, and academic scientists analyze drought-prone regions based on precipitation, temperature, modeled soil moisture and crop stress, drought indicators such as the PDSI and SPI, and climate data (AAFC, Citation2016). Thus, in this study, the VegDRI-Canada maps in the weeks at the end of each growing season month (June–September) were evaluated in comparison with the CDM monthly maps.
Comparison of VegDRI-Canada and Canadian drought monitor maps
VegDRI-Canada 1-km maps were produced for the study area ((a)) from 2000 to 2014. However, to evaluate these maps, the prairie region of Canada (i.e., Alberta, Saskatchewan, and Manitoba), which has a relatively dense weather station network and a long record of historical agricultural production data (e.g., crop yield), was selected for further evaluation ()). Even though the VegDRI-Canada models have been built for all 23 weekly periods (i.e., maps have been produced for the growing seasons), only two drought years (2003 and 2009) and one non-drought year (2005) are presented in this paper to demonstrate the performance of the models for contrasting drought periods. In addition, the evaluation was restricted to only four weekly periods during different parts of the growing season – representing the early (10–16 June), mid (22–28 July and 5–11 August), and late (9–15 September) growing season phases – to assess the VegDRI-Canada’s seasonal performance during drought and non-drought years as compared to the CDM maps over the prairie region. The results from the drought and non-drought years during early, mid, and late growing seasons are discussed below.
shows VegDRI-Canada and Canadian Drought Monitor maps for the early season (June), mid-season (July and August), and late season (September). The selected years were two drought years (2003 and 2009) and one near-normal year (2005) to demonstrate the comparisons ((a-x)). The first objective of this comparison was to do a general qualitative check of the VegDRI-Canada maps to determine if the drought patterns depicted were similar to the CDM. This does not mean to imply that the CDM maps are absolute truth, but they represent the best available drought information over the study area for general comparative purposes.
Figure 3. VegDRI-Canada and Canadian Drought Monitor maps for two drought years (2003 and 2009) and one non-drought year (2005).
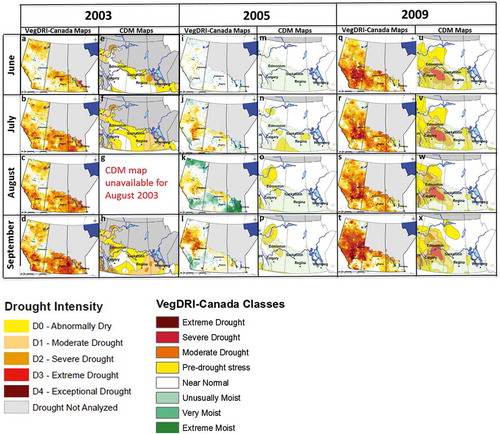
A visual comparison of the VegDRI-Canada maps and the CDM maps in shows general spatial agreement in their drought patterns for the three growing season periods during the three test years. The 2003 drought was an extension of a multiyear drought in this region that started in 2001. Moderate to severe drought across the southern and eastern prairies in 2003 was observed in both the VegDRI-Canada maps (-)) and the CDM (-)), with similar patterns. Drought conditions in 2005 were less intense as shown in both the CDM (-)) and VegDRI-Canada maps (-)), with no apparent drought conditions in the early growing season (June) and the emergence of dry conditions particularly in the northwestern prairies in August and September. In 2009, the drought conditions that impacted the western part of the study area in the province of Alberta (western prairies) as depicted in the CDM (-)) were also detected in the VegDRI-Canada maps (-)), with the most severe conditions located in southern Alberta between Calgary and Edmonton.
There are, however, several local areas where differences were observed. For example, the VegDRI-Canada maps depicted abnormal to moderate drought conditions across central (near Edmonton) and northwest Alberta in 2005 (-)). In comparison, the CDM maps (3n-3p) showed dryness for the same area, but later in the season (September). In addition, the dry areas in western Alberta and central Saskatchewan were not shown in the 2005 CDM maps until later in the season. This indicates that the VegDRI-Canada maps provide complementary and more spatially detailed information that can be used by the CDM map authors when they produce their maps in the future. For the more intense drought conditions in 2003 and 2009, the VegDRI-Canada maps showed less discrimination of the severity across the Canadian Prairies than the DCM maps.
Evaluation of VegDRI-Canada maps using crop yield
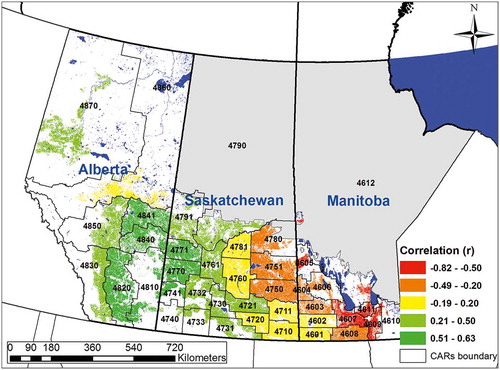
To evaluate the potential of the VegDRI-Canada maps for agricultural drought monitoring, 40 Census Agricultural Regions (CARs) (Statistics Canada Citation2016) were used in the prairie region of Canada that included Alberta, Saskatchewan, and Manitoba (). Of the 40 CARs, 8 were in Alberta, 20 in Saskatchewan, and 12 in Manitoba. The agricultural data that were collected from Statistics Canada include crop yield data for barley, canola, Durham wheat, oats, soybeans, and spring wheat. However, some of these datasets had incomplete data, making a full comparison more challenging. The canola yield data were complete for all years in the study period, and as a result, canola was selected in this study to evaluate the VegDRI-Canada model and its applicability for monitoring drought impacts on crop production. In addition, canola, which was developed by plant breeders in Saskatchewan and Manitoba during the 1960s and 1970s as an oilseed in the same family as mustard, has significant economic impact in the prairie region of Canada. According to Statistics Canada (Citation2016), canola accounted for 4.9% of the total crop cash receipts in 1976; this amount increased to 17.2% ($2.5 billion) in 2006, exceeding the farm cash receipts for crops such as wheat, which totaled $2.2 billion in the same year.
Figure 4. The map shows the spatial distribution of the Pearson’s correlation between the VegDRI-Canada values for the harvest season (5–11 August) and detrended and standardized canola yield for the CARs in the prairie region of Canada. The numbers in the CARs boundary show the CARs identification number. The correlation (in color) is shown for the canola production area only. The grey color shows the area where there are no VegDRI-Canada values, and white areas represent areas where canola has not been grown extensively in this time period, determined using annual crop inventory data from 2009 to 2015.
Several existing studies have shown that historical yield records contain an inherent increasing trend because of improvements in technology and management such as mechanization, improved crop varieties, irrigation, and increased farmers’ knowledge about crop management (Anderson et al. Citation2016; Tadesse et al. Citation2015b). Testing the CARs canola yield data revealed this inherent increasing trend. To eliminate the upward linear trend in a time series of canola yield data due to management practices and other technological advances, the canola yield data were detrended by regression analysis of the annual canola yields against the year. 24 years of historical canola yield data (1992–2015) from Statistics Canada (Citation2016) were used to detrend the yield values. The data process to detrend included: (i) using the time series historical yield data to identify the linear trend on a graph (e.g., scatterplot), (ii) generation of the estimated trend values, and (iii) subtraction of the estimated trend value from the actual crop yield data value for each given year. Mat Lab software (MathWorks Citation2016) was used to detrend the canola yield in this study. Thus, the trend was removed (i.e., detrended) before comparing with the VegDRI-Canada values for the same agricultural region (CAR). The detrended canola yield values were also standardized (i.e., the difference between the actual and average values divided by standard deviation) for appropriate spatial comparison.
shows the spatial distribution of the comparison between the VegDRI-Canada values for the harvest season (5–11 August) and detrended and standardized canola yield for the CARs in the prairie region of Canada using Pearson’s correlation (r). The week of 5–11 August, which corresponds to the grain filling periods of canola in the prairie regions (Mkhabela et al. Citation2011), was selected to represent the growing period. This period is close to harvesting and corresponds with the flowering/mature stage of canola, which is a critical growth stage that influences canola production (Mkhabela et al. Citation2011). Our analysis for the other weeks, including 10–16 June, 8–14 July, and 2–8 September in the growing period also showed similar correlations with canola yield. However, only the 5–11 August results are presented in this paper for illustration purposes.
As shown in , the Pearson’s correlation (r) between VegDRI-Canada and detrended and standardized canola yield data ranged from −0.82 to 0.62 for the prairie region. For each CAR, the percent of irrigated land and percent area of the canola production are also shown in . Relatively higher positive correlation was found over the southwestern prairie agricultural areas. For example, maximum correlation was observed for CARUID 4840 (r = 0.62) and CARUID 4820 (r = 0.56) in Alberta, followed by CARUID 4770 (r = 0.54) and CARUID 4771 (r = 0.52) in Saskatchewan. The possible explanation for the relatively higher correlations for these areas is likely due to the greater aridity in these regions, with the occurrence of drought being a much greater limiting factor in crop growth than in more humid regions (Chipanshi et al. Citation2015). The southeastern Saskatchewan CARs showed weak correlation, while almost all the CARs in Manitoba showed a negative correlation. For example, CARUID 4609 (r = −0.819), 4611 (r = −0.599), and 4607 (r = −0.559) had relatively higher negative correlations. This relatively low positive to negative correlation (i.e., r < 0.2) found across the southeastern prairie region could be due to the higher overall precipitation in this area, making drought a less limiting factor in determining crop growth, as well as the frequent occurrence of excess moisture events in this area, which led to large areas being left unseeded as a result of waterlogging or excess moisture. Since dry periods would likely correspond with better growth conditions, this could (in part) explain the negative correlation. In addition, in this area, yield prediction using satellite- and climate-based variables has been shown to have higher rates of error (Chipanshi et al. Citation2015; Mkhabela et al. Citation2011), which has been attributed to the lower range of yields that are seen in this area. This leads to less variability year to year. In addition, as compared to Saskatchewan and Manitoba, the higher number of stations in Alberta that are used in the current VegDRI-Canada models development could possibly have influence the performance of the models (i.e., positive correlations) for Alberta. This could be improved in the future with the use of satellite rainfall estimates for the areas with less dense weather stations network in the eastern part of the Prairies.
Table 5. Census Agriculture Regions (CARs) to evaluate VegDRI-Canada with crop yield over the prairie region of Canada. Percent irrigated area and percent area of canola production for the CARs are also shown. For each CARs identification number (CARUID), the Pearson’s correlation values between the detrended and standardized canola yield and the VegDRI-Canada values for 5–11 August (a week in the harvest season) are shown in the last column.
In general, the VegDRI-Canada models showed sensitivity to known agricultural drought events for most CARs in Canada over the 15-year period (2000–2014) and sensitivity to crop yield variation, particularly in more arid regions where drought is a significant limiting factor in determining crop yield.
Conclusion
Monitoring vegetation conditions is important for a wide range of applications that include agricultural crop estimates, rangeland condition assessments, and drought monitoring. Recently, improved drought monitoring tools have been built/produced because of the availability of longer historical records of remote sensing observations and environmental datasets as well as recent advances in computing technologies and statistical techniques. VegDRI-Canada model is a new hybrid geospatial vegetation condition indicator that integrates satellite, climate, and biophysical observations. In addition, VegDRI-Canada capitalizes on historical climate-vegetation interactions, while considering several static environmental characteristics (i.e., LULC, irrigation status, soil characteristics, and ecological setting) that can influence vegetation’s response to weather conditions.
The evaluation of the spatiotemporal performance of VegDRI-Canada maps across the growing season showed reasonable model accuracy (R between 0.6 and 0.71) for Canada across the growing season for the selected two drought (2003 and 2009) and one non-drought (2005) years. The comparison of the VegDRI-Canada map with the CDM showed that the VegDRI-Canada maps depict the key patterns and severity of known drought years identified by the CDM. In addition, the correlation between the VegDRI-Canada values and canola yield showed relatively higher correlation (i.e., r > 0.5) for water-limited regions in the Canadian Prairies region. This demonstrates VegDRI-Canada’s utility for monitoring drought and vegetation condition. However, further study is needed to improve the models and maps, particularly in areas where excess moisture hinders crop growth.
One of the challenges in building the current VegDRI-Canada models and maps was the limited coverage of the soil data (i.e., AWC). Because the AWC data does not cover all areas of Canada south of 60°N, calculating the PDSIsc was not possible for all areas, particularly forested areas in the north where this index may provide valuable information on the impact of drought on forest. The main challenge and limitations in developing VegDRI models in other countries including Canada are the availability of all the input data and long historical records. Another key challenge is adapting methods for extracting the remote sensing metrics over environments with different seasonal changes in vegetation. For example, the long snow cover period in several areas in Canada makes it challenging to identify the start of season. Furthermore, establishment of a national evaluator network to collect feedback is vital for improvement of the models as well as testing this drought monitoring tool for operational use. For example, in the United States, the feedback collected from experts and other users (including state climatologists, USDM authors, drought experts, agricultural/natural resource specialists, and agricultural producers) has helped to assess the accuracy of VegDRI maps and guide value-added product development and delivery of VegDRI information among various decision-making processes. Thus, a similar evaluator network is recommended for evaluating and improving the VegDRI-Canada model and products.
The VegDRI-Canada is planned to be operational in the near future and has great potential for different types of users and purposes. Feedback from users with specific needs (e.g., agricultural producers, university extension agents, and policy-makers) is essential for improving the usefulness of the models for sectors affected by drought. Easier access to these products will also allow for quicker assessments and decision-making at all levels. VegDRI-Canada maps and information are expected to make a significant contribution to identifying drought severity and patterns, which in turn will help users and decision-makers.
Highlights
A new Vegetation Drought Response Index for Canada (VegDRI-Canada) is developed to monitor for Canada.
A case study was conducted to evaluate the VegDRI-Canada results over the prairie region of Canada for two drought years and one non-drought year for three weekly periods of the growing season.
Results show that the VegDRI-Canada models showed sensitivity to known agricultural drought events in Canada over the 15-year period mainly for nonirrigated areas.
Acknowledgments
This study was supported by Agriculture and Agri-Food Canada (AAFC) and the National Drought Mitigation Center (NDMC), University of Nebraska–Lincoln. J. Brown was supported by the Land Remote Sensing Program in the USGS Climate and Land Use Change mission area. The authors thank Karin Callahan and Chis Poulsen at the NDMC for extracting the satellite and biophysical data for the model development. We would also like to acknowledge the expertise of Canadian scientists Bahram Daneshfar and Yinsuo Zhang, who contributed to this study. We also thank Deborah Wood of the NDMC for her editorial comments. Any use of trade, firm, or product names is for descriptive purposes only and does not imply endorsement by the U.S. Government.
Disclosure statement
No potential conflict of interest was reported by the authors.
Additional information
Funding
References
- Agriculture and Agri-Food Canada (AAFC), 2016, The Canadian Drought Monitor [http://www.agr.gc.ca/eng/programs-and-services/list-of-programs-and-services/drought-watch/canadian-drought-monitor/?id=1463575104513], accessed June 27, 2016.
- Anderson, M. C., W. P. Kustas, J. M. Norman, C. R. Hain, J. R. Mecikalski, L. Schultz, M. P. González-Dugo, et al. 2010. “Mapping Daily Evapotranspiration at Field to Global Scales Using Geostationary and Polar Orbiting Satellite Imagery.” Hydrol. Earth Syst. Sci. Discuss 7: 5957–5990. doi:10.5194/hessd-7-5957-2010.
- Anderson, M. C., C. A. Zolin, P. C. Sentelhas, C. R. Hain, K. Semmens, M. Tugrul Yilmaz, F. Gao, J. A. Otkin, and R. Tetrault. 2016. ““The Evaporative Stress Index as an Indicator of Agricultural Drought in Brazil: An Assessment Based on Crop Yield Impacts.” Remote Sensing of Environment 174: 82–99. doi:10.1016/j.rse.2015.11.034.
- Anderson, W. B., B. F. Zaitchik, C. R. Hain, M. C. Anderson, M. T. Yilmaz, J. Mecikalski, and L. Schultz. 2012. “Towards an Integrated Soil Moisture Drought Monitor for East Africa.” Hydrol. Earth Syst. Sci 16: 2893–2913. doi:10.5194/hess-16-2893-2012.
- Asner, G. P., A. R. Townsend, and B. H. Braswell. 2000. “Satellite Observation of El Niño Effects on Amazon Forest Phenology and Productivity.” Geophysical Research Letters 27 (7): 981–984. doi:10.1029/1999GL011113.
- Baret, F., and G. Guyot. 1991. “Potentials and Limits to Vegetation Indices for LAI and APAR Assessments.” Remote Sensing of Environment 35: 161–173. doi:10.1016/0034-4257(91)90009-U.
- Bayarjargala, Y., A. Karnieli, M. Bayasgalan, S. Khudulmurb, C. Gandush, and C. J. Tucker. 2006. “A Comparative Study of NOAA–AVHRR Derived Drought Indices Using Change Vector Analysis.” Remote Sensing of Environment 105 (1): 9–22. doi:10.1016/j.rse.2006.06.003.
- Braun, P., H. Balzter, and W. Kohler. 2000. “Analyzing Spatiotemporal Dynamics of Plant Populations and Vegetation.” In Quantifying Spatial Uncertainty in Natural Resources: Theory and Applications for GIS and Remote Sensing, Eds. H. T. Mowrer and R. G. Congalton, 203–211. Boca Raton, FL: CRC Press.
- Brown, J. F., B. D. Wardlow, T. Tadesse, M. J. Hayes, and B. C. Reed. 2008. “The Vegetation Drought Response Index (Vegdri): A New Integrated Approach for Monitoring Drought Stress in Vegetation.” Giscience and Remote Sensing 45 (1): 16–46. doi:10.2747/1548-1603.45.1.16.
- Champagne, C., A. Berg, H. McNairn, G. Drewitt, and T. Huffman. 2012. “Evaluation of Soil Moisture Extremes over Agricultural Regions in the Canadian Prairies.” Agricultural and Forest Meteorology 165: 1–11. doi:10.1016/j.agrformet.2012.06.003.
- Champagne, C., A. Davidson, P. Cherneski, J. L’Heureux, and T. Hadwen. 2015. “Monitoring Agricultural Risk in Canada Using L-Band Passive Microwave Soil Moisture from SMOS.” Journal of Hydrometeorology 16: 5–18. doi:10.1175/JHM-D-14-0039.1.
- Chipanshi, A., Y. Zhang, L. Kouadio, N. Newlands, A. Davidson, H. Hill, R. Warren, et al. 2015. “Evaluation of the Integrated Canadian Crop Yield Forecaster (ICCYF) Model for In-Season Prediction of Crop Yield across the Canadian Agricultural Landscape.” Agricultural and Forest Meteorology 206: 137–150. doi:10.1016/j.agrformet.2015.03.007.
- Chipanshi, A. C., R. T. Warren, J. L’Heureux, D. Waldner, H. McLean, and D. Qi. 2013. “Use of the National Drought Model (NDM) in Monitoring Selected Agroclimatic Risks across the Agricultural Landscape of Canada.” Atmosphere - Ocean 51: 471–488. doi:10.1080/07055900.2013.835253.
- Churkina, G., S. W. Running, and A. L. Schloss. 1999. “Comparing Global Models of Terrestrial Net Primary Productivity (NPP): The Importance of Water Availability.” Global Change Biology 5 (Suppl. 1): 46–55. doi:10.1046/j.1365-2486.1999.00006.x.
- Commission for Environmental Cooperation (CEC), 2016, Land Cover, 2010 [http://www.cec.org/tools-and-resources/map-files/land-cover-2010], accessed 30 June 2016
- Davidson, A., 2015, “An Operational Canadian Ag-Land Monitoring System (CALMS): Near-Real-Time Agricultural Assessment from Space,” Agriculture and Agri-Food Canada. 60 pp.
- De’ath, G., and K. E. Fabricius. 2000. “Classification and Regression Trees—A Powerful yet Simple Technique for Ecological Data Analysis.” Ecology 81 (11): 3178–3192. doi:10.1890/0012-9658(2000)081[3178:CARTAP]2.0.CO;2.
- DeBeurs, K. M., and G. M. Henebry. 2004. “Land Surface Phenology, Climatic Variation, and Institutional Change: Analyzing Agricultural Land Cover Change in Kazakhstan.” Remote Sensing of Environment 89 (4): 497–509. doi:10.1016/j.rse.2003.11.006.
- Du, L., Q. Tian, T. Yu, Q. Meng, T. Jancso, P. Udvardy, and Y. Huang. 2013. “A Comprehensive Drought Monitoring Method Integrating MODIS and TRMM Data.” Int. J. Appl. Earth Obs. Geoinf 23: 245–253. doi:10.1016/j.jag.2012.09.010.
- Eidenshink, J. C. 2006. “A 16-Year Time Series of 1 Km AVHRR Satellite Data of the Conterminous United States and Alaska.” Photogrammetric Engineering and Remote Sensing 72: 1027–1035. doi:10.14358/PERS.72.9.1027.
- Ek, M. B. 2003. “Implementation of Noah Land Surface Model Advances in the National Centers for Environmental Prediction Operational Mesoscale Eta Model.” J. Geophys. Res 108: 8851. doi:10.1029/2002JD003296.
- Environment Canada, 2016, Historical Data [http://climate.weather.gc.ca/historical_data/search_historic_data_e.html], accessed June 27, 2016.
- Fisette, T., P. Rollin, Z. Aly, L. Campbell, B. Daneshfar, P. Filyer, A. Smith, A. Davidson, J. Shang, and I. Jarvis, 2013, “AAFC Annual Crop Inventory: Status and Challenges,” The Second International Conference on Agro-Geoinformatics 12–16 August 2013, Fairfax, VA, USA.
- Fry, J., G. Xian, S. Jin, J. Dewitz, C. Homer, L. Yang, C. Barnes, N. Herold, and J. Wickham. 2011. “Completion of the 2006 National Land Cover Database for the Conterminous United States.” Photogrammetric Engineering and Remote Sensing 77 (9): 858–864.
- Funk, C. C., and M. E. Brown. 2006. “Intra-Seasonal NDVI Change Projections in Semi-Arid Africa.” Remote Sensing of Environment 101: 249–256. doi:10.1016/j.rse.2005.12.014.
- Gallo, K., L. Ji, B. C. Reed, J. Dwyer, and J. Eidenshink. 2004. “Comparison of MODIS and AVHRR 16-Day Normalized Difference Vegetation Index Composite Data.” Geophysical Research Letters 31. doi:10.1029/2003GL019385.
- Gao, B.-C.. 1996. “NDWI - a Normalized Difference Water Index for Remote Sensing of Vegetation Liquid Water from Space.” Remote Sensing of Environment 58: 257–266. doi:10.1016/S0034-4257(96)00067-3.
- Gao, M., Z. Qin, H. Zhang, L. Lu, X. Zhou, and X. Yang. 2008. “Remote Sensing of Agro-Droughts in Guangdong Province of China Using MODIS Satellite Data.” Sensors, no. 8: 4687–4708. doi:10.3390/s8084687.
- Gitelson, A. A. 2004. “Wide Dynamic Range Vegetation Index for Remote Quantification of Biophysical Characteristics of Vegetation.” Journal of Plant Physiology 161: 165–173. doi:10.1078/0176-1617-01176.
- Gu, Y., J. F. Brown, J. P. Verdin, and B. Wardlow. 2007. “A Five-Year Analysis of MODIS NDVI and NDWI for Grassland Drought Assessment over the Central Great Plains of the United States.” Geophysical Research Letters 34 (6): 1–6. doi:10.1029/2006GL029127.
- Hao, Z., and A. AghaKouchak. 2013. “Multivariate Standardized Drought Index: A Parametric Multi-Index Model.” Adv. Water Resour 57: 12–18. doi:10.1016/j.advwatres.2013.03.009.
- Hayes, M. J., D. A. Wilhite, M. Svoboda, and O. Vanyarkho. 1999. “Monitoring the 1996 Drought Using the Standardized Precipitation Index.” Bulletin of the American Meteorological Society 80 (3): 429–438. doi:10.1175/1520-0477(1999)080<0429:MTDUTS>2.0.CO;2.
- Huete, A. R., K. Didan, Y. E. Shimabukuro, P. Ratana, S. R. Saleska, L. R. Hutyra, W. Yang, R. R. Nemani, and R. Myneni. 2006. “Amazon Rainforests Green-Up with Sunlight in Dry Season.” Geophysical Research Letters 33: L06405. doi:10.1029/2005GL025583.
- Ji, L., and A. J. Peters. 2003. “Assessing Vegetation Response to Drought in the Northern Great Plains Using Vegetation and Drought Indices.” Remote Sensing of Environment 87: 85–98. doi:10.1016/S0034-4257(03)00174-3.
- Justice, C. O., M. O. Román, I. Csiszar, E. F. Vermote, R. E. Wolfe, S. J. Hook, M. Friedl, et al. 2013. “Land and Cryosphere Products from Suomi NPP VIIRS: Overview and Status.” Journal of Geophysical Research D: Atmospheres 118 (17): 9753–9765.
- Kogan, F. N. 1990. “Remote Sensing of Weather Impacts on Vegetation in Non-Homogeneous Areas.” International Journal of Remote Sensing 11 (8): 1405–1419. doi:10.1080/01431169008955102.
- Kouadio, L., N. K. Newlands, A. Davidson, Y. Zhang, and A. Chipanshi. 2014. “Assessing the Performance of MODIS NDVI and EVI for Seasonal Crop Yield Forecasting at the Ecodistrict Scale.” Remote Sensing 6: 10193–10214. doi:10.3390/rs61010193.
- Lelyk, G., 2012, Canadian Soil Data, Global Soil Map and Soil Survey Uncertainty Workshop, Lincoln, NE, August 29, 2012 [ftp://ftp-fc.sc.egov.usda.gov/NSSC/global_soil_map/uncertainty/Canada.pdf], accessed 30 June 2016.
- Loveland, T. R., B. C. Reed, J. F. Brown, D. O. Ohlen, Z. Zhu, and L. Yang. 2000. “Development of a Global Land Cover Characteristics Database and IGBP Discover from 1 Km AVHRR Data.” International Journal of Remote Sensing 21 (6–7): 1303–1330. doi:10.1080/014311600210191.
- Lunetta, R. S., J. F. Knight, J. Ediriwickrema, J. G. Lyon, and L. D. Worthy. 2006. “Land-Cover Change Detection Using Multi-Temporal MODIS NDVI Data.” Remote Sensing of Environment 105: 142–154. doi:10.1016/j.rse.2006.06.018.
- MathWorks, 2016, Detrending Data [http://www.mathworks.com/help/matlab/data_analysis/detrending-data.html?requestedDomain=www.mathworks.com], accessed June 26, 2016.
- McKee, T. B., N. J. Doesken, and J. Kleist, 1995, “Drought Monitoring with Multiple Time Scales, Preprints,” 9th Conference on Applied Climatology, January 15–20, Dallas, Texas, 233–236.
- Mkhabela, M. S., P. Bullock, S. Raj, S. Wang, and Y. Yang. 2011. “Crop Yield Forecasting on the Canadian Prairies Using MODIS NDVI Data.” Agricultural and Forest Meteorology 151: 385–393. doi:10.1016/j.agrformet.2010.11.012.
- Omernik, J. M. 1987. “Ecoregions of the Conterminous United States.” Annals of the Association of American Geographers 77 (1): 118–125. doi:10.1111/j.1467-8306.1987.tb00149.x.
- Omernik, J. M. 1995. “Ecoregions: A Spatial Framework for Environmental Management.” In Biological Assessment and Criteria: Tools for Water Resource Planning and Decision Making, Eds. W. Davis and T. Simon, 49–62. Boca Raton, FL: Lewis Publishers.
- Palmer, W. C. 1965. Meteorological Drought. Research Paper No. 45, 58. Washington, D.C: U.S. Department of Commerce Weather Bureau.
- Pervez, M. S., and J. F. Brown. 2010. “Mapping Irrigated Lands at 250-M Scale by Merging MODIS Data and National Agricultural Statistics.” Remote Sensing 2 (10): 2388–2412. doi:10.3390/rs2102388.
- Pouliot, D., R. Latifovic, N. Zabcic, L. Guindon, and I. Olthof. 2014. “Development and Assessment of a 250m Spatial Resolution MODIS Annual Land Cover Time Series (2000-2011) for Canada Derived from Change Based Updating.” Remote Sensing of Environment 140: 731–743. doi:10.1016/j.rse.2013.10.004.
- Quinlan, J. R. 1993. C4.5 Programs for Machine Learning, 302. San Mateo, CA: Morgan Kaufmann Publishers.
- Reed, B. C., T. R. Loveland, and L. L. Tieszen. 1996. “An Approach for Using AVHRR Data to Monitor U.S. Great Plains Grasslands.” Geocarto International 11 (3): 13–22. doi:10.1080/10106049609354544.
- Rhee, J., J. Im, and G. J. Carbone. 2010. “Monitoring Agricultural Drought for Arid and Humid Regions Using Multi-Sensor Remote Sensing Data.” Remote Sens. Environ 114: 2875–2887. doi:10.1016/j.rse.2010.07.005.
- Rulequest, 2016, Data Mining with Cubist [https://www.rulequest.com/cubist-info.html], accessed June 26, 2016.
- Schwartz, M. D., R. Ahas, and A. Aasa. 2006. “Onset of Spring Starting Earlier across the Northern Hemisphere.” Global Change Biology 12: 343–351. doi:10.1111/gcb.2006.12.issue-2.
- Shabanov, N., M. Vargas, T. Miura, A. Sei, and A. Danial. 2015. “Evaluation of the Performance of Suomi NPP VIIRS Top of Canopy Vegetation Indices over AERONET Sites.” Remote Sensing of Environment 162: 29–44. doi:10.1016/j.rse.2015.02.004.
- Soil Landscapes of Canada Working Group, 2010, Soil Landscapes of Canada Version 3.2, Agriculture and Agri-Food Canada [http://sis.agr.gc.ca/cansis/index.html], accessed June 26, 2016.
- Statistics Canada, 2012, The 2011 Census of Agriculture [http://www.statcan.gc.ca/daily-quotidien/120510/dq120510a-eng.htm], accessed June 20, 2016.
- Statistics Canada, 2016, “Canola: A Canadian Success Story” [http://www.statcan.gc.ca/pub/96-325-x/2007000/article/10778-eng.htm], accessed June 26, 2016.
- Svoboda, M., M. J. Hayes, D. Wilhite, and T. Tadesse, 2004, “Recent Advances in Drought Monitoring,” Proceedings of the 14th Conference on Applied Climatology, Seattle, WA [https://ams.confex.com/ams/84Annual/techprogram/paper_72976.htm], accessed June 26, 2016.
- Svoboda, M., D. LeComte, M. Hayes, R. Heim, K. Gleason, J. Angel, B. Rippey, R. Tinker, M. Palecki, D. Stooksbury, and D. Miskus. 2002. “The Drought Monitor.” Bulletin of The American Meteorological Society 83 (8): 1181-1190. doi:10.1175/1520-0477(2002)083<1181:TDM>2.3.CO;2.
- Tadesse, T., J. F. Brown, and M. J. Hayes. 2005. “A New Approach for Predicting Drought-Related Vegetation Stress: Integrating Satellite, Climate, and Biophysical Data over the U.S. Central Plains.” ISPRS Journal of Photogrammetry and Remote Sensing 59 (4): 244–253. doi:10.1016/j.isprsjprs.2005.02.003.
- Tadesse, T., G. B. Senay, G. Berhan, T. Regassa, and S. Beyene. 2015b. “Evaluating A Satellite-Based Seasonal Evapotranspiration Product and Identifying Its Relationship with Other Satellite-Derived Products and Crop Yield: A Case Study for Ethiopia.” International Journal of Applied Earth Observation and Geoinformation 40: 39–54. doi:10.1016/j.jag.2015.03.006.
- Tadesse, T., B. D. Wardlow, J. Brown, M. Hayes, M. Svoboda, B. Fuchs, and D. Gutzmer. 2015a. “Assessing the Vegetation Condition Impacts of the 2011 Drought across the U.S. Southern Great Plains Using the Vegetation Drought Response Index (Vegdri).” Journal of Applied Meteorology and Climatology 54 (1): 153–169. doi:10.1175/JAMC-D-14-0048.1.
- Tadesse, T., B. D. Wardlow, M. J. Hayes, M. D. Svoboda, and J. F. Brown. 2010. “The Vegetation Condition Outlook (Vegdri): A New Method for Predicting Vegetation Seasonal Greenness.” Giscience and Remote Sensing 47 (1): 25–52. doi:10.2747/1548-1603.47.1.25.
- The Canadian Encyclopedia (TCE), 2016, “Crops” [http://www.thecanadianencyclopedia.ca/en/article/crops/], accessed June 30, 2016.
- Tucker, C. J., J. R. G. Townshend, and T. E. Goff. 1985. “African Land Cover Classification Using Satellite Data.” Science 227 (4685): 369–375. doi:10.1126/science.227.4685.369.
- U.S. Geological Survey (USGS), 2016, “Global 30 Arc-Second Elevation (GTOPO30),” available at https://lta.cr.usgs.gov/GTOPO30, accessed 30 June 30, 2016.
- Wardlow, B. D., and S. L. Egbert. 2008. “Large-Area Crop Mapping Using Time-Series MODIS 250 M NDVI Data: An Assessment for the U.S. Central Great Plains.” Remote Sensing of Environment 112 (3): 1096–1116. doi:10.1016/j.rse.2007.07.019.
- Wardlow, B. D., T. Tadesse, J. F. Brown, K. Callahan, S. Swain, and E. Hunt. 2012. “The Vegetation Drought Response Index (Vegdri): An Integration of Satellite, Bioclimate, and Biophysical Data.” In Remote Sensing and Drought: Innovative Approaches to Monitoring, Eds. B. D. Wardlow, M. C. Anderson, and J. Verdin, 51–74. Boca Raton, FL: CRC Press.
- Wells, N., S. Goddard, and M. J. Hayes. 2004. “A Self-Calibrating Palmer Drought Severity Index.” Journal of Climate 17 (12): 2335–2351. doi:10.1175/1520-0442(2004)017<2335:ASPDSI>2.0.CO;2.
- Wheaton, E., S. Kulshreshtha, V. Wittrock, and G. Koshida. 2008. “Dry Times: Hard Lessons from the Canadian Drought of 2001 and 2002.” Canadian Geographic 52: 241–262. doi:10.1111/j.1541-0064.2008.00211.x.
- Wilhite, D. A. 2000. “Preparing for Drought: A Methodology.” In Drought: A Global Assessment, edited by D. A. Wilhite, 89–104. Vol. 2. London, UK: Routledge.
- Wylie, B. K., L. Zhang, N. Bliss, L. Ji, L. L. Tieszen, and M. Jolly. 2008. “Integrating Modeling and Remote Sensing to Identify Ecosystem Performance Anomalies in the Boreal Forest, Yukon River Basin, Alaska.” International Journal of Digital Earth 1: 196–220. doi:10.1080/17538940802038366.
- Yang, L., C. Huang, C. Homer, B. Wylie, and M. Coan. 2003. “An Approach for Mapping Large-Area Impervious Surfaces: Synergistic Use of Landsat-7 ETM+ and High Spatial Resolution Imagery.” Canadian Journal of Remote Sensing 29 (2): 230–240. doi:10.5589/m02-098.
- Zhang, A., and G. Jia. 2013. “Monitoring Meteorological Drought in Semiarid Regions Using Multi-Sensor Microwave Remote Sensing Data.” Remote Sens. Environ 134: 12–23. doi:10.1016/j.rse.2013.02.023.
- Zhang, L., B. W. Wylie, T. Loveland, E. A. Fosnight, L. Tieszen, and L. Ji. 2007. “Evaluation and Comparison of Gross Primary Production Estimates for the Northern Great Plains Grasslands.” Remote Sensing in Environment 106: 173–189. doi:10.1016/j.rse.2006.08.012.
- Zwieback, S., K. Scipal, W. Dorigo, and W. Wagner. 2012. “Structural and Statistical Properties of the Collocation Technique for Error Characterization. Nonlinear Process.” Geophys 19: 69–80. doi:10.5194/npg-19-69-2012.