
Abstract
This study applies multispectral band ratios to examine vegetation density and vegetation health to assess drought conditions over nearly 30 years (1989–2016) in Tuy Phong district, Binh Thuan province, Vietnam using a sequence of Landsat imagery (TM and OLI). Our research area has a distinctive climate, characterized by arid and semiarid areas adjacent to Binh Thuan’s coastline. Drought is likely intensified by rain shadow effects of the Central Highlands (part of the Truong Son- or the Annamese Cordillera, positioned immediately west of the province). The seasonal Land Surface Temperature (LST) and Normalized Difference Vegetation Index (NDVI) were calculated to derive three other indices: Vegetation Condition Index (VCI), Temperature Condition Index (TCI), and Vegetation Health Index (VHI). Results show that approximately two-thirds of Tuy Phong district was influenced by mid-to-severe drought. During the dry season (November to the following April), severity of drought has increased both intensively and extensively toward the North. Hypotheses testing of correlation between LST and NDVI also revealed a significantly negative relationship – increasing surface temperature and decreasing NDVI. To validate our results, we applied the same procedure for generating the VHI from MODIS data. Despite the absence of historical datasets for our region, Landsat data shows many advantages in monitoring drought in remote and small areas compared to MODIS. Our research strategies may be effective in other regions without sufficient climatic records for conventional climatic analysis.
Keywords:
1. Introduction
As a climatic abnormality originating from a period of usually low precipitation, drought can occur in every part of the Earth’s surface, even in humid regions. Droughts can disrupt both ecological and economic systems, leading to population displacement. Furthermore, sustained drought also encourages desertification (Hirche et al. Citation2011), and land degradation, which are especially harmful for vulnerable landscapes bordering arid and semiarid areas (Pandey et al. Citation2013). When local climatic meteorological data are available, drought can be measured using integrated indices related to weather and soil conditions, such as atmospheric humidity, air temperature, rainfall, and soil moisture.
Although meteorological data do define drought status, they are not fully sufficient, especially in areas that lack robust, sustained, and adequate records at appropriate spatial and temporal scales. This study examines drought conditions within a small, but distinctive, region at the central coast of Vietnam characterized by serious drought, but lacking systematic climatic records – specifically, there are only 105 internationally and officially recognized weather stations within all of Vietnam – a country with 63 provinces. Additionally, due to the Historical Observing Metadata Repository system, within our study area, in Binh Thuan province (see ), there are two stations, located in Phan Thiet City, though there are no in situ weather stations within our specific study area. Therefore, it is very difficult to examine climate anomalies at monthly to yearly scales. On the other hand, broad-scale weather models, can only work well over larger areas, and be applied to predict general climatic trends, rather than specific drought episodes.
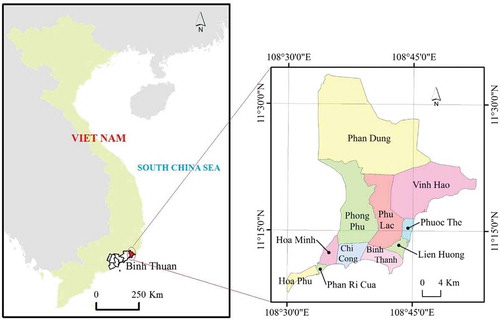
Figure 1. Location of case study, Northeastern Binh Thuan Province, Southern Coastal Vietnam. For full colour versions of the figures in this paper, please see the online version. should be shown in section 2.1. Case study.
However, sequential satellite imagery can form a comprehensive method to observe and evaluate drought conditions within regions without records of systematic climate data. There are multiple forms of freely available remotely sensed imagery suitable for drought analysis, such as MODIS, LANDSAT, and ASTER imagery, together providing a wide range of resolutions and spectral channels (Cai, Mingyi, and Liu Citation2011). These data can be applied to land use assessment (Doi Citation2002), or to generate useful indexes for specific purposes, such as changes of surface temperature (Sobrino, Jiménez-Muñoz, and Paolini Citation2004; Valiente et al. Citation2010), and vegetation health, which can be considered as indicators of drought (Karnieli et al. Citation2010; Orhan, Ekercin, and Dadaser-Celik Citation2014).
NDVI is a proxy index applied to extract, and to estimate, vegetation cover in terms of proportion and density, which indirectly indicates vegetation health (Tucker Citation1979). In monitoring drought status, assessing vegetative cover and health is very important as an indicator of overall plant health, and specifically, temperature, and moisture stress. Thus, any sign of changing behavior of the prevailing NDVI time series of the vegetative cover can be attributed to variation of climatic measures, such as temperature or precipitation (Peters et al. Citation2002; Sun and Kafatos Citation2007; Bai and Dent Citation2009). Otherwise, in their study using datasets acquired by Advanced Very High Resolution Radiometer (AVHRR), Karnieli and his colleges found a negative correlation between surface temperature (LST) and NDVI that also can be considered as another indicator of drought monitoring in terms of water-limiting vegetation growth (Karnieli et al. Citation2010). Therefore, in our study, instead of working on NDVI separately, we investigate an integration of LST, and NDVI.
In that context, the Vegetation Health Index (VHI) has been used to monitor vegetation health according to drought impact (Kogan Citation1990, Citation1994). VHI is based upon the correlation between NDVI and LST derived from AVHRR-NOAA imagery. Basically, VHI, according to Kogan, is based on the three principles of environmental ecosystem analysis: the “law of minimum; the law of tolerance; and the law of carrying capacity” (Kogan Citation1990). To integrate NDVI and LST obtained over the long term, Kogan used two indices as components to derive the general index VHI: VCI and TCI. VCI is generated by NDVI time series analysis that measures percent change of the difference of current NDVI and range of historical NDVI values. VCI can be applied individually in advance to monitor impact of drought on vegetation health (Peters et al. Citation2002; Jiao et al. Citation2016), but it is insufficient because VCI only reflects impact of moisture condition. Therefore, TCI, which indicates the influence of thermal condition, was proposed. TCI measures the difference of current LST and range of historical LST values. Generally, VHI is a time series analysis of moisture and thermal impacts on vegetation. Kogan’s results demonstrate the potential application of VHI in agricultural drought analysis. In the United States, USDA applies this index at monthly to yearly frequencies to monitor drought and crop health (www.star.nesdis.noaa.gov). However, application of the VHI estimation algorithm requires sequential imagery on a weekly basis over at least 32 years of observation. Thus, at coarse resolutions, or global scales, VHI seems to work well due to the huge image databases at that scale from NOAA or MODIS, for example. Otherwise, at moderate or high resolutions, applications of VHI are limited due to the lack of available sequential imagery, longer revisit times, and cloud cover, especially for areas near the Equator. As a result, there are few reports assessing influences of drought at local scales, in part because of the absence of long-term metrological records.
This study applies the basic VHI method using Landsat imagery (TM and OLI) for a small region within a tropical environment to assess its performance in characterizing drought severity and monitoring vegetation stress under drought conditions. Therefore, it contributes to an understanding of relationships between water shortages and high temperatures, and their effects upon vegetation health, which are essential for monitoring spatial and temporal impacts of drought upon local landscapes.
2. Materials and methods
2.1. Case study
District Tuy Phong is located in the Northeast of Binh Thuan Province, Southern Coast of Vietnam (centered at 11°11′43″N, and 107°31′34″ E), covering approximately 755 km2, with a 2015 population of around 188,000 (). Much of this region is characterized by a typical tropical wet and dry climate with a distinctive Monsoon summer wet season (May–October) and a winter dry season (November–the following April). However, a narrow zone parallel to the coastline gives this region’s climate a distinctive arid character, uncharacteristic of the humid tropical climate of the majority of Vietnam. During summer months, the Southwest Monsoon brings moisture to Vietnam from the southwest, traversing the Truong Son through the Central Highlands, then descends the steep eastern slopes, likely with a rain-shadow effect reducing rainfall totals along Vietnam’s central coast. In addition, upwelling related to the steep offshore topography near Binh Thuan’s coastline likely creates cooler coastal currents (Jianyu et al. Citation2000; Chen et al. Citation2012), possibly stabilizing the lower atmosphere and further reducing opportunities for local summer rainfall. Annual rainfall here is often below 250 mm (mm) per year, concentrated mostly in the rainy season (May–October), while annual temperature is quite high, above 30°C. During the dry season, normally extending the six months from November to the following April, the precipitation is usually less than 50 mm per month, or even lower than 1-mm rainfall per month during 3–4 months. Such effects intensify the semiarid conditions prevailing over the broader region, accentuating aridity of the coastal zone, and leading to the distinctive coastal sand dunes, xerophytes, and desertification processes that are currently observed in this region.
One significant characteristic of Tuy Phong’s climate is the occurrence of the Xiaoman in the end of dry season. The Xiaoman (or Soman) is the Chinese name that describes a special weather event in the East Asian region, which lasts around 2 weeks from the end of May to the middle of June. The Xiaoman is considered to be earliest sign of the beginning of the rainy (stormy) season due to the significant increase of rainfall that may occasionally lead to local flooding. The main stormy season will begin later, depending on the location. For example, in our study area, the stormy season usually starts in the end of August. The Xiaoman provides a very important freshwater resource for reservoirs, supplying a seasonal reserve of freshwater for agriculture, and households, in the interval before the rainy season starts.
During past decades, Tuy Phong has suffered several severe to extreme droughts. Prolonged drought has led to many environmental and social impacts in this district, such as the threat of water scarcity for agriculture and households, changes of land use () and of increased wildfire risk (Pham, Binh, and Huong Citation2012). The 2014–2015 dry season was the most severe recorded drought in Tuy Phong: all three of the largest local reservoirs experienced dramatic declines; water levels in Da Ba Lake fell dramatically to 800,000 cubic meters, compared to its 4.5 million cubic meter design capacity (a decline of 90%); local people in the communes of Vinh Hao, and Vinh Tan could not practice agriculture due to the water shortage. In Vinh Hao commune, available water resources could serve only 600 of the 1,800 households, forcing many to pay out-of-pocket costs at the relatively high rate of 90,000–250,000 VND (4–12 USD) per cubic meter of water.
In addition to impacts of drought, and declines in local food production, populations suffered other difficulties, such as pressure of population, which is increasing rapidly, doubling in just 13 years: from 90,000 in 2002 to 188,000 in 2015. Because freshwater is not sufficient for irrigation, the local population may face risk of food shortages. Additionally, a rapid rate of land use change with expansion of agriculture without parallel development of management and irrigation systems will accelerate processes of land degradation. Then, when drought happens, such processes increase rates of desertification, consequently degrading arable lands. While there are many studies of Binh Thuan province (Gobin et al. Citation2012; Tran, Hoa, Dinh, and Thanh Citation2015), and of neighboring districts – Bac Binh (Le and Dao Citation2015), there is little research, or reference data that provides insight on local drought, its effects upon the entire province, specifically for Tuy Phong, and how the local population of Tuy Phong has been reacting to this hazard. This present research can develop knowledge about role of drought episodes in promoting local desertification processes, and improving local knowledge to combat effects of drought. Our review of French, English, and Vietnamese research reveals only sparse meteorological and climatic records for this region, as might be expected for a locality peripheral to the nation’s principal population, industrial, and agricultural concerns. Therefore, satellite image archives provide one of the few resources that can provide accessibility, continuity, and consistency for an inquiry into the nature and impacts of changing drought in this region.
2.2. Data resources
Available Landsat images (Path 123, Row 52) with less than 10% cloud cover, entirely covering the district, were selected and downloaded from GLOVIS (http://glovis.usgs.gov) for both dry and wet seasons of 1989, 1994, 1999, 2004, 2009, 2013, 2014, 2015, and 2016. Though all images were processed at Level 1, only 3 bands of each image were investigated in this research (red band, near-infrared (NIR) band, and the thermal band). Because of the 27-year interval, images from 1989–2009 were acquired by Landsat 5 TM, and others from Landsat 8 OLI-TIRS. Although Landsat 7 ETM+ imagery is available for this study site, to minimize the number of sensors employed for this study, only these two datasets were used here. We used bands 3–4-6 for Landsat 5 TM, and bands 4–5-10 for Landsat 8, as red-NIR-thermal, respectively. Thermal bands for both systems have coarser spatial resolutions than do the two other bands; at Level 1 processing, they were resampled by Cubic Convolution to match the 30 m pixel size as the red and NIR bands.
Otherwise, for validation, MODIS data also were collected. As mentioned on its original website of NASA, MODIS (Moderate Resolution Imaging Spectroradiometer) is “a key instrument aboard the Terra Satellite, and the Aqua Satellite (https://modis.gsfc.nasa.gov/about/)”. These two satellites form the core of the Earth Observation Missions, which are also known as the EOS AM-1 (morning acquisition), and the EOS PM-1 (afternoon acquisition). MODIS data are acquired globally every 1 or 2 days in 36 spectral bands including visual spectral region, and the thermal bands at 250-m, 500-m, and 1-km resolution. Thus, applications of MODIS products are widespread in land assessment, ocean studies, atmospheric studies, environmental protection and management. Additionally, MODIS data can form the basis for accurate validation, and monitoring models of global variation of surface temperature, and vegetation dynamics. Other data products, which are commonly used for modeling global variation of temperature and vegetation, are derived from the Advance Very High Resolution Radiometer (AVHRR), and the Visible Infrared Imaging Radiometer Suite (VIIRS) at 4-km resolution. However, because of the disadvantages of coarser resolution of the VIIRS, and the lack of cloud-free AVHRR data, for our study area, we investigated MODIS Terra products as prospective validation for our study.
Because of the large number of MODIS images, we used 8-day Terra composite for Surface Temperature data, and 16-day Terra composite for vegetation index – NDVI, respectively. Our time range for data is dry seasons (November to April) from 2013 to 2016, approximately, 24 NDVI images, and 48 LST per season. outlines the overall nature of Terra products as reference at https://lpdaac.usgs.gov/dataset_discovery/modis/modis_products_table.
Table 1. MODIS data description.
3. Methodology
3.1. Image preprocessing
Because images were collected from different sensors (Landsat 5 TM, and Landsat 8 OLI), in order to obtain values of NDVI and LST, two sets of algorithms were applied to derive at-sensor reflectance (or Top of Atmospheric reflectance – TOA) of three bands: Red, NIR, and Thermal. Following the Landsat user guides for TM and OLI, the processing procedure for these images is similar, which requires several steps: co-registration, radiometric calibration, atmospheric correction, sun angle correction, topography, and normalization. Algorithms can be generally established by converting the digital number of each pixel to radiance, then from radiance to surface reflectance. shows the overall procedure to achieve final results.
3.2. NDVI calculation
During the early 1980s, the NDVI was defined and developed by scientists at NASA’s Goddard Space Flight Center, Greenbelt, Md. for monitoring vegetation health based on the difference between absorption and reflectance of green leaves of red and near-infrared band of visible light, respectively (Tucker Citation1979). The value of NDVI of each pixel was estimated by dividing the reflectance difference by the sum between NIR and Red band; NIR ranges from 0.7 to 1.1 µm, while Red ranges from 0.58 to 0.68 µm. Normally, values of NDVI range from −1 to +1, with +1 indicating healthy vegetation cover, and lower values representing stressed vegetation, and negative values representing open water, or high moisture content respectively. The higher NDVI values are, the healthier vegetation is. The range value of NDVI in wet seasons is much wider than in dry seasons.
In addition, NDVI also was used to extract Land Surface Emissivity (LSE), which is an adjustable parameter in correcting Land Surface Temperature in the next step. Values of LSE were calculated based on the proportion of vegetation (Sobrino, Jiménez-Muñoz, and Paolini Citation2004; Jiménez-Muñoz et al. Citation2014).
Whereas, Pv is the proportion of vegetation, based on a normalized NDVI value of each pixel.
3.3. Retrieval of LST
Land Surface Temperature (LST) was derived from the Top of Atmosphere Brightness Temperature (T) as formula (4) where K1 and K2 are Thermal conversion constants for band 6 for Landsat 5 TM and band 10 for Landsat 8 OLI (10.8 µm), and Lλ is spectral radiance.
There are algorithms applied to transfer BT for LST, such as “single channel model” (Sobrino, Jiménez-Muñoz, and Paolini Citation2004), “split window” (Yu, Guo, and Zhaocong Citation2014) or “mono window” (Wang et al. Citation2015). In this case study, the “single channel model” was investigated in conducting LST (unit: Celsius degree).
Whereas, BT is Brightness Temperature (4) (Kevin) λ is the band wavelength (μm); ρ = 14380; LSE is Land Surface Emissivity (2). Here, ρ = h*c/ς, with h is Plank’s constant (6.626*10−34Js), c is light velocity (3*108 m/s) and ς is the Boltzmann constant (1.38 *10–23 J/K).
3.4. VHI estimation
The VHI was established by the contribution of two indices derived from NDVI and LST for all observed years (27 years from 1989 to 2016 in this case). Two indices are related to moisture conditions – Vegetation Condition Index, and thermal conditions – Temperature Condition Index (Kogan Citation1995). The equations are below:
While, NDVI: value of NDVI at time of observation
NDVImin = 27-year absolute maximum NDVI
NDVImax = 27-year absolute minimum NDVI
LST: value of LST at time of observation
LSTmax = 27-year absolute maximum LST
LSTmin = 27-year absolute minimum LST
“a” is the coefficient of different weighting between VCI and TCI. The value of “a” depends on differencing conditions of moisture and temperature. In case of unknown moisture conditions, “a” is set to 0.5, which signifies that VCI and TCI are equally weighted for VHI estimation.
Values of VHI rank from 0 to 100 indicating extreme stress of vegetation condition to healthy vegetation. When drought happens, its severity can be categorized from extreme to no drought according to VHI values (see ).
Table 2. Categorizing drought severity upon VHI values (Kogan Citation1995; Le Hung and Hoai Citation2015).
3.5. MODIS data processing
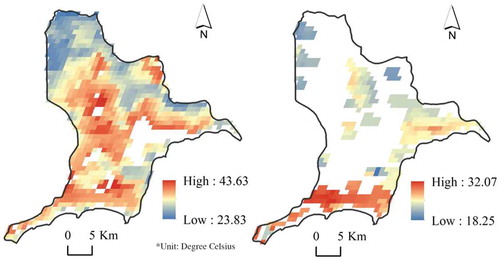
Methods to process MODIS imagery are similar to the Landsat procedures for generating the three main indexes: VCI, TCI, and VHI. Maximum and minimum values of NDVI, and LST were statistical values from the monthly values retrieved from monthly composite products starting from February 2000. One of the difficulties processing composite images of surface temperature from MODIS is the presence of gaps from prevailing cloud cover. shows gaps between pixels on the 22 March image (on the right), and 1 November 2015 image (on the left). When the gap is too large, that image will be removed from the procedure, but retained when the gap is small enough (missing fewer pixels, such as 5 to10 pixels, for example), in such instances, we applied nearest neighbor interpolation to generate values of the missing pixels.
Figure 2. False color Landsat images of the study area from January 1989 to January 2015 show land use changes over 26 years, with the expansion of agriculture (3), shrimp fishing, and solar salterns (4).
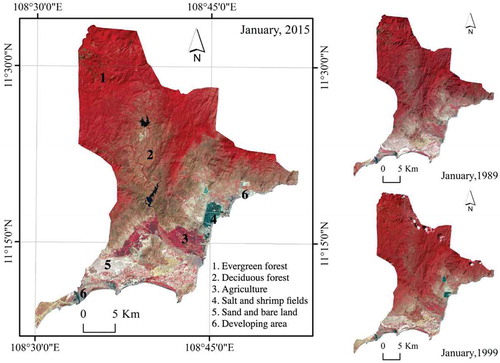
Figure 3. Flowchart of image processing and analyzing. should be shown in section 3.1. Image preprocessing.
Figure 4. MODIS surface temperature captured on 03/22/2015, and 11/01/2015. The white color inside the border shows gaps due to missing pixels of composite products. should be shown in section 3.5. MODIS data processing
4. Results and discussion
4.1. Correlation between NDVI and LST
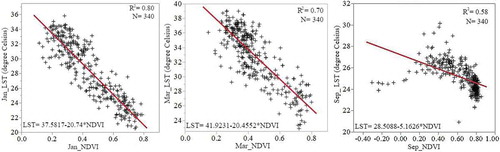
A linear regression model was constructed to survey the relationship between LST and NDVI across dry and wet seasons. Results demonstrate that the various distributions of LST–NDVI correlations depend on seasonal conditions. shows that in wet season (September), there were more variables compared to dry season (January and March), and the slope of the fitted line also increased across the seasonal transition from dry to wet. R2, on the other side, dropped from near 0.8 to 0.58 (from January to September), which means that in the wet season, due to increases of moisture and air temperature, relationships between LST and NDVI were not significant, so the vegetation responses (NDVI) are only loosely related to thermal conditions (LST). Conversely, during the dry season, temperature can be effective in explaining and in predicting the stress of vegetation health, and it can potentially estimate effects of vegetation drought when temperature is high, and rainfall is low.
Figure 5. LST–NDVI correlations during dry to wet season, 2015 (from left to right: January, March and September). Note: there is a significant increase of the slope from −20.74 (Jan) to −5.16 (Sep). There are outliers in the March graph, caused by clouds (NDVI values can be affected by some conditions such as clouds, snow, or ice).
Overall, there was a significant negative relationship between LST and NDVI. This result is because likely Tuy Phong is located at 11°N (a lower latitude), where weather is hot and humid. Soil and atmospheric moisture have distinctive impacts on the response of vegetation to changes in temperature (Sun and Kafatos Citation2007).
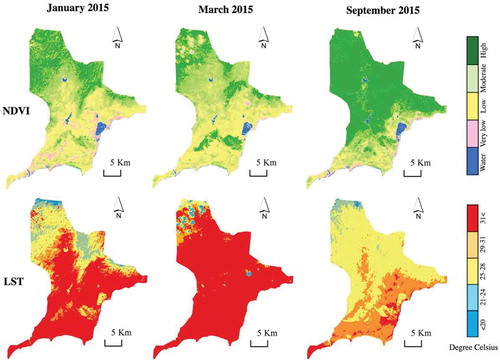
Other research investigating the relationships between LST and NDVI also showed that, at higher latitudes, the slope will gradually change from negative to positive (Karnieli et al. Citation2010). The spatial relationships between LST and NDVI are represented in . During the dry season, density of vegetation declined, and temperatures were very high, and during the middle dry season, the vast majority of the area had surface temperatures higher than 31°C (red color). During wet season, vegetation was denser, the surface temperature was down, but varied. There was also a higher temperature even in highly dense vegetated areas.
Figure 6. Simply classified NDVI (top) and LST (bottom) in January, March and September in 2015 (from left to right). Throughout a year, coastal areas, where there are low NDVI vales, and high temperatures, are potentially impacted by drought.
4.2. Spatial distribution of drought severity
Based on statistical data of 27 years of NDVI and LST in both dry and wet seasons, the maximum and minimum values of both LST and NDVI were selected (see ) for the three recent dry seasons from 2013 to 2016, and for calculation of VCI, and TCI. Monthly values of NDVI and LST in both dry and rainy seasons of each year give a comprehensive sense of the wide range of values and variations of both NDVI and LST (). Monthly records during dry season in 2014 and 2015 showed the highest temperatures, which were over 42°C, while the lowest temperatures were recorded in mountainous area in 1994. The values of NDVI were difficult to obtain because of fluctuations of vegetation responses each month. Generally, high values of NDVI were recorded in wet seasons, while lowest values were in dry seasons. is the graph of monthly mean NDVI and LST values from November 2013 to April 2016, which show increasing trend of temperatures from early to end of season, and the negative response (declination) of vegetation indexes. In order to estimate VHI, the “a” coefficient selected as 0.5, equally contributing to VCI and TCI. shows selected statistical values of NDVI and LST for the three recent dry seasons.
Table 3. Selected values of NDVI and LST used to calculate VCI and TCI.
Table 4. Selected values of NDVI and LST for MODIS data.
Figure 7. From upper to lower: Vegetation Condition Index, Temperature Condition Index and Vegetation Health Index of three dry seasons (November to April), from left to right: 2013–2014, 2014–2015, and 2015–2016. All show increases of moisture and thermal stress in vegetation near the coast of the study area, where land is used for crop production. The combination of those stresses accelerated drought severity, and consequently increased to risks of agricultural losses. should be shown in the section 4.2. Spatial distribution of drought severity.
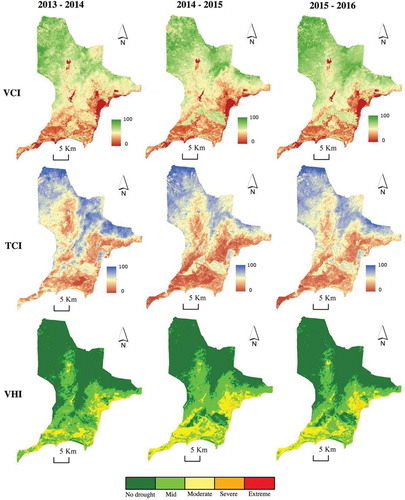
Maps shown on represent spatial distributions of VCI, TCI and VHI. Values of VCI and TCI range from 0 to 100, revealing the stress of reduced water availability, and temperature increases upon vegetation during dry season (the smaller the values are, the greater the stress upon vegetation health is). The VHI maps were categorized simply into five levels of drought severity, from no drought to extreme (green to red, respectively). During dry season 2014–2015, approximately two-thirds of Tuy Phong district was under drought condition (from mid-to-severe drought – ). During the 2015–2016 dry season, the drought-affected areas declined, severe drought areas increased, which means that areas vulnerable to drought increased, and droughts were more intensive. Furthermore, drought impacts were especially serious in communes near the coast (in the East), such as Hoa Phu, Binh Thanh, Phong Phu, Phu Lac, Vinh Hao. Vinh Hao commune was the most severely influenced area. We did not observe any extension of agricultural drought into the beginning of wet seasons because of the regular occurrence of the Xiaoman, marking the start of growing season.
Figure 8. Graphs of mean NDVI (green) and mean LST(red) during three recent dry seasons.
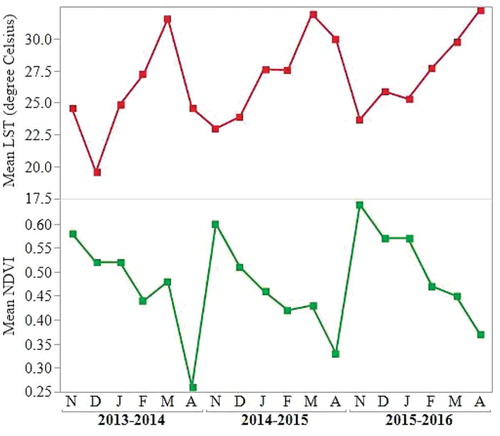
Figure 9. Areas influenced by drought within vulnerable categories.
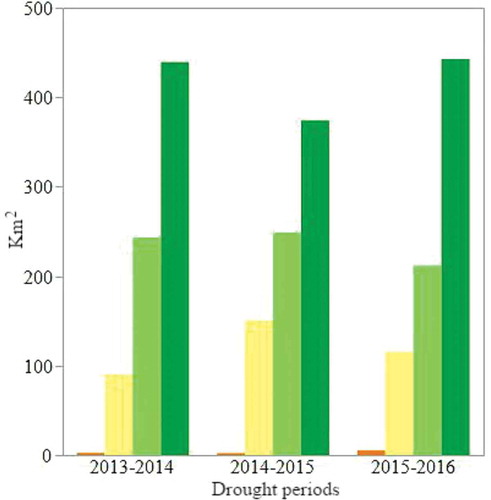
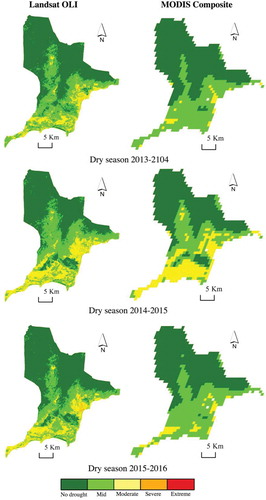
Figure 10. Maps of drought severity upon the VHI values of Landsat OLI, and MODIS data.
4.3. MODIS–VHI validation
The six maps of drought severity that were generated by the VHI values from MODIS and Landsat data of three dry seasons 2013–2014, 2014–2015, and 2015–2016 (see 0), illustrate the same intensification of drought-influenced areas. And the 2014–2015 dry season is the period when drought occurred, and affected the largest area, especially areas near the coast. In addition, that period was also recorded as severe, and widespread drought in local, and governmental reports. shows selected values of NDVI and LST extracted from MODIS data for calculating the VHI.
Nevertheless, for the 2015–2016 dry season, although MODIS imagery depicted a significant declining pattern of drought severity, we observed a slight decrease in affected area comparing to the 2014–2015 from the Landsat data. That difference arises from some missing MODIS temperature data due to the big gap of pixels, and accuracy can be affected by the nearest neighbor resampling procedure. Otherwise, the MODIS maps only show general patterns of drought effects, which are moderate, and mid drought. However, Landsat data permits not only assessment of areas at severe drought level (orange color in the map), but also assessment of drought patterns (both severity and duration) monitored with identification of specific location. Thus, applying Landsat data is an appropriate method to monitor drought vulnerability in small and remote areas.
5. Conclusion
This study examined drought conditions within a relatively small rural region of the Central Coast of Vietnam. This region, within Binh Thuan Province, has a distinctive climate, characterized by pronounced aridity adjacent to the coastline, but diminishing with increasing distance inland. Because this region lacks the history of climate records that would normally support investigation of recent climatic trends, analysis of sequential multispectral satellite imagery provides an opportunity to both document impacts of recent drought conditions, and to highlight the value of such imagery in remote regions lacking suitable weather and climate records.
Our results confirm that data collected at relatively fine spatial detail, acquired at relatively long temporal intervals, such as LANDSAT data, are useful for recording and monitoring vegetation health. A further analysis to cross-validate these findings with MODIS data, which are acquired more frequently, but at coarser resolution, shows the same patterns that we observed from Landsat data of our study area.
However, it is necessary to take into account additional parameters to indicate drought severity, such as water capacity and rainfall, not used in this study. Finally, studies such as this one need to consider local policies, management, and carrying capacity. These factors play important roles in understanding behavior of local people when drought occurs. Because drought is very closely linked to processes of land degradation, and desertification, land that is heavily impacted by drought, without local management, will be gradually degraded. The recent Belgian-Vietnamese project (for a larger area within our region) (Gobin et al. Citation2012) used meteorological data to consider global climate change in its development of a climate change model that involved drought as a climatic abnormality. Testing that model using recent weather records can be used to validate our results. We expect to investigate applicability of our remote sensing approach to study drought vulnerability for the entire province.
Acknowledgments
We acknowledge with thanks the Vietnamese Government, and the Vietnam International Education Development for their funding support for Hoa Tran to pursue a PhD program at Virginia Tech. We are very much thankful to Virginia Tech – Graduate School and the Interdisciplinary Graduate Education Program (IGEP) for their contributions to our research. We express our thanks to Dr. Randolph H. Wynne (Department of Forest Resources and Environmental Conservation, Virginia Tech), Dr. Steve C. Hodges (Department of Crop and Soil Environmental Sciences, Virginia Tech), Dr. Yang Shao (Department of Geography, Virginia Tech), and Dr. Winston Chow (Department of Geography, National University of Singapore) for their suggestions, and encouragement to the evolution of our research ideas. We are grateful to the Guest Editor of the GIScience Remote Sensing, and reviewers for their thorough recommendation, and suggestions for revising our paper.
Disclosure statement
No potential conflict of interest was reported by the authors.
References
- Bai, Z., and D. Dent. 2009. “Recent Land Degradation and Improvement in China.” Ambio 38 (3): 150–156. doi:10.1579/0044-7447-38.3.150.
- Cai, G., D. Mingyi, and Y. Liu. 2011. Regional Drought Monitoring And Analyzing Using Modis Data — A Case Study In Yunnan Province. Regional Drought Monitoring And Analyzing Using Modis Data — A Case Study In: Li D., Liu Y., Chen Y. (eds) Regional Drought Monitoring And Analyzing Using Modis Data — A Case Study In Agriculture IV. Regional Drought Monitoring And Analyzing Using Modis Data — A Case Study In 2010. IFIP Advances in Information and Communication Technology, vol 345. Springer, Berlin, Heidelberg. doi:10.1007/978-3-642-18336-2_29
- Chen, C., R. C. Zhigang Lai, Q. X. Beardsley, H. Lin, and N. T. Viet. 2012. “Current Separation and Upwelling over the Southeast Shelf of Vietnam in the South China Sea.” Journal of Geophysical Research 117. doi:10.1029/2011JC007150.
- Doi, R. D. 2002. Remote Sensing and Its Application: A Monograph Monitoring Vegetal Landcover and Desertification. Jaipur: University Book House.
- Gobin, A., L. T. Hai, P. H. Linh, L. Hens, P. Ozer, L. T. T. Hien, N. T. Binh, and P. Q. Vinh. 2012. Impact of Global Climate Change and Desertification on the Enivronment and Society in the Southern Centre of Vietnam (Case Study in Binh Thuan Province). Belgium, Vietnam.
- Hirche, A., M. Salamani, A. Abdellaoui, S. Benhouhou, and J. M. Valderrama. 2011. “Landscape Changes of Desertification in Arid Areas: The Case of South-West Algeria.” Environ Monit Assess 179 (1–4): 403–420. doi:10.1007/s10661-010-1744-5.
- Jianyu, H., H. Kawamura, H. Hong, and Q. Yiquan. 2000. “A Review on the Currents in the South China Sea: Seasonal Circulation, South China Sea Warm Current and Kuroshia Intrusion.” Journal of Oceangraphy 56: 607–624. doi:10.1023/A:1011117531252.
- Jiao, W., L. Zhang, Q. Chang, F. Dongjie, Y. Cen, and Q. Tong. 2016. “Evaluating an Enhanced Vegetation Condition Index (VCI) Based on VIUPD for Drought Monitoring in the Continental United States.” Remote Sensing 8 (3): 224. doi:10.3390/rs8030224.
- Jiménez-Muñoz, J. C., J. A. Sobrino, D. Skokovic, C. Mattar, and J. Cristóbal. 2014. “Land Surface Temperature Retrieval Methods From Landsat-8 Thermal Infrared Sensor Data.” Ieee Geoscience and Remote Sensing Letters 11 (10).
- Karnieli, A., R. T. Nurit Agam, M. A. Pinker, M. L. Imhoff, G. G. Gutman, N. Panov, and A. Goldberg. 2010. “Use of NDVI and Land Surface Temperature for Drought Assessment: Merits and Limitations.” Journal of Climate 23 (3): 618–633. doi:10.1175/2009jcli2900.1.
- Kogan, F. 1994. “Drought Monitoring from NOAA Polar-Orbiting Satellites - Principles, Development, and Verification.” Soviet Journal of Remote Sensing 11 (8): 575–593.
- Kogan, F. N. 1990. “Remote-Sensing of Weather Impacts on Vegetation in Nonhomogeneous Areas.” International Journal of Remote Sensing 11 (8): 1405–1419. doi:10.1080/01431169008955102.
- Kogan, F. N. 1995. “Application of Vegetation Index and Brightness Temperature for Drought Detection.” Natural Hazards: Monitoring and Assessment Using Remote Sensing Technique 15 (11): 91–100.
- Le, H. T., and K. H. Dao. 2015. “Drought Risk Evaluation Using Remote Sensing: A Case Study in Bac Binh District, Binh Thuan Province.” Scientific Journal of Educational University of Ho Chi Minh City 5: 70.
- Le Hung, T., and D. K. Hoai. 2015. “Drought Risk Evaluation Using Remote Sensing: A Case Study in Bac Binh District, Binh Thuan Province.” Scientific Journal of Ho Chi Minh Educational University 5.
- Orhan, O., S. Ekercin, and F. Dadaser-Celik. 2014. “Use of Landsat Land Surface Temperature and Vegetation Indices for Monitoring Drought in the Salt Lake Basin Area, Turkey.” Scientific World Journal 2014: 1–11. doi:10.1155/2014/142939.
- Pandey, P. C., M. Rani, P. K. Srivastava, L. K. Sharma, and M. S. Nathawat. 2013. ““Land Degradation Severity Assessment with Sand Encroachment in an Ecologically Fragile Arid Environment.” A Geospatial Perspective.” Qscience Connect 2013: 43. doi:10.5339/connect.2013.43.
- Peters, A. J., A. Elizabeth, L. J. Walther-Shea, A. Vina, M. Hayes, and M. D. Svoboda. 2002. “Drounght Monitoring with NDVI-Based Standardized Vegetation Index.” Photogrammetric Engineering & Remote Sensing 68 (1): 71–75.
- Pham, Q. V., N. T. Binh, and B. T. T. Huong. 2012. “Drought Zoning for Binh Thuan Province in Vietnam Based on Eto Calculator and GIS.” Geoinformatics for Spatial-Infrastructure Development in Earth and Allied Sciences.
- Sobrino, J. A., J. C. Jiménez-Muñoz, and L. Paolini. 2004. “Land Surface Temperature Retrieval from LANDSAT TM 5.” Remote Sensing of Environment 90 (4): 434–440. doi:10.1016/j.rse.2004.02.003.
- Sun, D., and M. Kafatos. 2007. “Note on the NDVI-LST Relationship and the Use of Temperature-Related Drought Indices over North America.” Geophysical Research Letters 34: 24. doi:10.1029/2007gl031485.
- Tran, Hoa, J. B. C., T. T. Dinh, and H. T. Thanh. 2015. “Detecting Sand Movement: A NDVI Time Series Analysis (Binh Thuan Case Study).” In Vietname - Poland International Conference. Hanoi.
- Tucker, C. J. 1979. “Red and Photographic Infrared Linear Combinations for Monitoring Vegetation.” Remote Sensing of Environment 8 (2): 127–150. doi:10.1016/0034-4257(79)90013-0.
- Valiente, J. A., R. Niclos, M. J. Barbera, and M. J. Estrela. 2010. “Analysis of Differences between Air-Land Surface Temperatures to Esitimate Land Surface Air Temperature from MSG Data.” Spanish Ministerio De Ciencia E Innovación (CONSOLIDER-INGENIO 2010 CSD2007-00067).
- Wang, F., Z. Qin, C. Song, T. Lili, A. Karnieli, and S. Zhao. 2015. “An Improved Mono-Window Algorithm for Land Surface Temperature Retrieval from Landsat 8 Thermal Infrared Sensor Data.” Remote Sensing 7 (4): 4268–4289. doi:10.3390/rs70404268.
- Yu, X., X. Guo, and W. Zhaocong. 2014. “Land Surface Temperature Retrieval from Landsat 8 Tirs—Comparison between Radiative Transfer Equation-Based Method, Split Window Algorithm and Single Channel Method.” Remote Sensing 6 (10): 9829–9852. doi:10.3390/rs6109829.