
 ?Mathematical formulae have been encoded as MathML and are displayed in this HTML version using MathJax in order to improve their display. Uncheck the box to turn MathJax off. This feature requires Javascript. Click on a formula to zoom.
Abstract
Although poor precipitation due to delayed arrival and/or early retreat of the southwest monsoon is considered the chief architect of drought in India, heat waves may also play a crucial role in the intensification of droughts. In the Indian subcontinent, occurrence of heat waves during the pre-monsoon and high air-temperature in the subsequent monsoon season imparts thermal stress on vegetation causing degradation of vegetation health (VH). In the present study, various vegetation indices and land-use/land-cover data derived from multi-sensor satellite have been used to assess VH and agricultural drought in Gujarat during 1981–2010. This Geographical Information Systems-based study has also used heat wave and temperature data to analyze the adverse effects of high temperature on VH. The time series of Vegetation Condition Index and Temperature Condition Index (TCI) has shown that the combined influence of moisture-stress and thermal stress determines the occurrence and severity of drought, which is reflected in the Vegetation Health Index (VHI). A strong correlation among aboveground air-temperature, the TCI and the VHI indicates definite influence of thermal stress on VH. Further, a systematic variation and strong resemblance between temperature, crop yield, TCI and VHI has established the impact of thermal stress on agricultural productivity.
1. Introduction
Drought is caused by sudden and significant deficiency in precipitation, resulting in acute water scarcity, remarkable shortage of soil moisture and reduced crop yield (CY). While meteorological droughts occur mainly due to deficient precipitation, agricultural droughts develop due to the impact of meteorological and hydrological droughts. Severity, duration and spatial extent of agricultural droughts vary from place to place and time to time depending on various other factors such as late arrival and/or early retreat of the monsoon, duration of dry spell, lack of irrigation water, etc. Among the widely used drought indices that monitor and assess meteorological and hydrometeorological droughts, some do not consider at all the effect of temperature on drought development (e.g. Rainfall Anomaly Index proposed by Van Rooy Citation1965; Deciles proposed by Gibbs and Maher Citation1967; Standardized Precipitation Index (SPI) proposed by McKee, Doesken, and Kleist Citation1993) while others (e.g. Marcovitch’s Index proposed in Marcovitch Citation1930; Palmer Drought Severity Index proposed by Palmer Citation1965; Crop Moisture Index proposed by Citation1968; Soil Moisture Deficit Index and the Evapotranspiration Deficit Index developed by Narasimhan and Srinivasan Citation2005; Standardized Precipitation Evapotranspiration Index proposed by Vicente-Serrano, Beguria, and Lopez-Moreno Citation2010; Standardized Evapotranspiration Deficit Index proposed by Kim and Rhee Citation2016; etc.) address the indirect influence of temperature in terms of increase in evapotranspiration. Heat waves and high temperatures actually might have more intense and direct effect on vegetation by burning the plan tissue, and may cause permanent damage to plant growth and development (Hasanuzzaman et al. Citation2013; Lipiec et al. Citation2013). This is more so particularly in tropical and subtropical climates, where heat stress may become a major factor for crop failure (Wheeler et al. Citation2000; Wahid et al. Citation2007; Schlenker and Roberts Citation2009; Deryng et al. Citation2014). Various researchers pointed out the impact of heat waves and high temperature on drought initiation (Dai, Trenberth, and Qian Citation2004), drought intensification (Teuling et al. Citation2013; Rhee, Park, and Lu Citation2014), vegetation health (VH) (Kogan Citation1995; Kogan et al. Citation2003; Bhuiyan and Kogan Citation2010) and resulting agricultural droughts reduced CY (Bhuiyan, Singh, and Kogan Citation2006; Kogan, Powell, and Fedorov Citation2011; Swain et al. Citation2011; Gusso et al. Citation2014; Bandyopadhyay, Bhuiyan, and Saha Citation2015). However, in the process of drought analysis, generally the impact of high temperature is either overlooked or its role and influence on drought development and intensification is underestimated (Bandyopadhyay, Bhuiyan, and Saha Citation2016).
In the background of global warming, more intense, frequent and prolonged heat-wave events in the future have been predicted (Meehl and Tebaldi Citation2004; Seneviratne et al. Citation2012). In fact, occurrence of temperature extremes in recent times across the globe (Alexander et al. Citation2006; Hansen, Sato, and Ruedy Citation2012; Donat et al. Citation2013), as evident in Europe in the year 2003 (Meehl and Tebaldi Citation2004; Schär et al. Citation2004; Ciais et al. Citation2005) and in Russia in 2010 (Barriopedro et al. Citation2011), is an indication of a warmer climate in the future. A study by Deryng et al. (Citation2014) has predicted reduction in CY and food scarcity due to heat stress under ongoing global warming and climate change. Considering all these aspects, the present study focused on analysis of the role and influence of temperature on VH and agricultural drought development. The effect of air-temperature on the thermal condition of vegetation and its subsequent impact on the overall health of vegetation were analyzed. Moreover, the dynamics of drought in the dryland agriculture of Gujarat were analyzed using agricultural crop production statistics, and the Vegetation Condition Index (VCI), Temperature Condition Index (TCI) and Vegetation Health Index (VHI) developed using the Normalized Difference Vegetation Index (NDVI) and thermal channel data of National Ocean and Administrative Agency (NOAA)–Advanced Very High Resolution Radiometer (AVHRR)-based satellite imagery. The VCI, TCI and VHI have been widely used for monitoring of VH, for the estimation of CY and for analysis of vegetative and agricultural droughts (Bhuiyan and Kogan Citation2010). The VH algorithms (VCI-TCI-VHI) have higher efficiency over other satellite-based methods and indices in monitoring weather-induced changes in vegetation, due to the combination of brightness temperature (BT) and NDVI. Efficiency of the VH algorithms in monitoring VH and in assessing vegetative drought severity was validated globally by various users (Kogan, Powell, and Fedorov Citation2011; Kogan, Salazar, and Roytman Citation2012). These indices (VCI-TCI-VHI) also were successfully used in forecasting production of varieties of crops both during drought and non-drought conditions (Unganai and Kogan Citation1998; Kogan, Salazar, and Roytman Citation2012; Yagchi, Liping, and Meixia Citation2015; Kogan, Povova and Alexandrova Citation2016) and also in the assessment of crop insurance (Bokusheva et al. Citation2016). The VHI in particular has been found efficient in determining empirical probability of agricultural drought occurrence (Rojas, Vrieling, and Rembold Citation2011). Again, using the extreme value theory on VHI, agricultural drought-risk in Ukraine was quantified by Skakun et al. (Citation2015). The VH algorithms have been used in the present study since impact assessment of thermal stress on vegetation is the main objective of this study, and since subtle changes in VH due to thermal stress could be successfully detected earlier through analysis of the VH indices, especially the TCI (Kogan Citation1995, Citation2001, Citation2002). Impact of heat waves and temperature extremes on the intensification of meteorological drought was already highlighted (Bandyopadhyay, Bhuiyan, and Saha Citation2016). Besides, their impact on dryland agriculture too was revealed through comparison of precipitation, potential evapotranspiration, crop-water requirement and moisture deficiency (Bandyopadhyay, Bhuiyan, and Saha Citation2015). This article has further provided evidences to establish and highlight the definite influence of temperature on VH and agricultural drought. Earlier studies (Bhuiyan Citation2004; Bhuiyan, Singh, and Kogan Citation2006) revealed that monitoring and assessment of drought severity using a single-parameter-based index such as the SPI does not provide a reliable picture of drought, and often misleads. Several studies (e.g. Denmead and Shaw Citation1961; Pollard and Thompson Citation1995; Porter and Semenov Citation2005; Lobell and Field Citation2007; Bhuiyan Citation2008; Deryng et al. Citation2014; Park et al. Citation2016) have revealed strong association of temperature with crop response; however, incorporation of temperature anomaly in drought monitoring and assessment is still by and large an exception rather than convention. This article has highlighted once again the influence of temperature both on moisture state and thermal state in vegetation, and thereby on VH and vegetative drought. The study advocates for real-time monitoring of thermal stress in vegetation, and inclusion of temperature parameters in the assessment of drought impacts. Besides, this study has revealed the potential of the VH indices in CY estimation, which may be explored further by combing seasonal land-use/land-cover (LULC) data. The interesting findings obtained through this Geographic Information System (GIS)-based time-series analysis have been discussed in the following sections.
2. The study area
The Gujarat state of India is located on the west coast of India between latitude 20°06′ N and 24°42′ N and longitude 68°100′ E and 74°28′ E, covering an area of 196,000 km2 (). Gujarat has the longest coastline (1600 km) among the mainland states of India. However, in spite of its location bordering the Arabian Sea, major parts of Gujarat possess arid to semiarid climate owing to its proximity to Thar – the Great Indian Desert to its north.
Figure 1. Spatial location of (a) Gujarat within India, (b) districts of Gujarat and location of the nine meteorological stations selected for the study. For full color versions of the figures in this paper, please see the online version.
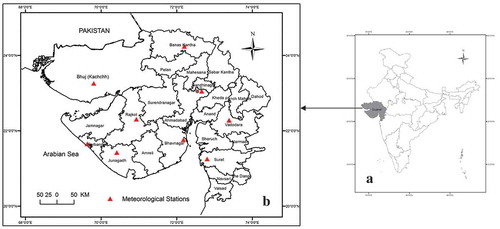
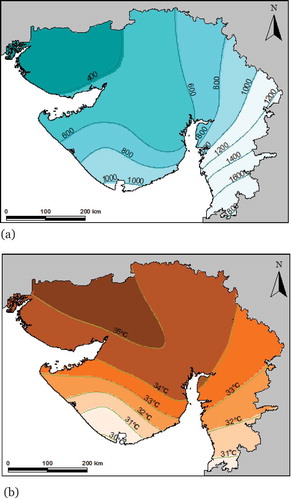
The overall environment of Gujarat is a result of the combined influence of topography, soil, vegetation and climate. The topography is characterized by vast plains with occasional small hilly tracts. Climate of the state is characterized by a large spatiotemporal variation in monsoon rainfall. Rainfall in Gujarat is governed by the southwest monsoon, and occurs mainly during late June to the end of September, which accounts for more than 90% of annual rainfall. Rainfall is unevenly distributed in the state varying in the range of 300–350 mm in Kachchh located in the northwest, within 600–700 mm in the South Central and northeastern Gujarat, to more than 1,500 mm in the southern Gujarat. The state is also associated with significant variation in seasonal temperature except the coastal regions. Although mean annual temperature of the state varies between 28°C and 33°C, mean summer (April–June) temperature is 40°C, and the maximum temperature at many places rises to 48°C, particularly during heat-wave events. Both spatial and temporal patterns of rainfall are different from those of temperature. Spatially rainfall gradually decreases and temperature increases from the southeast to the northwest of Gujarat ((,)). This eventually puts the northwestern part, particularly the Kachchh region under greater threat of aridity and drought (Bandyopadhyay, Bhuiyan, and Saha Citation2016).
Figure 2. (a) Isohyetal map showing long-term (1981–2010) mean monsoonal rainfall, and (b) isothermal map showing long-term (1981–2010) mean maximum temperature during the monsoon season.
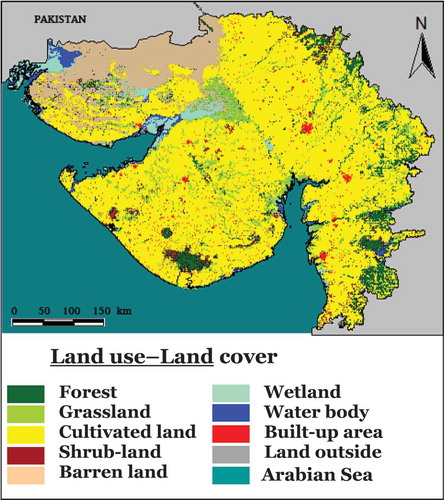
LULC data of Gujarat also vary seasonally across the state. While the arid Kachchh region in the northwest is mostly barren owing to its proximity to the Thar Desert and the salt deposit of the “Rann of Kachchh”, the eastern and southern parts of Gujarat are covered by natural vegetation and agricultural crops. The main LULC classes in Gujarat are cropland, fallow land, natural vegetation (forests), barren land, developed urban area and waterbodies. The dryland agriculture of Gujarat is associated with single-crop to multi-crop practices and varies both spatially as well as temporally depending upon the availability of irrigation water. “Kharif crops” are the main crops cultivated in the monsoon season and mostly rain-fed, whereas “Rabi crops” (winter crops) and summer crops are totally dependent on the availability of irrigation water and thus varies from year to year in terms of crop types, cropping patterns and spatial coverage. The principal “Kharif” crops include wheat, millet, sunflower, groundnut, pulses and seasonal vegetation. “Rabi crops” have lesser variety and mainly include wheat, cereals, castor, mustard, sugarcane and winter vegetables, whereas “summer crops” mostly include vegetables besides groundnut and millet.
Droughts are frequent in Gujarat, and drought-prone zones are widespread over all the agroclimatic regions of the state covering more than 60% area of the state, including heavy-rain area of southern Gujarat, hot and arid region in the northwest and the coastal zones (ACD Citation2012). The increased frequency and intensity of droughts in the last few decades has resulted in acute drinking water scarcity across the state (Planning Commission Report Citation2007) besides affecting the dryland agriculture of the state.
3. Data, index and methodology
3.1. Data
The present study considered both ground station data as well as remotely sensed multi-sensor satellite data. The various data used include
Monthly data of mean maximum temperature of 30 years (1981–2010) from nine meteorological stations across Gujarat, namely Ahmedabad, Banas Kantha, Bhavnagar, Junagadh, Bhuj, Porbandar, Rajkot, Surat and Vadodara, covering all agroclimatic zones, were collected from India Meteorological Department (IMD), Pune.
Monthly data of precipitation (rainfall) of 30 years (1981–2010) for the aforesaid nine meteorological stations across Gujarat were procured from IMD, Pune.
Data of number of heat-wave days (HWD) and category of heat waves during 1981–2010 for the selected nine meteorological stations of Gujarat were also collected from IMD, Pune.
NOAA AVHRR 4-km resolution weekly STAR Global VH products (VCI, TCI and VHI) were downloaded from NOAA Star Center for Satellite Applications and Research (http://www.star.nesdis.noaa.gov/smcd/emb/vci/VH/vh_ftp.php) website.
GlobeLand30 database with 30-m resolution GLC30 (Citation2010) (http://www.globallandcover.com) generated by National Geomatics Center of China using Landsat TM, ETM+ and Chinese Environmental Disaster Alleviation Satellite (HJ-1) images collected from 2008 to 2010 have been used as reference database in this article.
Year-wise and district-wise data of crop production statistics were retrieved from the web portal of the Government of India for all the districts of Gujarat for the years 2001–2010.
3.2. Vegetation indices
The NDVI developed by Rouse et al. (Citation1974) is the most widely used vegetation index that reflects the vegetation condition through the ratio of responses in near-infrared (Ch2) and visible (Ch1) bands of the AVHRR of NOAA. It is expressed as
The stress developed in vegetation during droughts is closely related to weather impacts. However, in the NDVI, the weather component gets subdued by strong ecological component. To overcome this limitation of the NDVI, other vegetation indices such as the VCI, TCI and VHI were further developed (Kogan Citation1995) using the following equations:
where NDVI, NDVImin and NDVImax are the seasonal average of smoothed weekly NDVI, its multiyear absolute minimum and its maximum, respectively; BT, BTmin and BTmax are similar values for BT (Kogan Citation2001). BT values are obtained from the thermal band (Ch4) of the NOAA-AVHRR.
While the NDVI shows seasonal vegetation dynamics, the VCI rescales vegetation dynamics in between 0 and 100 to reflect relative changes in moisture condition from extremely bad to optimal (Kogan et al. Citation2003). Thus, the VCI separates the short-term weather-related NDVI fluctuations from the long-term ecosystem changes (Kogan Citation1990, Citation1995). Since favorable weather provides optimal moisture condition, high values of the VCI correspond to healthy and unstressed vegetation. On the other hand, low TCI values correspond to thermal -stress in vegetation due to high temperature and dryness. The TCI provides opportunity to identify subtle changes in VH due to thermal effect as drought proliferates when moisture shortage is accompanied by high temperature (Kogan Citation2002). Kogan (Citation1995, Citation2001) formulated, computed and applied these indices for detection and analysis of VH based on the smoothed weekly NDVI and BT values. The VCI, TCI and VHI were classified and plotted following the scheme () developed for vegetative drought assessment (Bhuiyan Citation2004). In the present study, these parameters were calculated for the monsoon season by taking average of the weekly values.
Table 1. Classification of the VCI, TCI and VHI and corresponding color schemes to depict, respectively, moisture-stress, thermal stress and vegetation health.
3.3. Methodology
This study involved analysis of data of different kinds and of different parameters. For the computation of number of HWD and its category, the guidelines of the IMD were followed. On the basis of the mean maximum temperature at the station and the observed departure from it, heat waves were classified by the IMD (Citation2015) into three categories, viz. (1) category I (maximum temperature of station below 40°C): moderate heat wave (MHW) if the departure is 5–6°C but severe heat wave (SHW) if it is more than 6°C; (2) category II (maximum temperature of station above 40°C but below 45°C): MHW if the departure is 4–5°C but SHW if it is 6°C or more; and (3) category III (observed maximum temperature continues to be 45°C or more): a SHW. Following these criteria, MHW days and SHW days were calculated for the nine selected stations in Gujarat for the period 1981–2010.
Ground data of temperature from nine meteorological stations were interpolated using spline interpolation technique in order to understand its spatiotemporal variation. Precipitation and land-surface temperature are interdependent and generally bear an inverse association. Therefore, while heat waves increase, precipitation (rainfall) reduces land-surface and air-temperatures. Since in northern India (including Gujarat) heat waves occur during the pre- and early-monsoon (April to early June) period, the influence of heat waves on monsoon season land and air-temperatures may get attenuated or camouflaged by the effect of monsoon showers. However, it might happen that the intensity of effect of pre- and early-monsoon heat waves get reduced with time, but some effects on land-surface and air-temperatures persist even during the monsoon months. Thus, in order to determine relative influence of heat waves and rainfall on air-temperature during the monsoon season, multiple-regression was carried out involving mean maximum monsoon-temperature (TMON) as the dependent variable and number of HWD and monsoon-rainfall (PMON) as the predictor variables. To determine the influence of air-temperature on the thermal state and stress in vegetation, 500 pixels of the TCI were randomly chosen over agricultural crop and natural vegetation (forest and grassland). Estimates of the mean maximum temperature at these 500 locations were obtained by overlying these pixels over the interpolated surface of the mean maximum temperature. Strong positive association between temperature and TCI is obvious since BT from the thermal band and air-temperature is highly correlated, which was revealed by earlier study (Bhuiyan Citation2008). To establish the association between temperature and moisture-stress in vegetation, mean VCI values of the pixels were plotted in the descending order under different ranges of TMON. The relative cumulative percentage of pixels with the VCI equal to or greater than the stated value Pm was computed using the Weibull formula:
where m is the order number of a pixel and Nt is the total number of pixels under the range of temperature.
To keep sampling variation in the vertical direction, the VCI values were plotted on the ordinate and the relative percentage of pixels on the abscissa. The lines joining the points were used to assess relative influence of temperature on thermal condition in vegetation, as higher the curve/line higher is the VCI. Further, in order to determine the impact of moisture-stress and thermal stress on VH, the VCI and the TCI values were separately correlated year wise with the VHI values and their strength of association was measured using Pearson’s product–moment correlation coefficient (R).
Initially, 300 m resolution GlobCover (GLC30) (Citation2010) land-use/land-cover map () was co-registered with the 4-km resolution NOAA AVHRR-derived VCI-TCI-VHI maps of Gujarat. To match the spatial resolution, 300-m GlobCover map was degraded to 4-km resolution applying a majority filter-based pixel resampling technique. Further, original 22 land-cover classes in the database were grouped and recoded to 8 prominent land-cover classes including the forest, cultivated land and grassland. The database consists of eight land-cover classes with an overall accuracy of 83.51%.
Figure 3. Classified map of land-use/land-cover of Gujarat obtained from 30-m resolution GLC30 (Citation2010) images.
Since meteorological drought originates due to deficiency in precipitation, and since vegetative drought develops from meteorological drought, SPI was used for correlation and comparison with the VHI. However, since precipitation does not show normal distribution, the data must be normalized by fitting gamma probability density function into the actual data distribution (Guttman Citation1998, Citation1999). Computation of SPI involves normalization of precipitation data (to use the rules of normal statistics) and standardization of the normalized precipitation (for the calculation of precipitation departure), which is performed by subtracting the long-term mean from observed precipitation and dividing by the standard deviation (McKee, Doesken, and Kleist Citation1993; Edwards and McKee Citation1997), as shown in Equation (6).
where Pij is precipitation at the ith station/grid and jth observation; Pim is its long-term mean and σ is the standard deviation.
In this study, the district-wise gridded rainfall data were used for SPI computation. However, since monsoon season in India (including Gujarat) is of 4 months duration, the available algorithm and global products of the SPI for 1–3–6–9-12 months’ precipitation could not be used in this study. The SPI cannot be generalized for calculation where precipitation follows a different pattern. Therefore, the precipitation data was normalized by plotting them into the Easy-fit 5.5 Professional software of MathWave Technologies, and then the SPI was computed following Equation (6) and using long-term mean of 100 years of PMON. The SPI thus obtained reflects the precipitation anomaly exclusively of the monsoon season, and is referred as monsoonal SPI. The values of monsoonal SPI were interpolated in a GIS environment using Spline interpolator, and the interpolated surfaces were classified using the SPI scheme (McKee, Doesken, and Kleist Citation1993, Citation1995) for visual interpretation ().
Table 2. Various ranges of the SPI (McKee, Doesken, and Kleist Citation1993) depicting meteorological drought severity and corresponding color schemes (Bhuiyan et al. Citation2006) used in this study.
In order to understand the correspondence between VH and agricultural drought, the VHI values of pixels representing agricultural crop were grouped district wise, and average VHI values were computed to represent health of vegetation in various districts. District-wise average SPI values were correlated with the district-wise average VHI values to understand the strength of association between precipitation and VH. While a high value of correlation coefficient reveals a strong correspondence between rainfall and VH, a small R-value is indicative of weaker influence of rainfall on vegetative drought.
District-wise data of cultivated area and agricultural production (GOI Citation2014) are available since 1998 up to 2010. CY was computed by dividing agricultural production of “Kharif crops” by the cultivated area. District-wise average VHI values of crop pixels were compared with the CY (tonnes/hectare) for the years of vegetative drought and non-drought.
4. Results and discussion
In order to understand the impact of thermal stress on VH and agricultural drought, this study analyzed data of various climatic (heat waves), meteorological (temperature and rainfall) and vegetative (moisture condition, thermal condition and CY) parameters, and tried to establish their association and relationship. Results of various analyses have been discussed in the following sections.
4.1. Heat waves and their impact on air-temperature
Heat stress is a complex function of intensity, duration and the rate of the increase in temperature (Wahid et al. Citation2007). The severity of summer-droughts is highly dependent on the occurrence and the nature of heat waves (moderate or severe), since during the HWD the interaction between the land and atmosphere results in the gradual rise in temperature (Dg et al. Citation2014). However, the association of heat waves and air-temperature during the monsoon season is neither straightforward nor easy to determine as heat waves occur mostly during the pre-monsoon (April–May) and early-monsoon (early June) periods. Even if heat waves raise the air-temperature for several days, a short but intense spell of monsoon shower may attenuate the impact of heat wave. In spite of having several pre-monsoon HWD, frequent shower during the subsequent monsoon months keeps the land-surface- and air-temperature within the limit of the “normal”, and thus camouflage the positive association between heat waves and temperature. On the contrary, positive correlations between heat wave events and air-temperature occur when there are long gaps between consecutive rainy days. Result of the multiple-regression indicates a linear relationship among TMON, HWD and PMON. For five out of nine stations, TMON is found to bear a positive association with HWD, indicating a long-lasting effect of heat waves on air-temperature even after several months of the heat-wave events. Higher standardized partial regression coefficient (β), and tolerance value (t) of HWD than those of PMON for Ahmedabad, Bhavnagar, Kachchh, Porbandar and Rajkot districts () indicate weaker influence of rainfall and stronger influence of heat waves on monsoon-temperature at these places. Negative β-values of HWD found for Banas Kantha, Junagadh, Surat and Vadodara apparently indicate lack of influence of heat waves on temperature but are most likely due to the stronger influence of rainfall on temperature at these stations. An increased air-temperature due to heat waves raises the soil temperature and the increase is significantly high when accompanied by a deficiency in soil water content due to lack of rainfall or drought (Simoes-Araujo, Rumjanek, and Margis-Pinheiro Citation2003; Sekhon et al. Citation2010).
Table 3. Results of the multiple-regression depicting relative influence of number of heat-wave days (HWD) and monsoon rainfall (PMON) on average temperature during the monsoon season (TMON) at selected meteorological stations in Gujarat.
4.2. Air-temperature and the moisture condition in vegetation
In plants, moisture-stress is generally developed along with thermal stress but sometimes they develop in isolation and/or their respective intensity differs. Optimum moisture and temperature conditions in vegetation are maintained by rainfall and dew. However, aboveground air-temperature also plays a crucial role in maintaining the moisture and thermal equilibrium in plants. While optimum temperature range helps vegetation to maintain good vigor, anomalous high (and low) temperature affects the VH. Extremely high aboveground air-temperature, in particular, generates thermal stress in vegetation, lowers moisture content and thereby adversely affects VH. This was found that vegetative drought did not develop in Gujarat in all the years of low rainfall (meteorological drought). However, very high temperature occurred in 8 out of 9 years of vegetative drought in Gujarat (). This indirectly indicates definite influence of air-temperature on vegetative drought development.
Table 4. Meteorological drought-years, agricultural drought-years (a), and the years with above-normal temperature (ANT) in Gujarat (shown as Y).
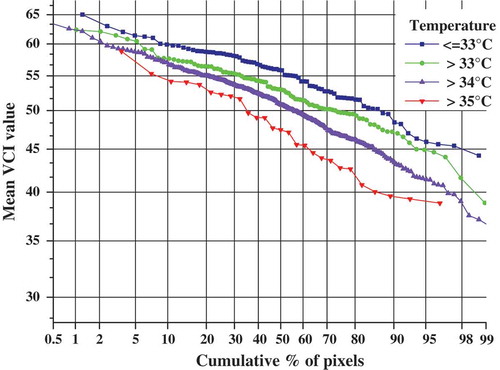
Again, when the mean monsoonal VCI under different temperature ranges was plotted, it has shown that probability of occurrence of moisture-stressed vegetation gradually increased with continuous rise of aboveground temperature (). In other words, cumulative percentage of pixels with comparatively higher values of VCI gradually and systematically decreased with the increase in temperature. Consistent variation of the VCI curves in different ranges of temperature indicates greater influence of the parameter (temperature). This demonstrates a strong influence of temperature not only on the thermal state but also on the moisture condition and moisture-stress development in vegetation. Influence of land-surface temperature and evapotranspiration on vegetation moisture content was observed and reported earlier (e.g. Gao et al. Citation2014). Even if high temperature does not have direct impact (thermal stress) on the vegetation and monsoon-crop, it indirectly affects VH since land-surface and air-temperature influence availability of soil moisture and transpiration of plants.
Figure 4. Frequency plot showing variation of the VCI values in the background of gradual variation of mean maximum aboveground air-temperature during the monsoon season.
4.3. Impact of thermal stress on VH and agricultural drought
Moisture and temperature conditions in vegetation correspond to each other, and therefore, moisture-stress and thermal stress in vegetation generally develops together. However, in certain seasons, favorable moisture and thermal conditions do not go hand in hand, owing to the difference in the dynamics and sudden changes in the climatic factors. In such cases, they counter each other, and the resultant of their combined influence is manifested in the VH. Commonly in such cases, sufficiency of moisture nullifies the effect of thermal stress and thereby either prevents or attenuates drought impacts on VH. The opposite phenomena may also occur when favorable thermal state in vegetation cancels or reduces the impact of moisture deficiency in vegetation.
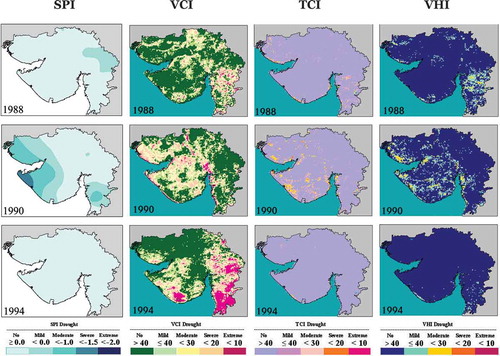
As in the case of Gujarat, the time series of the vegetation indices has shown that a good moisture condition (VCI >40) was accompanied by a favorable thermal condition (TCI >40), and vice versa in most of the monsoons during 1981–2010. This was mainly due to frequent rains during the monsoon, which not only supplies moisture to the soil and plants but also reduces land-surface and air-temperature (Bhuiyan Citation2008). In certain years, the timing, intensity and duration of heating up of the land-surface altered and the monsoon dynamics deviated from their normal course. Since rainfall is the principal supplier of moisture to plants, it is also the chief controller of VH. Therefore, in spite of thermal stress, vegetation could maintain good health (VHI >40) due to favorable moisture condition in the years of 1992, 1993, 1997 and 2009 owing to good monsoon rainfall. However, thermal condition is also crucial for VH and sometimes more influential than moisture condition. A favorable thermal state may attenuate the impact of moisture-stress and help vegetation to maintain health, as were the cases in the years 1988, 1990 and 1994 ().
Figure 5. Attenuation of the impact of moisture-stress by favorable thermal state in vegetation.
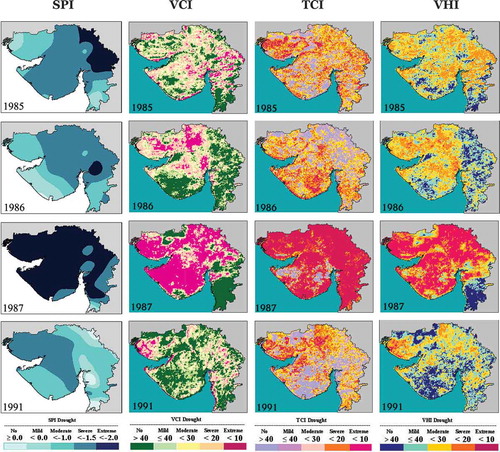
On the contrary, intense thermal stress often causes severe damage to VH (Gusso et al. Citation2014), and intensify vegetative drought if accompanied by moisture-stress. Influence of thermal stress on the initiation and intensification of agricultural drought in Gujarat is clearly reflected in the vegetation index maps of the consecutive years from 1985 to 1987 and also of 1991 ().
Figure 6. Drought intensification due to the impact of thermal stress in vegetation.
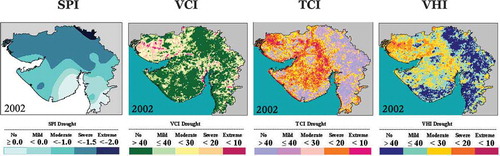
Without the presence of thermal stress, the extent of damage to VH and the intensity of droughts definitely would be much lower. Chances of severe deterioration of VH and development of vegetative drought only due to thermal stress are comparatively less if moisture condition in vegetation is favorable. Gujarat however witnessed such a drought in the year 2002, when in spite of favorable moisture condition in most parts of the state, drought developed mainly due to thermal stress (). Therefore, it is evident that while optimum thermal condition supports plant growth, severe thermal stress damages VH and leads to vegetative and agricultural droughts.
Figure 7. Degradation of vegetation health and development of vegetative drought mainly due to thermal stress.
No one-to-one correlation could be found when SPI, the most widely used drought index was correlated year wise with the VHI. Except in 1985, 1987 and 1990, correlation in other years was not significant. Between the monsoonal SPI and the VHI, the highest R-value (0.76) was found in the year 1985, while the lowest correlation (R = 0.01) was observed in the years 1995 and 2004 (). Absence of a strong correspondence between precipitation and VH was noticed also when the VCI–TCI–VHI maps were compared visually with the interpolated surfaces of the monsoonal SPI. While patterns of the monsoonal SPI matched well with the VHI in certain years (e.g. 1985, 1987, 1988, 1990 and 1994), mismatches in some other years (e.g. 1986, 1991 and 2002) are noticeable (–). Earlier studies (Bhuiyan Citation2004; Bhuiyan, Singh, and Kogan Citation2006) too pointed out that a deficient rainfall as per the SPI does not always correspond to hydrological or vegetative droughts. Contrarily, in spite of normal precipitation (SPI >0.0), drought may appear in the hydro and vegetative spheres. Several factors may be responsible for this mismatch. While in arid and semiarid regions such as Gujarat, rainfall has large temporal variation due to erratic monsoon dynamics, and vegetative drought results either by sudden development of abnormally high stresses, or by gradual accumulation of mild stresses (moisture-stress and/or thermal stress). “Memory effect” (Schwinning et al. Citation2004; Martiny, Richard, and Camberlin Citation2005; Philippon et al. Citation2005) and “recovery effect” (Malo and Nicholson Citation1990; Martiny, Richard, and Camberlin Citation2005) are also responsible for this mismatch. While “memory effect” of past surplus precipitation helps vegetation to maintain health and vigor during low rainfall events, “recovery effect” is responsible for delayed recovery of VH after a severe drought in spite of adequate precipitation (Bhuiyan and Kogan Citation2010). Other possible reasons are irrigation-dependent agriculture, and changing of crops with different crop-water requirement. Agricultural practices, particularly timing of sowing and harvesting, have a significant bearing in shaping the NDVI (and hence VHI) patterns (Doi Citation2001). However, the main reason for low correlation between the monsoonal SPI and VHI could be the effect of temperature not only on thermal state in vegetation but also on its moisture condition as already observed (). This is because evapotranspiration is directly governed by temperature.
Table 5. Correlation of the SPI, VCI and TCI with the VHI in the years of vegetative drought and non-drought in Gujarat during 1981–2010.
Thus, in order to detect relative contribution or influence of moisture-stress and thermal stress on vegetation, the VHI values were correlated year wise with the VCI and TCI values of the pixels. Both the VCI and the TCI have been found to be positively correlated with the VHI; however, their degree of association varies across the years. Although, for 25 out of 30 years in the VCI has shown stronger association with the VHI, the coefficient of determination (R) between the TCI and VHI is also significant (). In fact, for the drought years 1982 and 1991 as well as in the non-drought years of 1983, 1992 and 1999, VHI had stronger association with the TCI than with the VCI. Even in the drought years of 1985, 1995 and 2002, correlation between the TCI and VHI is significantly high and comparable with that between the VCI and VHI. Except 1982 and 1983, Gujarat experienced high air-temperature in the years 1985, 1991, 1992, 1995, 1999 and 2002 imparting thermal stress on vegetation, and this is most likely the reason for such high correlation between the TCI and VHI. A higher association between the VCI and the VHI is quite obvious since moisture plays the lead role in the maintenance of VH; however, the high correlation between the TCI and VHI both for the drought years and non-drought years indicates the importance of thermal condition for VH and the impact of thermal stress on vegetative drought.
The impact of thermal stress on agricultural droughts in Gujarat is further revealed by the district-wise CY and the VHI values for the vegetative drought and non-drought years during 1998 and 2010. Comparison of CY and VHI values clearly indicates that low CY (tonnes/hectare) in the drought years of 2000, 2002 and 2009 than those in the non-drought years were attributed to damaged VH. Besides, strong and statistically significant correlations could be noticed between district-wise average VHI values (of the pixels corresponding to the cropland) and district-wise CY values (GOI Citation2014) both for drought and non-drought years (). This suggests a fair correspondence between VH and CY. In comparison to non-drought years, higher correlation coefficient in the drought years of 2000, 2002 and 2009 ((,)) is again an indication of direct influence of aboveground temperature on agricultural droughts as high temperature affected VH and CY more intensely in the drought years. Earlier studies also pointed out that combined impact of heat-stress and drought on plant growth is stronger than their individual effect (Mittler Citation2006; Balla et al. Citation2011; Dreesen et al. Citation2012; Lipiec et al. Citation2013; Rollins et al. Citation2013), as heat wave and drought lead to a decrease in photosynthetic activity (Crafts-Brander and Salvucci Citation2002; Zhou et al. Citation2007; Ashraf and Harris Citation2013). On the other hand, agricultural practices (sowing, harvesting, crop types, cropping patterns, etc.) vary from year to year since commencement and termination of the monsoon, rainfall amount, spatial variation and average gap between 2 consecutive rainy days vary from one year to another. These factors affect the moisture condition and thermal condition in vegetation, and thus the VHI. Therefore, the correlation between CY and average VHI of the cropland pixels gets attenuated for the non-drought years.
Figure 8. Scatter-plot showing variation of VHI against crop yield (CY) in Gujarat during 2001–2010: (a) in the drought years; (b) in the non-drought years.
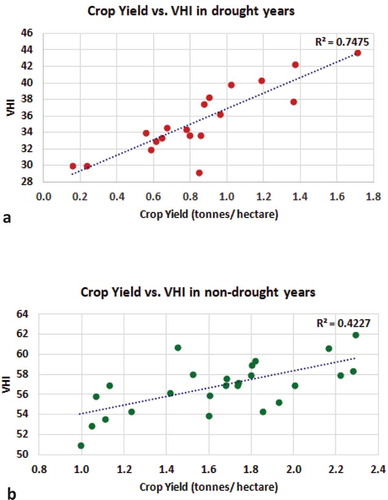
Moreover, during these years (1998–2010), favorable thermal state (TCI >40) was the main reason for good VH (VHI >40) in most of the non-drought years, and thermal stress (TCI <40) was one of the main causes of poor VH (VHI <40) in the drought years of 2000, 2002 and 2009 as is revealed by the strong correlation between the TCI and the VHI (). Therefore, the strong association between the VHI and the CY also establishes the impact of thermal stress on agricultural droughts.
This study has tried to reveal a chain of events from occurrence of heat waves to development of agricultural drought. It has shown that heat-wave events raise land-surface and air-temperature, which imparts moisture-stress and thermal stress in vegetation causing damage to VH and resulting vegetative and agricultural droughts, which is ultimately manifested into low CY. Therefore, this study has established once again that although precipitation is the chief architect of drought, all the blames cannot be put on deficient rainfall alone as the role of temperature is crucial, especially for vegetative drought, both in positive and negative sense. Therefore, monitoring, assessing and forecasting of droughts solely on the basis of precipitation or the SPI will be a gamble. In Gujarat, the dynamics of vegetative (and agricultural) drought did not always follow the spatiotemporal patterns of rainfall as is evident from the results of this study. The occurrence of strong correspondence between CY and VHI may be explored further and the VH indices may be employed for concurrent estimation of crop production.
5. Conclusions
Conventionally, meteorological drought severity is assessed using the SPI that estimates precipitation deficiency with respect to the “normal”. One of the main reasons behind the weak correlation between meteorological and vegetative/agricultural droughts is that the SPI is not equipped to assess the impact of temperature on VH. Results of data analysis have shown that in Gujarat state of India, vegetative/agricultural droughts appeared entirely or partially only in 9 out of 15 meteorological drought years in the last three decades of 1981–2010. Out of these 9 years of vegetative drought, thermal stress was acute and widespread in 8 years as was revealed by the TCI values. Thermal stress in vegetation develops due to aboveground air-temperature, and the latter has an association with the number of HWD during or prior to the monsoon season. Without the development of thermal stress, damage to the VH could have been low or even negligible, and agricultural droughts could be averted. Since agricultural production has a direct correspondence with the VH, and since the latter is strongly influenced by the thermal state in vegetation, low crop productivity is directly or indirectly associated with the thermal stress developed in the crops. Thus, a sequence and link among drought-causative and responsive parameters (heat waves – temperature extremes – thermal stress in vegetation – damaged VH – vegetative/agricultural drought – low CY) has been revealed through this study. On the basis of the findings of this study, it is being recommended that for a better correspondence between meteorological and agricultural droughts, other important factors such as average gap between 2 consecutive rainy days and the mean maximum temperature should be considered and incorporated in the agro-meteorological drought index formulation and drought severity assessment.
Acknowledgments
The authors express their sincere thanks to Dr Jinyoung Rhee, the Guest Editor, and to the anonymous reviewers for their constructive criticism and valuable suggestions for the improvement of the article.
Disclosure statement
No potential conflict of interest was reported by the authors.
References
- ACD (2012) Annual Report 2011–12, the Agriculture and Cooperation Department, Government of Gujarat. http://agricoop.nic.in/imagedefault/ARE2012.pdf. Accessed on 02.August.2014
- Alexander, L. V., X. Zhang, T. C. Peterson, J. Caesar, B. Gleason, A. M. G. Klein Tank, M. Haylock, et al. 2006. “Global Observed Changes in Daily Climate Extremes of Temperature and Precipitation.” Journal of Geophysical Researche-Atmospheres 111: 05109. doi:10.1029/2005JD006290.
- Ashraf, M., and P. J. C. Harris. 2013. “Photosynthesis under Stressful Environments: An Overview.” Photosynthetica 51 (2): 163–190. doi:10.1007/s11099-013-0021-6.
- Balla, K., M. Rakszegi, G. LiZ, F. Bekes, S. Bencze, and O. Veisz. 2011. “Quality of Winter Wheat in Relation to Heat and Drought Shock after Anthesis.” Czech Journal of Food Sciences 29: 117–128.
- Bandyopadhyay, N., C. Bhuiyan, and A. K. Saha. 2016. “Heat Waves, Temperature Extremes and Their Impacts on Monsoon-Rainfall and Meteorological Droughts in Gujarat, India.” Natural Hazards. doi:10.1007/s11069-016-2205-4.
- Bandyopadhyay, N., C. Bhuiyan, and A. K. Saha. 2015. “Temperature Extremes, Moisture Deficiency and Their Impacts on Dryland Agriculture in Gujarat, India.” In Drought: Research and Science-Policy Interfacing, edited by J. Andreu, A. Solera, J. Paredes-Arquiola, D. Haro-Monteagudo, H. van Lanen. London: CRS Press.
- Barriopedro, D., E. M. Fischer, J. Luterbacher, R. M. Trigo, and R. Garcı´a-Herrera. 2011. “The Hot Summer of 2010: Redrawing the Temperature Record Map of Europe.” Science 332: 220–224. doi:10.1126/science.1201224.
- Bhuiyan, C. (2004). Various Drought Indices for Monitoring Drought Condition in Aravalli Terrain of India. In: Proceedings of the XXth ISPRS Conference. International Society for Photogrammetry and Remote Sensing., Istanbul.
- Bhuiyan, C. (2008). Desert Vegetation during Droughts: Response and Sensitivity. In: Proceedings of the XXIth ISPRS Congress, International Society for Photogrammetry and Remote Sensing, Beijing, July 2008.
- Bhuiyan, C., and F. N. Kogan. 2010. “Monsoon Variation and Vegetative Drought Patterns in the Luni Basin under Rain-Shadow Zone.” International Journal of Remote Sensing 31 (12): 3223–3242. doi:10.1080/01431160903159332.
- Bhuiyan, C., R. P. Singh, and F. N. Kogan. 2006. “Monitoring Drought Dynamics in the Aravalli Terrain (India) Using Different Indices Based on Ground and Remote Sensing Data.” International Journal of Applied Earth Observation and Geoinformation 8: 289–303. doi:10.1016/j.jag.2006.03.002.
- Bokusheva, R., F. Kogan, I. Vitkovskaya, S. Conradt, and M. Batyrbayeva. 2016. “Satellite-Based Vegetation Health Indices as a Criteria for Insuring against Drought-Related Yield Losses.” Agricultural and Forest Meteorology 220: 200–206. doi:10.1016/j.agrformet.2015.12.066.
- Ciais, P., M. Reichstein, N. Viovy, A. Granier, J. Ogée, V. Allard, M. Aubinet, et al. 2005. “Europe-Wide Reduction in Primary Productivity Caused by the Heat and Drought in 2003.” Nature 437: 529–533. doi:10.1038/nature03972.
- Crafts-Brander, C., and M. E. Salvucci. 2002. “Sensitivity to Photosynthesis in the C4 Plant Maize to Heat Stress.” Plant Cell 12: 54–68.
- Dai, A., K. E. Trenberth, and T. Qian. 2004. “A Global Data Set of Palmer Drought Severity Index for 1870–2002: Relationship with Soil Moisture and Effects of Surface Warming.” Journal of Hydrometeorology 5: 1117–1130. doi:10.1175/JHM-386.1.
- Denmead, O. T., and R. H. Shaw. 1961. “Availability of Soil Water to Plants as Affected by Soil Moisture Content and Meteorological Conditions.” Agronomy Journal 54 (5): 385–390. doi:10.2134/agronj1962.00021962005400050005x.
- Deryng, D., D. Conway, N. Ramankutty, J. Price, and R. Warren. 2014. “Global Crop Yield Response To Extreme Heat Stress Under Multiple Climate Change Futures.” Environmental Research Letters 9, 034011: 1–13. doi:10.1088/1748-9326/9/3/034011.
- Dg, M., T. Aj, C. C. Van-Heerwaarden, and J. V. G. De-Arellano. 2014. “Mega-Heatwave Temperatures Due to Combined Soil Desiccation and Atmospheric Heat Accumulation.” Nature Geoscience 7: 345–349. doi:10.1038/ngeo2141.
- Doi, R. D. 2001. “Vegetational Response of Rainfall in Rajasthan Using AVHRR Imagery.” Journal of the Indian Society of Remote Sensing 29: 213–224. doi:10.1007/BF02995726.
- Donat, M. G., L. V. Alexander, H. Yang, I. Durre, R. Vose, and J. Caesar. 2013. “Global Land-Based Datasets for Monitoring Climatic Extremes.” Bulletin of the American Meteorological Society 94: 997–1006. doi:10.1175/BAMS-D-12-00109.1.
- Dreesen, P. E., H. J. De Boeck, I. A. Janssens, and I. Nijs. 2012. “Summer Heat and Drought Extremes Trigger Unexpected Changes in Productivity of a Temperate Annual/Biannual Plant Community.” Environmental and Experimental Botany 79: 21–30. doi:10.1016/j.envexpbot.2012.01.005.
- Edwards, D. C., and T. B. McKee. 1997. “Characteristics of 20th Century Drought in the United States at Multiple Time Scales.” Climatology Report Number 97 (2): 1–155. Colorado State University, Fort Collins, CO.
- Gao, Z., Q. Wang, X. Cao, and W. Gao. 2014. “The Responses of Vegetation Water Content (EWT) and Assessment of Drought Monitoring along a Coastal Region Using Remote Sensing.” GIScience & Remote Sensing 51: 1–16. doi:10.1080/15481603.2014.882564.
- Gibbs, W. J., and J. V. Maher (1967). Rainfall Deciles as Drought Indicators. Bureau of Meteorology Bull. 48. Commonwealth of Australia, Melbourne, Australia.
- GLC30 (2010). http://www.globallandcover.com ( Accessed on 28.April.2016)
- Government of India (GOI) (2014). District-Wise, Season-Wise Crop Production Statistics from 1998. https://data.gov.in/catalog/district-wise-season-wise-crop-productionstatistics#web_catalog_tabs_block_10 (Accessed on: 26.September.2014)
- Gusso, A., J. R. Ducati, M. R. Veronez, V. Sommer, and L. G. Da Silveira Jr. 2014. “Monitoring Heat Waves and Their Impacts on Summer Crop Development in Southern Brazil.” Agricultural Sciences 5: 353–364. doi:10.4236/as.2014.54037.
- Guttman, N. B. 1998. “Comparing the Palmer Drought Index and the Standardized Precipitation Index.” Journal of the American Water Resources Association 34 (1): 113–121. doi:10.1111/j.1752-1688.1998.tb05964.x.
- Guttman, N. B. 1999. “Accepting the Standardized Precipitation Index: A Calculation Algorithm.” Journal of the American Water Resources Association 35 (2): 311–322. doi:10.1111/j.1752-1688.1999.tb03592.x.
- Hansen, J., M. Sato, and R. Ruedy (2012). Perception of Climate Change. Proceedings of the National Academy of Sciences USA. http://www.pnas.org/cgi/doi/10.1073/pnas.1205276109. Accessed on 20.April.2014
- Hasanuzzaman, M, K Nahar, Md Alam, R Roychowdhury, and M Fujita. 2013. “Physiological, Biochemical, And Molecular Mechanisms Of Heat Stress Tolerance In Plants.” International Journal of Molecular Sciences 14 (5): 9643–9684. doi:10.3390/ijms14059643.
- IMD (2015). http://www.imdpune.gov.in/weather_forecasting/glossary.pdf. Accessed on 21.December.2015
- Kim, D., and J. Rhee (2016). A Drought Index from Actual Evapotranspiration Based on the Bouchet Hypothesis. Geophysical Research Letters 43, 10277–10285.
- Kogan, F., A. Powell, and O. Fedorov, eds.. 2011. Use of Satellite and In-Situ Data to Improve Sustainability, 362. Dordrecht: Springer.
- Kogan, F., L. Salazar, and L. Roytman. 2012. “Forecasting Crop Production Using Satellite Based Vegetation Health Indices in Kansas, United States.” International Journal of Remote Sensing 3: 2798–2814. doi:10.1080/01431161.2011.621464.
- Kogan, F. N. 1990. “Remote Sensing of Weather Impacts on Vegetation in Non-Homogeneous Areas.” International Journal of Remote Sensing 11 (8): 1405–1419. doi:10.1080/01431169008955102.
- Kogan, F. N. 1995. “Application of Vegetation Index and Brightness Temperature for Drought Detection.” Advances in Space Research 15 (11): 91–100. doi:10.1016/0273-1177(95)00079-T.
- Kogan, F. N. 2001. “Operational Space Technology for Global Vegetation Assessment.” Bulletin of American Meteorological Society 82 (9): 1949–1964. doi:10.1175/1520-0477(2001)082<1949:OSTFGV>2.3.CO;2.
- Kogan, F. N. 2002. “Global Droughts in the New Millennium from AVHRR-Based Vegetation Health Indices.” Eos Transactions American Geophysical Union 83 (48): 562–563. doi:10.1029/2002EO000382.
- Kogan, F. N., A. Gitelson, Z. Edige, I. Spivak, and L. Lebed. 2003. “AVHRR-Based Spectral Vegetation Index for Quantitative Assessment of Vegetation State and Productivity: Calibration and Validation.” Photogrammetric Engineering & Remote Sensing 69 (8): 899–906. doi:10.14358/PERS.69.8.899.
- Kogan, F., Z. Povova, P. Alexandrova. 2016. “Early forecasting corn yield using field experiment datasets and vegetation health indices in Pleven region, North Bulgaria.” Ekologia i Industria 9(1): 76–80.
- Lipiec, J., C. Doussan, A. Nosalewicz, and K. Kondracka. 2013. “Effect of Drought and Heat Stresses on Plant Growth and Yield: A Review.” International Agrophysics 27: 463–477. doi:10.2478/intag-2013-0017.
- Lobell, D. B., and C. B. Field. 2007. “Global Scale Climate–Crop Yield Relationships and the Impacts of Recent Warming.” Environmental Research Letters 2 (1). doi:10.1088/1748-9326/2/1/014002.
- Malo, A. P., and S. E. Nicholson. 1990. “A Study of Rainfall and Vegetation Dynamics in the African Sahel Using NDVI.” Journal of Arid Environment 19: 1–24.
- Marcovitch, S. 1930. “The Measure of Droughtiness.” Monthly Weather Review 58: 113. doi:10.1175/1520-0493(1930)58<113:TMOD>2.0.CO;2.
- Martiny, N., Y. Richard, and P. Camberlin. 2005. “Interannual Persistence Effects in Vegetation Dynamics of Semi-Arid Africa.” Geophysical Research Letters 32: L24403. doi:10.1029/2005GL024634.
- McKee, T. B., N. J. Doesken, and J. Kleist (1993). The Relation of Drought Frequency and Duration to Time Scales. Proceedings of the Eighth Conference on Applied Climatology, American Meteorological Society. Boston, 179–184.
- McKee, T. B., N. J. Doesken, and J. Kleist (1995). Drought Monitoring with Multiple Time Scales. In: Proceedings of the Ninth Conference on Applied Climatology, American Meteorological Society. Boston, 233–236.
- Meehl, G. A., and C. Tebaldi. 2004. “More Intense, More Frequent, and Longer Lasting Heat Waves in the 21st Century.” Science 305: 994–997. doi:10.1126/science.1098704.
- Mittler, R. 2006. “Abiotic Stress, the Field Environment and Stress Combination.” Trends in Plant Science 11: 15–19. doi:10.1016/j.tplants.2005.11.002.
- Narasimhan, B., and R. Srinivasan. 2005. “Development and Evaluation of Soil Moisture Deficit Index (SMDI) and Evapotranspiration Deficit Index (ETDI) for Agricultural Drought Monitoring.” Agricultural and Forest Meteorology 133: 69–88. doi:10.1016/j.agrformet.2005.07.012.
- Palmer, W. C. (1965). Meteorological Droughts. U.S. Department of Commerce Weather Bureau Research Paper 45, 58 pp.
- Palmer, W. C. 1968. “Keeping Track of Crop Moisture Conditions, Nationwide: The New Crop Moisture Index.” Weatherwise 21: 156–161. doi:10.1080/00431672.1968.9932814.
- Park, S., J. Im, E. Jang, and J. Rhee. 2016. “Drought Assessment and Monitoring through Blending of Multi-Sensor Indices Using Machine Learning Approaches for Different Climate Regions.” Agriculture and Forest Meteorology 216: 157–169. doi:10.1016/j.agrformet.2015.10.011.
- Philippon, N., E. Mougin, L. Jarlan, and P. L. Frison. 2005. “Analysis of the Linkages between Rainfall and Land Surface Conditions in the West African Monsoon through CAMP, ERS-WSC, and NOAA-AVHRR Data.” Journal of Geophysical Research 110. doi:10.1029/2005JD006394.
- Planning Commission Report (2007). http://planningcommission.nic.in/reports/sereport/ser/stdy_droght.pdf. Accessed on 4.May.2015
- Pollard, D., and S. L. Thompson. 1995. “Use of a Land-Surface-Transfer Scheme (LSX) in a Global Climate Model: The Response to Doubling Stomatal Resistance.” Global and Planetary Change 10 (1–4): 129–161. doi:10.1016/0921-8181(94)00023-7.
- Porter, J. R., and M. A. Semenov. 2005. “Crop Responses to Climatic Variation.” Philosophical Transactions of the Royal Society B. doi:10.1098/rstb.2005.1752.
- Rhee, J., S. Park, and Z. Lu. 2014. “Relationship between Land Cover Patterns and Surface Temperature in Urban Areas.” GIScience & Remote Sensing 51: 521–536. doi:10.1080/15481603.2014.964455.
- Rojas, O., A. Vrieling, and F. Rembold. 2011. “Assessing Drought Probability for Agricultural Areas in Africa with Coarse Resolution Remote Sensing Imagery.” Remote Sensing of Environment 115 (2): 343–352. doi:10.1016/j.rse.2010.09.006.
- Rollins, J. A., E. Habte, S. E. Templer, T. Colby, J. Schmidt, and M. Von Korff. 2013. “Leaf Proteome Alterations in the Context of Physiological and Morphological Responses to Drought and Heat Stress in Barley (Hordeum vulgare L.).” The Journal of Experimental Botany 64 (11): 3201–3212. doi:10.1093/jxb/ert158.
- Rouse, J. W., R. H. Haas, J. A. Scheel, and D. W. Deering (1974). Monitoring Vegetation Systems in the Great Plains with ERTS. Proceedings, 3rd Earth Resource Technology Satellite (ERTS) Symposium, vol. 1, 48–62.
- Schär, C., P. L. Vidale, D. Lüthi, C. Frei, C. Häberli, M. A. Liniger, and C. Appenzeller. 2004. “The Role of Increasing Temperature Variability in European Summer Heatwaves.” Nature 427: 332–336. doi:10.1038/nature02300.
- Schlenker, W., and M. Roberts (2009). Nonlinear Temperature Effects Indicate Severe Damages to US Crop Yields under Climate Change. Proceedings of the National Academy of Sciences, 106, 15594–15598. doi:10.1073/pnas.0906865106
- Schwinning, S., O. E. Sala, M. E. Loik, and J. R. Ehleringer. 2004. “Thresholds, Memory, and Seasonality: Understanding Pulse Dynamics in Arid/Semi-Arid Ecosystems.” Oecologia 141: 191–193. doi:10.1007/s00442-004-1683-3.
- Sekhon, H. S., G. Singh, P. Sharma, and T. S. Bains. 2010. “Water Use Efficiency under Stress Environments.” In Climate Change and Management of Cool Season Grain Legume Crops, eds. S. S. Yadav, D. L. M. Neil, R. Redden, and S. A. Patil. Springer Press, Dordrecht-Heidelberg-London-New York.
- Seneviratne, S. I., N. Nicholls, D. Easterling, C. M. Goodess, S. Kanae, J. Kossin, Y. Luo, et al. 2012. “Changes in Climate Extremes and Their Impacts on the Natural Physical Environment.” In Managing the Risks of Extreme Events and Disasters to Advance Climate Change Adaptation, eds. C. B. Field, V. Barros, T. F. Stocker, D. Qin, D. J. Dokken, K. L. Ebi, M. D. Mastrandrea, et al., 109–230. Cambridge, UK, and New York, NY, USA: A Special Report of Working Groups I and II of the Intergovernmental Panel on Climate Change (IPCC). Cambridge University Press.
- Simoes-Araujo, J. L., N. G. Rumjanek, and M. Margis-Pinheiro. 2003. “Small Heat Shock Proteins Genes are Differentially Expressed in Distinct Varieties of Common Bean.” The Brazilian Journal of Plant Physiology 15: 33–41. doi:10.1590/S1677-04202003000100005.
- Skakun, S., N. Kussul, A. Shelestov, and O. Kussul. 2015. “The Use of Satellite Data for Agriculture Drought Risk Quantification in Ukraine.” Geomatics, Natural Hazards and Risk 7 (3): 901–917. doi:10.1080/19475705.2015.1016555.
- Swain, S., B. D. Wardlow, S. Narumalani, T. Tadesse, and K. Callahan. 2011. “Assessment of Vegetation Response to Drought in Nebraska Using Terra-MODIS Land Surface Temperature and Normalized Difference Vegetation Index.” GIScience & Remote Sensing 48: 432–455. doi:10.2747/1548-1603.48.3.432.
- Teuling, A. J., A. F. Van Loon, S. I. Seneviratne, I. Lehner, M. Aubinet, B. Heinesch, C. Bernhofer, T. Gru¨Nwald, H. Prasse, and U. Spank. 2013. “Evapotranspiration Amplifies European Summer Drought.” Geophysical Research Letters 40 (10): 2071–2075. doi:10.1002/grl.50495.
- Unganai, L. S., and F. N. Kogan. 1998. “Drought Monitoring and Corn Yield Estimation in Southern Africa from AVHRR Data.” Remote Sensing of Environment 63: 219–232. doi:10.1016/S0034-4257(97)00132-6.
- Van Rooy, M. P. 1965. “A Rainfall Anomaly Index Independent of Time and Space.” Notos 14: 43.
- Vicente-Serrano, S. M., S. Beguria, and J. Lopez-Moreno. 2010. “A Multiscalar Drought Index Sensitive to Global Warming: The Standardized Precipitation Evapotranspiration Index.” Journal of Climate 23: 1696–1718. doi:10.1175/2009JCLI2909.1.
- Wahid, A., S. Gelani, M. Ashraf, and M. R. Foolad. 2007. “Heat Tolerance in Plants: An Overview.” Environmental and Experimental Botany 61: 199–223. doi:10.1016/j.envexpbot.2007.05.011.
- Wheeler, T. R., P. Q. Craufurd, R. H. Ellis, J. R. Porter, and P. V. V. Prasad. 2000. “Temperature Variability and the Yield of Annual Crops.” Agriculture Ecosystems and Environment 82: 159–167. doi:10.1016/S0167-8809(00)00224-3.
- Yagchi, A. L., D. Liping, and D. Meixia. 2015. “The Effect of Corn–Soybean Rotation on the NDVI-Based Drought Indicators: A Case Study in Iowa, USA, Using Vegetation Condition Index.” GIScience & Remote Sensing 52: 290–314. doi:10.1080/15481603.2015.1038427.
- Zhou, J., X. Wang, Y. Jiao, Y. Qin, X. Liu, K. He, C. Chen, L. Ma, J. Wang, and Xiong. 2007. “Global Genome Expression Analysis of Rice in Response to Drought and High-Salinity Stresses in Shoot, Flag Leaf, and Panicle.” Plant Molecular Biology 63: 591–608. doi:10.1007/s11103-006-9111-1.