
 ?Mathematical formulae have been encoded as MathML and are displayed in this HTML version using MathJax in order to improve their display. Uncheck the box to turn MathJax off. This feature requires Javascript. Click on a formula to zoom.
Abstract
Net primary production (NPP) is a crucial feature of ecosystem function and structure. Furthermore, precipitation use efficiency (PUE) is a critical indicator for exploring NPP in grassland ecosystem responses to variations in precipitation and temperature. In this study, we examined the spatial patterns of NPP and PUE in China’s grasslands from 2000 to 2010 and explored the effects of environmental factors on NPP and PUE at different scales. The results showed first that the spatial distribution of NPP and PUE decreased from the northeast to southwest. NPP increased in most places across China’s grasslands; however, there was no obvious change in PUE during 2000–2010. Second, in most regions across China’s grasslands, positive and negative correlations existed between precipitation and NPP and PUE, respectively. The spatial distribution of the relationship between temperature and NPP and PUE was consistent with the relationship between precipitation with NPP and PUE. Finally, for the gradients of the various environmental factors in different regional grassland ecosystems, on the Tibetan Plateau, there were unimodal correlations between precipitation with NPP and PUE and aridity with NPP and PUE, but a positive linear correlation existed for temperature with NPP and PUE. However, in the Inner Mongolian Plateau, there were positive correlations between precipitation and NPP, temperature and NPP, and aridity and both NPP and PUE and negative correlations between precipitations and PUE and temperature and PUE. Our findings improve understanding of grassland ecosystem responses to global climate change and provide a basis for the protection of grassland ecosystems in arid and semi-arid regions.
1. Introduction
Terrestrial ecosystems constitute major sinks in the global carbon cycle (Thanyapraneedkul et al. Citation2012). Their net primary production (NPP) represents the main energy input into terrestrial ecosystems (Yahdjian and Sala Citation2006; Zhu and Southworth Citation2013) and quantifies the amount of atmospheric carbon fixed by plants and accumulated as biomass (Zhao and Running Citation2010), which is a critical environmental factor in global climate change and terrestrial ecosystems. More importantly, precipitation and temperature regimes have become more extreme on global, regional, and local scales due to global climate change (Zhang et al. Citation2013; Yuan, Wang, and Mitchell Citation2014; Ding et al. Citation2015; Qiu et al. Citation2016). The changes in precipitation have substantially impacted the structure and functioning of terrestrial ecosystems (Fay et al. Citation2011; Fry et al. Citation2013). Large-scale regional studies have elucidated the effects of precipitation and temperature on aboveground net primary production (ANPP) or aboveground biomass in terrestrial ecosystems, especially in grasslands (Sun, Cheng, and Li Citation2013; Yang et al. Citation2008; Fang et al. Citation2001) because water availability and temperature are the primary limiting factors for plant growth and community composition in the grassland ecosystem (Huxman et al. Citation2004; Sun, Cheng, and Li Citation2013). Thus, understanding how ANPP of grassland ecosystems responds to precipitation and temperature is essential in assessing the impacts of global change on terrestrial ecosystems.
Precipitation use efficiency (PUE), the ratio of NPP to precipitation, is regarded as an effective index by which to interpret the relationships between ANPP and precipitation (Hu et al. Citation2007a; Bai et al. Citation2008). Most importantly, the changes of PUE across environmental gradients (e.g., precipitation and temperature) also serve as powerful indicators for grassland ecosystem management. The spatial variations of ANPP and PUE with precipitation have thus been explored in temperate grassland (Bai et al. Citation2008), alpine grassland (Yang et al. Citation2010), loess plateau (Jia et al. Citation2015), the China Grassland Transect (the Mongolian Plateau in northern China and the Tibetan Plateau) (Hu et al. Citation2010), global grasslands (Yang et al. Citation2008), and terrestrial ecosystems (Huxman et al. Citation2004). The general finding is that NPP quickly increases with precipitation at lower precipitation ranges until a threshold, after which NPP decreases drastically (Chapin, Matson, and Vitousek Citation2011). PUE was low at both the dry and wet ends and peaked at a threshold of an intermediate precipitation level (Yang et al. Citation2010).
In addition to precipitation, some other biotic and abiotic factors may affect PUE through their influences on NPP (Huxman et al. Citation2004; Ruppert et al. Citation2012). Previous studies have explored the relationship of PUE species diversity (Knapp et al. Citation2002; Yang et al. Citation2010), soil moisture content (Jia et al. Citation2015), soil silt content (Yang et al. Citation2010) vegetation cover, and the leaf area index (Hu et al. Citation2010; Liu et al. Citation2015). However, few studies have examined the relationship of spatial variations in PUE with temperature and the aridity index (AI, the ratio of precipitation to temperature) across China’s grassland ecosystems. To gain a complete understanding of the mechanism underlying variations in PUE, the relationship of PUE with temperature and the AI across environmental gradients must be explored (Liu et al. Citation2011; Andrew et al. Citation2015).
Consequently, we investigated the spatial-temporal patterns of NPP and PUE and explored the relationships of NPP and PUE to temperature and precipitation at the regional scale. Most importantly, we analyzed the similarities and differences of variations in NPP and PUE with typical environmental gradients (precipitation, temperature, the AI, and altitude) in different grassland ecosystems from 2000 to 2010.
2. Methods
2.1. Study area
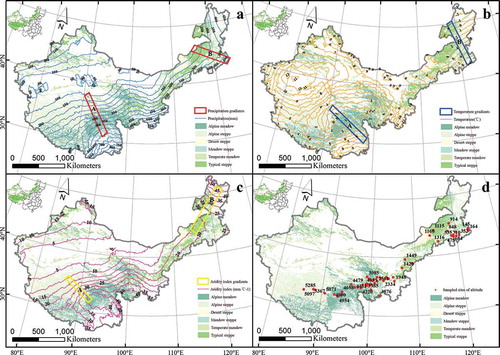
The study area was a 3.13 × 10⁶ km2 grassland in China, which covers 79.7% of China’s natural grassland area, and 32.6% of the land area of China. It is located in the western part of the Greater Khingan Mountains, Helan Mountain, and Western Sichuan Mountains, and includes Inner Mongolia, Gansu, Ningxia, Xinjiang, Qinghai, and Tibetan provinces (Wu et al. Citation2009). The area follows the distribution of temperate meadow, meadow steppe, typical steppe, desert steppe, alpine meadow, and alpine steppe from east to the west according to topography, climate, soil, and other natural factors (). The region varies in elevation from 0 m in the east to 8000 m in the west. Based on meteorological data (2000–2010), the annual temperature for the study period ranges from −3.89°C to 13.09°C, and the annual precipitation ranges from 31.46 to 898.04 mm.
Figure 1. The study area across China’s grasslands. The grassland contained alpine meadow, alpine steppe, desert steppe, meadow steppe, temperate meadow, and typical steppe.
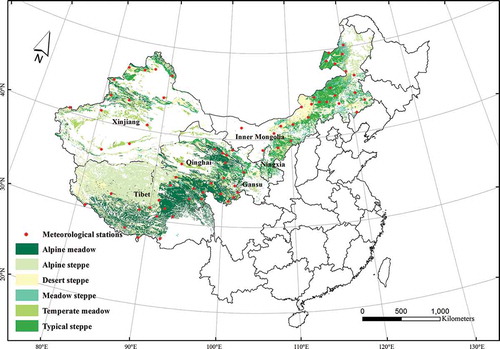
A meadow steppe has maximum biodiversity and is dominated by Leymus chinensis, Stipa grandis, Filifolium sibiricum, and Stipa baicalensis. A typical steppe has moderate biodiversity, with the dominant species Caragana microphylla, Agropyron cristatum, S. krylovii, Cleistogenes squarrosa, Artemisia frigida, L. chinensis, and S. grandis. A desert steppe has the least biodiversity and is dominated by Cleistogenes songorica, Agropyron desertorum, A. frigida, Salsola collina, Stipa gobica, and Stipa klemenzii (Guo et al. Citation2012). An alpine steppe is controlled by cold-xerophytic grasses, such as Carex moorcroftii and Stipa purpurea, mixed with alpine forbs, while alpine meadow is controlled by perennial grasses, including K. humilis, Kobresia pygmaea, and K. tibetica (Yang et al. Citation2010).
2.2. Data sources
Estimates of the regional-scale NPP were based on the NASA Moderate Resolution Imaging Spectroradiometer (MODIS) MOD17 NPP products, which are the first regular, near-real-time data sets for repeated monitoring of vegetation primary production on vegetated land at 1-km resolution at an 8-day interval (Zhao et al. Citation2005) and are useful for natural resource and land management, global carbon cycle analysis, ecosystem status assessment, and environmental change monitoring (see http://modis.gsfc.nasa.gov/data/dataprod/mod17.php).
Precipitation and temperature measurements were collected from 70 meteorological stations around China’s grasslands per the catalog of the China Meteorological Administration. The kriging method – a method of interpolation for which the interpolated values are modeled by a Gaussian process governed by prior covariance (Cressie Citation1990) – was used to interpolate the meteorological data at a 1 km × 1 km resolution to create sequential data surfaces for precipitation and temperature factors. Before interpolation, we modeled a semivariogram. When modeling the semivariogram, the autocorrelation can be examined and quantified. In geostatistics, this is called spatial modeling, also known as structural analysis or variography. In spatial modeling of the semivariogram, you begin with a graph of the empirical semivariogram, computed as,
for all pairs of locations separated by distance h. The formula involves calculating half the difference squared between the values of the paired locations. To plot all pairs quickly becomes unmanageable. Instead of plotting each pair, the pairs are grouped into lag bins. Using ordinary kriging, the principle of which is as follows: the unknown value Z(x0) is interpreted as a random variable located in x0, as well as the values of neighbor samples Z(xi), i = 1, …, N. The estimator is also interpreted as a random variable located in x0, a result of the linear combination of variables. To deduce the kriging system for the assumptions of the model, the following committed error while estimating Z(x) in x0 is declared:
The two quality criteria referred to previously can now be expressed in terms of the mean and variance of the new random variable . Then, the interpolated data were re-sampled in ArcGIS (v. 10.1) to obtain specific precipitation and temperature factors for every sampling site and pixel.
The Digital Elevation Model was with approximately 900 m × 900 m resolution based on the global multi-resolution terrain elevation 2010 (GMTED2010) from the United States Geological Survey and the National Geospatial-Intelligence Agency.
PUE is the ratio of NPP to annual mean precipitation (Lehouerou Citation1984), and the PUE data were calculated using the NPP data and the annual mean precipitation (MAP) data. Aridity data were calculated using the MAP and the annual mean temperature (Martonne Citation1927):
where AI is the aridity index, P is the annual mean precipitation, and t° is the annual mean temperature.
We chose the typical environmental gradients along the direction of environmental factors change, using Fishnet tools in ArcGIS (v. 10.1), based on the contour line of precipitation, temperature, and the AI. The isoheight of the Qinghai-Tibet Plateau is very dense because of a large topographic relief, so we chose the gradients of elevation along the elevation direction, using artificial selection.
2.3. Statistical analysis
We calculated NPP and PUE for each sampling site using the NPP and PUE data from 2000 to 2010 and the raster calculation function in ArcGIS. We also calculated the spatial change rate of NPP and PUE and the spatial correlation between NPP and precipitation, NPP and temperature, PUE and precipitation, and PUE and temperature based on a least squares analysis (Sun, Cheng, and Li Citation2013):
β and r indicate the rate of change and the correlation index, respectively; n is the number of years in the study period; X is the year, from 2000 to 2010; Y is the NPP or the PUE that corresponds to X; xi is the precipitation or temperature; and yi is the NPP or the PUE. Finally, we used regression analysis (SPSS, v. 19.0) to test the correlations among the NPP or the PUE and environmental factors (precipitation, temperature, the AI, and altitude) in different grassland ecosystems (Tibetan and Inner Mongolian plateaus’ grassland ecosystems).
3. Results
3.1. Spatial distribution and dynamics of NPP and PUE in China’s grasslands
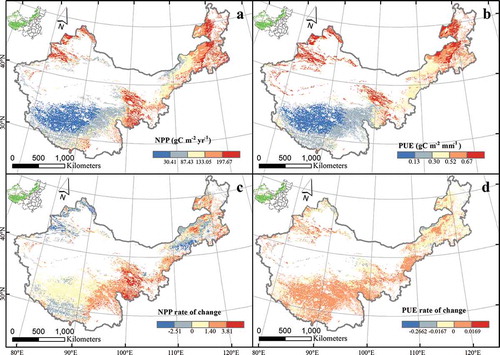
The variation trend of NPP and PUE were almost consistent in the spatial pattern during the study period in China’s grasslands and decreased from northeast to southwest ( and ). The areas with the largest values were in northeast Inner Mongolia and northwest Xinjiang and consisted of temperate meadow and meadow steppe. The NPP value was more than 197.69 g C m−2 yr−1, and PUE was more than 0.67 g C m−2 mm−1. The areas with the lowest values were in the northern and middle parts of Tibet, which were covered with alpine steppe. The NPP value there was less than 30.41 g C m−2 yr−1, and PUE was more than 0.13 g C m−2 mm−1. The highest NPP and PUE values were observed in temperate meadow, followed by meadow steppe, typical steppe, desert steppe, alpine meadow, and alpine steppe. The NPP change rate was positive in most places across China’s grasslands, except northeast Inner Mongolia, northwest Xinjiang, and southwest Tibet, and the change rate of PUE ranged from −0.0167 to 0.0169 in most places throughout the study area ( and ).
Figure 2. Spatial patterns and dynamics of NPP and PUE across China’s grasslands. Graphs a and b represent distributions NPP and PUE, respectively, Graphs c and d represent NPP and PUE, respectively.
3.2. Responses of NPP and PUE to precipitation and temperature across China’s grasslands
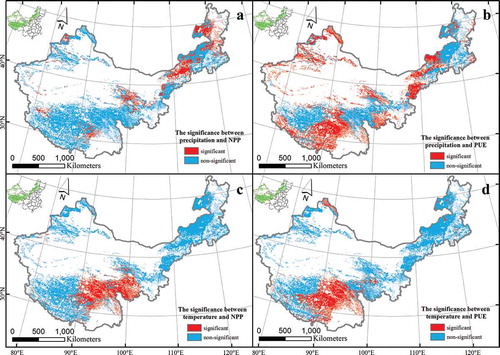
The spatial correlations and significance between NPP and precipitation, NPP and temperature, PUE and precipitation, and PUE and temperature are shown in and . There was a positive correlation between NPP and precipitation in most places throughout the study area, with a strong positive correlation primarily in northeast Inner Mongolia. However, negative correlations were distributed in the middle of Tibet. There were far more nonsignificant than significant correlations, and the latter were distributed primarily in northeast Inner Mongolia ( and ). There was a negative correlation between the PUE and precipitation in most places throughout the study area, with positive correlations scattered only across northeast Inner Mongolia, northwest Tibet, and southern Qinghai. The area of significant correlations was distributed primarily in mid-eastern Inner Mongolia, northwest Xinjiang, and the middle of Tibet ( and ). The spatial distribution of the correlations and the significance between temperature and NPP and PUE were consistent. Positive correlations were found in most places across the study area, negative correlations were distributed only in the northeast of Inner Mongolia, and significant correlations were distributed primarily in mid-eastern Tibet (, , , and ). Furthermore, the response of NPP to precipitation, PUE to temperature and NPP to temperature existed differences between grassland ecosystems of the Tibetan and Inner Mongolian plateau.
Figure 3. Responses of NPP and PUE to variation of precipitation and temperature across China’s grasslands. Graphs a and b represent variations NPP and PUE with precipitation, respectively. Graphs c and d represent NPP and PUE with temperature, respectively.
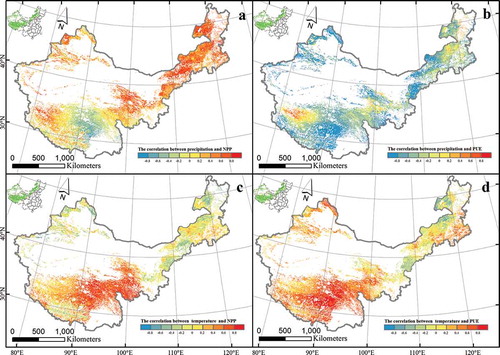
Figure 4. The significance of NPP and PUE with precipitation and temperature across China’s grasslands. Graphs a and b represent variations NPP and PUE with precipitation, respectively. Graphs c and d represent variation NPP and PUE with temperature, respectively.
3.3. Comparison of NPP and PUE in temperate grasslands with those in alpine grasslands under environmental gradients
We constructed gradient transects of environmental factors (precipitation, temperature, AI, and altitude) on the Tibetan and Inner Mongolian plateaus to explore the responses of NPP and PUE to changing environmental conditions and to compare variations in NPP and PUE of different grassland ecosystems ().
Figure 5. Environment gradients of precipitation, temperature, aridity index and altitude across China’s grasslands. Graphs a, b, c, and d represent the gradients of precipitation, temperature, aridity index, and altitude, respectively. Gradients A and B are located inTibet Plateau and Inner Mongolian Plateau, respectively.
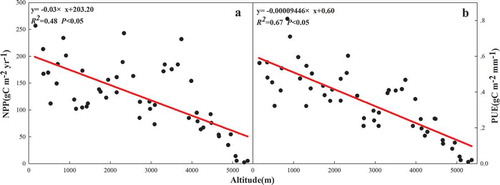
On the Tibetan Plateau, a unimodal correlation existed in precipitation with NPP (R2 = 0.55, p < 0.05) and PUE (R2 = 0.50, p < 0.05) ( and ), but positive and negative correlations existed in precipitation with NPP (R2 = 0.62, p < 0.05) and PUE (R2 = 0.13, p < 0.05), respectively, on the Inner Mongolian Plateau ( and ). There were positive linear correlations between temperature and NPP on the Tibetan Plateau and the Inner Mongolian Plateau, but the effect of temperature on NPP on the Tibetan Plateau was greater than that on the Inner Mongolian Plateau ( and ). However, positive and negative correlations existed between temperature and PUE on the Tibetan Plateau (R2 = 0.57, p < 0.05) and the Inner Mongolian Plateau (R2 = 0.26, p < 0.05) ( and ), respectively. The relationships of aridity with NPP and PUE were the same as the relationships of precipitation with NPP and PUE on the Tibetan Plateau ( and ), but the responses of NPP and PUE to aridity were more sensitive than precipitation. Strong and weak positive correlations existed in aridity with NPP (R2 = 0.75, p < 0.05) and the PUE (R2 = 0.10, p < 0.05) on the Inner Mongolian Plateau ( and ), respectively. A negative linear correlation existed between altitude and NPP (R2 = 0.48, p < 0.05), as well as between altitude and PUE (R2 = 0.67, p < 0.05) in 54 sites ().
Figure 6. Relationships of precipitation with NPP and PUE. Graphs a1, a2, b1, and b2 represent the relationship between precipitation with NPP and PUE in Tibet Plateau and Inner Mongolian Plateau, respectively.
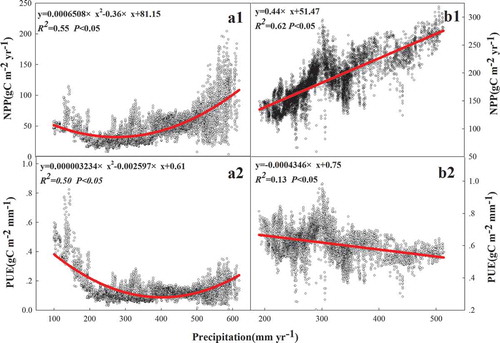
Figure 7. Relationships of temperature with NPP and PUE. Graphs a1, a2, b1, and b2 represent the relationship between temperature with NPP and PUE in Tibet Plateau and Inner Mongolian Plateau, respectively.
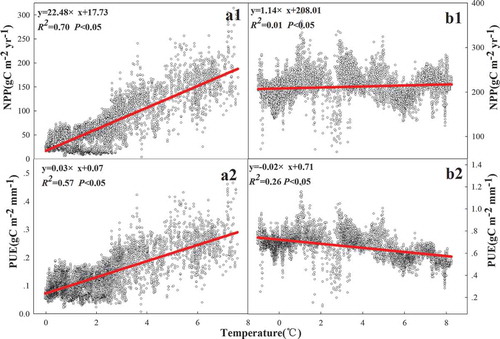
Figure 8. Relationships of aridity index with NPP and PUE. Graphs a1, a2, b1, and b2 represent the relationship between aridity index with NPP and PUE in Tibet Plateau and Inner Mongolian Plateau, respectively.
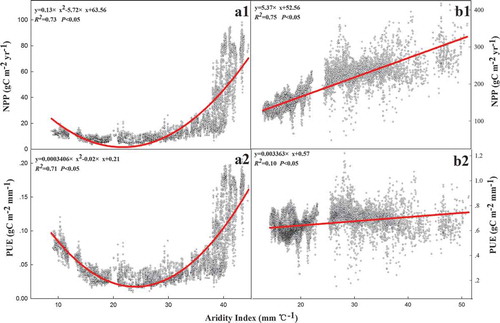
Figure 9. Relationships of altitude with NPP and PUE. Graphs a and b represent the relationship between altitude with NPP and PUE in altitude gradient, respectively.
4. Discussion
4.1. Spatial distribution and changes in the NPP and the PUE
The NPP spatial pattern was consistent with the results from simulations conducted with the Carnegie-Ames-Stanford Approach (Chen et al. Citation2011). Precipitation in most parts of China’s grasslands is less than 500 mm, which is characteristic of arid and semiarid areas. Precipitation is often considered the most important factor in NPP and PUE (Noymeir Citation1973), and a positive correlation between precipitation and NPP has been verified in many regions around the world (Le, Bingham, and Skerbek Citation1988; Briggs and Knapp Citation1995; Paruelo et al. Citation1999; O’Connor, Haines, and Snyman Citation2001; Fan et al. Citation2009). Therefore, our finding that NPP and PUE decreased from northeast to southwest was consistent with the direction of moisture transfer. In different grassland ecosystems, the highest values of NPP and PUE have been observed in temperate meadows, followed by meadow steppes, typical steppes, desert steppes, alpine meadows, and alpine steppes (Figures S1 and S2). This result is because meadow steppes have the maximum species richness, followed by typical steppes, desert steppes (Guo et al. Citation2012; Feng, Li, and Li Citation2008), and alpine meadows, which have more species richness than alpine steppes (Yang et al. Citation2010). Furthermore, relevant studies have indicated that a positive correlation exists between species richness and NPP (PUE), especially at larger scales (Tilman et al. Citation2001; Hooper et al. Citation2005). There are two reasons why higher species richness may yield greater NPP and PUE: first, more species may mean more efficient use of precipitation because of niche complementarity, and second, higher species richness may also indicate that ecosystems can include more functional groups that react to higher precipitation (Yang et al. Citation2010).
The NPP rate of change was positive, that NPP increased in most parts of China’s grasslands from 2000 to 2010 (), and related studies have also predicted that NPP will increase in the twenty-first century (Ji, Mei, and Li Citation2008; Tao and Zhang Citation2010). Most scholars believe that the main factor driving this change in NPP is precipitation, but temperature could play a supporting role (Cao et al. Citation2003; Piao Citation2001). Both mean precipitation and temperature increased in China’s grasslands from 2000 to 2010 (Figure S3), and this increased precipitation improved the soil water supply, enhanced the photosynthetic rate, and increased the NPP. At the same time, the increased temperature extended the plant growth cycle, and thus, increased NPP as well (Mu et al. Citation2013).
Although NPP increased in most parts of China’s grasslands, NPP in northeast Inner Mongolia, northwest Xinjiang, and southwest Tibet decreased because of grassland degeneration from overgrazing (Lehouerou Citation1984). The rate of change in PUE during the study period was not obvious, ranging from −0.0167 to 0.0169 in most parts of China’s grasslands () because PUE is the ratio of NPP to precipitation, and NPP and precipitation increased simultaneously.
4.2. Control mechanisms of NPP and PUE at the regional and transect scales
Previous studies have reported a positive correlation between precipitation and NPP (Hu et al. Citation2007a; Sala et al. Citation1988; Ma et al. Citation2008), especially in semiarid and arid ecosystems, where precipitation is vital (Bai et al. Citation2008; Ning, Yang, and Cheng Citation2012). The increased precipitation improved the soil water supply and enhanced the photosynthetic rate (Mu et al. Citation2013), so the positive correlation between precipitation and NPP existed in most of China’s grasslands () as well as on the Inner Mongolian Plateau (). However, unimodal correlations between precipitation and NPP existed on the Tibetan Plateau (), because there was high altitude, and some studies have shown that temperature replaces precipitation as the most important factor affecting NPP and PUE at high altitude regions (Han et al. Citation2013).
At the regional scale, our study demonstrated a negative correlation between precipitation and the PUE in China’s grasslands except in the middle of Tibet (). This result differs from that in other studies (Hu et al. Citation2010). When the water fixation capacity of soils is limited, surface runoff and nonavailable water increase (Vermeire, Heitschmidt, and Rinella Citation2015; Mu et al. Citation2014); this may be the primary reason for the negative correlation we found between precipitation and PUE. There were unimodal and negative correlations between precipitation and PUE on the Tibetan Plateau and the Inner Mongolian Plateau ( and ), respectively, and those patterns have all been reported in previous studies of grassland ecosystems (Lauenroth, Burke, and Paruelo Citation2000; Paruelo et al. Citation1999). The results indicated that the PUE might be affected by several factors other than precipitation and temperature, including edaphic condition, vegetation composition, and biogeochemical constraints (Paruelo et al. Citation1999; Lauenroth and Sala Citation1992; Huxman et al. Citation2004; Lehouerou Citation1984). In addition, the negative correlation between precipitation and PUE existed on the Tibetan Plateau when precipitation was less than 400 mm (), which may have resulted from the inhibiting effects of excessive precipitation and low temperatures on plant photosynthesis in summer (Li, Liu, and Zhang Citation2015).
The increased temperature extended the growth season of plants and increased the amount of dry-matter accumulation (Chen et al. Citation2011), so there was a positive correlation between temperature and NPP on the Tibetan and Inner Mongolian plateaus ( and ). However, the influence of temperature on NPP on the Tibetan Plateau was greater than its influence on the Inner Mongolian Plateau. As noted above, low temperature is the most important factor in limiting plant growth at high altitudes (Yang et al. Citation2009). Therefore, the effect of air temperature on NPP was more obvious as altitude increased. Positive and negative linear correlations existed in temperature and PUE on the Tibetan and Inner Mongolian plateaus ( and ), respectively. Given that plant growth requires a large amount of water, the positive correlation between temperature and PUE on the Tibetan Plateau () may have resulted from the extension of the plant growing season due to the increased temperature on the Tibetan Plateau (Mu et al. Citation2014). Regarding the negative correlation between temperature and PUE in Inner Mongolian Plateau (), temperature had a significant effect on PUE through its effects on evapotranspiration rates (Vermeire, Heitschmidt, and Rinella Citation2015), which increase with temperature and cause the PUE to decrease.
Previous studies have noted that NPP and PUE tend to decrease spatially with increasing potential evapotranspiration and aridity (Lehouerou Citation1984; Cheng et al. Citation2012) because of low production potential, low plant density, high tolerance to water stress, and evaporation potential in dry regions (Paruelo et al. Citation1999; Hu et al. Citation2010; Noymeir Citation1973). Our study results also generally were not consistent with those arguments. On the Tibetan and Inner Mongolian plateaus, NPP and PUE increased with the AI in two gradients where the index was more than 25 mm °C−1 (). The primary reason for this is that the plants’ photosynthetic and conservative water-use strategies in dry regions are used primarily to combat water stress and maintain growth (Guo et al. Citation2012; Paruelo et al. Citation1999; Jobbágy and Sala Citation1993).
Our finding of a significant, negative linear correlation between altitude and NPP and PUE () differed from that in related studies in the National Natural Reserve of the Huihe wetland (Chang et al. Citation2015). This difference can be attributed to the spatial scales of the studies, in that our study area was larger than the Huihe wetland. Previous studies have shown that, at a smaller spatial scale, altitude influences NPP and PUE primarily through the water thermal gradient, vegetation community characteristics, and distribution (Hegazy, El-Demerdash, and Hosni Citation1998; Wang et al. Citation2010; Hara et al. Citation1996). However, in our study, altitude exerted an influence on the NPP and PUE primarily through vegetation cover and aboveground biomass (Cantón et al. Citation2004; Cui et al. Citation2011). Generally, aboveground biomass and biodiversity decrease as altitude increases (Bai and Chen Citation2000; Wang and Shi Citation2004), and as mentioned above, there is a positive correlation between species richness and NPP (PUE). Furthermore, factors that affect plant growth adversely (e.g., heavy winds, short growing season, low temperature, and strong solar radiation) increase with increased altitude (Hu et al. Citation2010); therefore, both NPP and PUE decreased with increased altitude across China’s grasslands.
5. Conclusion
The results have two important implications for understanding the responses of the dynamics of NPP and PUE to precipitation and temperature. At the regional scale, we found decreasing trends of NPP and PUE from northeast to southwest were affected by moisture. At the environmental gradients, the influence of temperature on NPP and PUE was more significant than that of precipitation in high altitude regions, because low temperature is the most important factor in limiting plant growth there. In addition, our results highlight that further studies are needed to consider comprehensive factors (such as climatic factors, soil factors, and community structure) to clarify the intrinsic mechanisms of PUE.
Disclosure statement
No potential conflict of interest was reported by the authors.
Supplemental data
Supplemental data for this article can be accessed here.
Additional information
Funding
References
- Andrew, M. E., M. A. Wulder, T. A. Nelson, and N. C. Coops. 2015. “Spatial Data, Analysis Approaches, and Information Needs for Spatial Ecosystem Service Assessments: A Review.” GIScience & Remote Sensing 52 (3): 344–373. doi:10.1080/15481603.2015.1033809.
- Bai, Y., and Z. Z. Chen. 2000. “Changes in Plant Species Diversity and Productivity along Gradients of Precipitation and Elevation in the Xilin River Basin, Inner Mongolia.” Acta Phytoecologica Sinica 24 (6): 667–673. doi:10.3321/j.issn:1005-264X.2000.06.005.
- Bai, Y. F., J. G. Wu, Q. Xing, Q. M. Pan, J. H. Huang, D. L. Yang, and X. G. Han. 2008. “Primary Production and Rain Use Efficiency across a Precipitation Gradient on the Mongolia Plateau.” Ecology 89 (8): 2140–2153. doi:10.1890/07-0992.1.
- Briggs, J. M., and A. K. Knapp. 1995. “Interannual Variability in Primary Production in Tallgrass Prairie: Climate, Soil Moisture, Topographic Position, and Fire as Determinants of Aboveground Biomass.” American Journal of Botany 82 (8): 1024–1030. doi:10.2307/2446232.
- Cantón, Y., G. D. Barrio, A. Solé-Benet, and R. Lázaro. 2004. “Topographic Controls on the Spatial Distribution of Ground Cover in the Tabernas Badlands of SE Spain.” Catena 55 (3): 341–365. doi:10.1016/S0341-8162(03)00108-5.
- Cao, M. K., B. Tao, K. R. Li, X. M. Shao, and D. Stephen. 2003. “Interannual Variation in Terrestrial Ecosystem Carbon Fluxes in China from 1981 to 1998.” Acta Botanica Sinica 45 (5): 552–560.
- Chang, X. L., S. H. Lu, Z. Y. Feng, and S. X. Ye. 2015. “Impact of Topography on the Spatial Distribution Pattern of Net Primary Productivity in a Meadow.” 35 (10): 3339–3348. doi:10.5846/stxb201306201748.
- Chapin, F. S., P. A. Matson, and P. M. Vitousek. 2011. Principles of Terrestrial Ecosystem Ecology. New York: Springer. doi:10.1007/978-1-4419-9504-9.
- Chen, F. J., Y. J. Shen, L. I. Qian, Y. Guo, and L. M. Xu. 2011. “Spatio-Temporal Variation Analysis of Ecological Systems NPP in China in past 30 Years.” Scientia Geographica Sinica 31 (11): 1409–1414. doi:10.13249/j.cnki.sgs.2011.11.015.
- Cheng, M., R. H. Wang, H. X. Xue, and L. I. Qi. 2012. “Effects of Drought on Ecosystem Net Primary Production in Northwestern China.” Journal of Arid Land Resources & Environment 98 (8): 1–7. doi:10.13448/j.cnki.jalre.2012.06.026.
- Cressie, N. 1990. “The Origins of Kriging.” Mathematical Geosciences 22 (3): 239–252. doi:10.1007/BF00889887.
- Cui, D., Y. L. Li, Y. W. Xin, Y. Z. Xue, and T. H. Zhang. 2011. “Spatial Distribution of Aboveground Biomass of Grassland in Desert and Desertified Regions in Northern China.” Journal of Desert Research 31 (4): 868–872.
- Ding, M. J., Q. Chen, L. H. Li, Y. L. Zhang, Z. F. Wang, L. S. Liu, and X. M. Sun. 2015. “Temperature Dependence of Variations in the End of the Growing Season from 1982 to 2012 on the Qinghai–Tibetan Plateau.” GIscience & Remote Sensing 53 (2): 147–163. doi:10.1080/15481603.2015.1120371.
- Fan, J. W., K. Wang, W. Harris, H. P. Zhong, Z. M. Hu, B. Han, W. Y. Zhang, and J. B. Wang. 2009. “Allocation of Vegetation Biomass across a Climate-Related Gradient in the Grasslands of Inner Mongolia.” Journal of Arid Environments 73 (3): 105–110. doi:10.1016/j.jaridenv.2008.12.004.
- Fang, J. Y., S. L. Piao, Z. Y. Tang, C. H. Peng, and J. Wei. 2001. “Interannual Variability in Net Primary Production and Precipitation.” Science 293 (5536): U1–U2. doi:10.1126/science.293.5536.1723a.
- Fay, P. A., J. M. Blair, M. D. Smith, J. B. Nippert, J. D. Carlisle, and A. K. Knapp. 2011. “Relative Effects of Precipitation Variability and Warming on Tallgrass Prairie Ecosystem Function.” Biogeosciences 8 (10): 3053–3068. doi:10.5194/bg-8-3053-2011.
- Feng, H. E., X. L. Li, and Q. W. Li. 2008. “Research Progress in Relationship between Rainfall and Grassland Primary Productivity.” Chinese Journal of Grassland 30 (2): 109–115.
- Fry, E. L., P. Manning, D. G. P. Allen, A. Hurst, G. Everwand, M. Rimmler, and S. A. Power. 2013. “Plant Functional Group Composition Modifies the Effects of Precipitation Change on Grassland Ecosystem Function.” PLoS One 8 (2): 1–14. doi:10.1371/journal.pone.0057027.
- Guo, Q., Z. M. Hu, S. G. Li, X. R. Li, X. M. Sun, and G. R. Yu. 2012. “Spatial Variations in Aboveground Net Primary Productivity along a Climate Gradient in Eurasian Temperate Grassland: Effects of Mean Annual Precipitation and Its Seasonal Distribution.” Global Change Biology 18 (12): 3624–3631. doi:10.1111/Gcb.12010.
- Han, Q. F., G. P. Luo, C. F. Li, H. Ye, and Y. L. Chen. 2013. “Modeling Grassland Net Primary Productivity and Water-Use Efficiency along an Elevational Gradient of the Northern Tianshan Mountains.” Journal of Arid Land 5 (3): 354–365. doi:10.1007/s40333-013-0182-y.
- Hara, M., K. Hirata, M. Fujihara, and K. Oono. 1996. “Vegetation Structure in Relation to Micro-Landform in an Evergreen Broad-Leaved Forest on Amami Ohshima Island, South-West Japan.” Ecological Research 11 (3): 325–337. doi:10.1007/BF02347790.
- Hegazy, A. K., M. A. El-Demerdash, and H. A. Hosni. 1998. “Vegetation, Species Diversity and Floristic Relations along an Altitudinal Gradient in South-West Saudi Arabia.” Journal of Arid Environments 38 (1): 3–13. doi:10.1006/jare.1997.0311.
- Hooper, D. U., F. S. Chapin, J. J. Ewel, A. Hector, P. Inchausti, S. Lavorel, J. H. Lawton, D. M. Lodge, M. Loreau, and S. Naeem. 2005. “Effects of Biodiversity on Ecosystem Functioning: A Consensus of Current Knowledge.” Ecological Monographs 75 (1): 3–35. doi:10.1890/04-0922.
- Hu, Z. M., G. R. Yu, J. W. Fan, H. P. Zhong, S. Q. Wang, and S. G. Li. 2010. “Precipitation-Use Efficiency along a 4500-Km Grassland Transect.” Global Ecology and Biogeography 19 (6): 842–851. doi:10.1111/j.1466-8238.2010.00564.x.
- Hu, Z. M., J. W. Fan, H. P. Zhong, and G. R. Yu. 2007a. “Spatiotemporal Dynamics of Aboveground Primary Productivity along a Precipitation Gradient in Chinese Temperate Grassland.” Science in China Series D-Earth Sciences 50 (5): 754–764. doi:10.1007/s11430-007-0010-3.
- Huxman, T. E., M. D. Smith, P. A. Fay, A. K. Knapp, M. R. Shaw, M. E. Loik, S. D. Smith, D. T. Tissue, J. C. Zak, and J. F. Weltzin. 2004. “Convergence across Biomes to a Common Rain-Use Efficiency.” Nature 429 (6992): 651–654. doi:10.1038/nature02561.
- Ji, J. J., H. Mei, and K. R. Li. 2008. “Prediction of Carbon Exchanges between China Terrestrial Ecosystem and Atmosphere in 21st Century.” Science in China 51 (6): 885–898. doi:10.1007/s11430-008-0039-y.
- Jia, X. X., B. N. Xie, M. Shao, and C. L. Zhao. 2015. “Primary Productivity and Precipitation-Use Efficiency in Temperate Grassland in the Loess Plateau of China.” PLoS One 10 (8): 1–14. doi:10.1371/journal.pone.0135490.
- Jobbágy, E. G., and O. E. Sala. 1993. Controls of Grass and Shrub Aboveground Production in the Patagonian Steppe. Kluwer Academic Publishers. doi:10.1890/1051-0761(2000)010[0541:COGASA].
- Knapp, A. K., P. A. Fay, J. M. Blair, S. L. Collins, M. D. Smith, J. D. Carlisle, C. W. Harper, B. T. Danner, M. S. Lett, and J. K. McCarron. 2002. “Rainfall Variability, Carbon Cycling, and Plant Species Diversity in a Mesic Grassland.” Science 298 (5601): 2202–2205. doi:10.1126/science.1076347.
- Lauenroth, W. K., I. C. Burke, and J. M. Paruelo. 2000. “Patterns of Production and Precipitation-Use Efficiency of Winter Wheat and Native Grasslands in the Central Great Plains of the United States.” Ecosystems 3 (4): 344–351. doi:10.1007/s100210000031.
- Lauenroth, W. K., and O. E. Sala. 1992. “Long‐Term Forage Production of North American Shortgrass Steppe.” Ecological Applications 2 (4): 397–403. doi:10.2307/1941874.
- Le, H. H., R. L. Bingham, and W. Skerbek. 1988. “Relationship between the Variability of Primary Production and the Variability of Annual Precipitation in World Arid Lands.” Journal of Arid Environments 15: 1–18.
- Lehouerou, H. N. 1984. “Rain-Use Efficiency: A Unifying Concept in Arid-Land Ecology.” Journal of Arid Environments 7 (3): 213–247.
- Li, C. N., Q. R. Liu, and L. J. Zhang. 2015. “The Spatiotemporal Characteristics of NDVI, Precipitation and RUE during 2000-2012 in Xinjiang”. Pratacultural Science 32 (11): 1740–1747. doi:10.11829/j.issn.1001-0629.2015-0355.
- Liu, S. L., X. K. Su, S. K. Dong, F. Y. Cheng, H. D. Zhao, X. Y. Wu, X. Zhang, and J. R. Li. 2015. “Modeling Aboveground Biomass of an Alpine Desert Grassland with SPOT-VGT NDVI.” GIscience & Remote Sensing 52 (6): 1–20. doi:10.1080/15481603.2015.1080143.
- Liu, Y., X. F. Wang, M. Guo, H. S. Tani, N. Matsuoka, and S. J. Matsumura. 2011. “Spatial and Temporal Relationships among NDVI, Climate Factors, and Land Cover Changes in Northeast Asia from 1982 to 2009.” GIScience & Remote Sensing 48 (3): 371–393. doi:10.2747/1548-1603.48.3.371.
- Ma, W. H., Y. H. Yang, J. S. He, H. Zeng, and J. Y. Fang. 2008. “Above- and Belowground Biomass in Relation to Environmental Factors in Temperate Grasslands, Inner Mongolia.” Science in China 51 (3): 263–270. doi:10.1007/s11427-008-0029-5.
- Martonne, E. D. 1927. “Regions of Interior-Basin Drainage.” Geographical Review 17 (3): 397–414. doi:10.2307/208323.
- Mu, S. J., J. L. Li, W. Zhou, H. F. Yang, and C. B. Zhang. 2013. “Spatial-Temporal Distribution of Net Primary Productivity and Its Relationship with Climate Factors in Inner Mongolia from 2001 to 2010.” Acta Ecologica Sinica 33 (12): 3752–3764. doi:10.5846/stxb201205030638.
- Mu, S. J., K. X. Zhou, Q. I. Yang, Y. Z. Chen, Y. Fang, and C. Zhu. 2014. “Spatio-Temporal Patterns of Precipitation-Use Efficiency of Vegetation and Their Controlling Factors in Inner Mongolia.” Chinese Journal of Plant Ecology 38 (1): 1–16. doi:10.3724/SP.J.1258.2014.00001.
- Ning, B. Y., X. M. Yang, and L. Cheng. 2012. “Changes of Temperature and Precipitation Extremes in Hengduan Mountains, Qinghai-Tibet Plateau in 1961-2008.” Chinese Geographical Science 22 (4): 422–436. doi:10.1007/s11769-012-0549-6.
- Noymeir, I. 1973. “Desert Ecosystems: Environment and Producers.” Annual Review of Ecology & Systematics 4 (1): 25–51. doi:10.1146/annurev.es.04.110173.000325.
- O’Connor, T. G., L. M. Haines, and H. A. Snyman. 2001. “Influence of Precipitation and Species Composition on Phytomass of a Semi-Arid African Grassland.” Journal of Ecology 89 (89): 850–860. doi:10.1046/j.0022-0477.2001.00605.x.
- Paruelo, J. M., W. K. Lauenroth, I. C. Burke, and O. E. Sala. 1999. “Grassland Precipitation-Use Efficiency Varies across a Resource Gradient.” Ecosystems 2 (1): 64–68. doi:10.1007/s100219900058.
- Piao, S. L. 2001. “Terrestrial Net Primary Production and Its Spatio-Temporal Patterns in China during 1982–1999.” Acta Scicentiarum Naturalum Universitis Pekinesis 37: 563–569. doi:10.13209/j.0479-8023.2001.102.
- Qiu, B. W., Z. Z. Wang, Z. H. Tang, Z. Liu, F. D. Lu, C. C. Chen, and N. Chen. 2016. “A Multi-Scale Spatiotemporal Modeling Approach to Explore Vegetation Dynamics Patterns under Global Climate Change.” GIScience & Remote Sensing 53 (5): 596–613. doi:10.1080/15481603.2016.1184741.
- Ruppert, J. C., A. Holm, S. Miehe, E. Muldavin, H. A. Snyman, K. Wesche, and A. Linstadter. 2012. “Meta-Analysis of ANPP and Rain-Use Efficiency Confirms Indicative Value for Degradation and Supports Non-Linear Response along Precipitation Gradients in Drylands.” Journal of Vegetation Science 23 (6): 1035–1050. doi:10.1111/j.1654-1103.2012.01420.x.
- Sala, O. E., W. J. Parton, L. A. Joyce, and W. K. Lauenroth. 1988. “Primary Production of the Central Grassland Region of the USA.” Ecology 69 (1): 40–45. doi:10.2307/1943158.
- Sun, J., G. W. Cheng, and W. P. Li. 2013. “Meta-Analysis of Relationships between Environmental Factors and Aboveground Biomass in the Alpine Grassland on the Tibetan Plateau.” Biogeosciences 10 (3): 1707–1715. doi:10.5194/bg-10-1707-2013.
- Tao, F. L., and Z. Zhang. 2010. “Dynamic Responses of Terrestrial Ecosystems Structure and Function to Climate Change in China.” Journal of Geophysical Research Atmospheres 115 (G3): 58–72. doi:10.1029/2009JG001062.
- Thanyapraneedkul, J., K. Muramatsu, M. Daigo, S. Furumi, N. Soyama, K. N. Nasahara, H. Muraoka, H. M. Noda, S. Nagai, and T. Maeda. 2012. “A Vegetation Index to Estimate Terrestrial Gross Primary Production Capacity for the Global Change Observation Mission-Climate (GCOM-C)/Second-Generation Global Imager (SGLI) Satellite Sensor.” Remote Sensing 4 (12): 3689–3720. doi:10.3390/rs4123689.
- Tilman, D., P. B. Reich, J. Knops, D. Wedin, T. Mielke, and C. Lehman. 2001. “Diversity and Productivity in a Long-Term Grassland Experiment.” Science 294 (5543): 843–855. doi:10.1126/science.1060391.
- Vermeire, L. T., R. K. Heitschmidt, and M. J. Rinella. 2015. “Primary Productivity and Precipitation-Use Efficiency in Mixed-Grass Prairie: A Comparison of Northern and Southern US Sites.” Rangeland Ecology & Management 62 (3): 230–239. doi:10.2111/07-140R2.1.
- Wang, C. T., and H. L. Shi. 2004. “Changes in Plant Species Diversity and Productivity along an Elevation Gradient in an Alpine Meadow.” Acta Phytoecologica Sinica 28 (2): 240–255. doi:10.17521/cjpe.2004.0035.
- Wang, S. P., Z. Q. Zhang, J. J. Zhang, J. Z. Zhu, and J. T. Guo. 2010. “Modeling the Effects of Topography on the Spatial Distribution of Secondary Species in a Small Watershed in the Gully Region on the Loess Plateau, China.” Acta Ecologica Sinica 30 (22): 6102–6112.
- Wu, M. X., S. Qian, Y. Y. Hou, C. S. Li, and L. X. Mao. 2009. “Estimation of Forage Yield in Northern China Based on NDVI Data.” Nongye Gongcheng Xuebao/Transactions of the Chinese Society of Agricultural Engineering 25: 149–155. doi:10.3969/j.issn.1002-6819.2009.z2.028.
- Yahdjian, L., and O. E. Sala. 2006. “Vegetation Structure Constrains Primary Production Response to Water Availability in the Patagonian Steppe.” Ecology 87 (4): 952–962. doi:10.1890/0012-9658(2006)87[952:Vscppr].
- Yang, Y. H., J. Y. Fang, P. A. Fay, J. E. Bell, and C. J. Ji. 2010. “Rain Use Efficiency across a Precipitation Gradient on the Tibetan Plateau.” Geophysical Research Letters 37 (15): 78–82. doi:10.1029/2010gl043920.
- Yang, Y. H., J. Y. Fang, W. H. Ma, and W. Wang. 2008. “Relationship between Variability in Aboveground Net Primary Production and Precipitation in Global Grasslands.” Geophysical Research Letters 35 (23): 46–63. doi:10.1029/2008gl035408.
- Yang, Y. H., J. Y. Fang, Y. D. Pan, and C. J. Ji. 2009. “Aboveground Biomass in Tibetan Grasslands.” Journal of Arid Environments 73 (1): 91–95. doi:10.1016/j.jaridenv.2008.09.027.
- Yuan, F., C. Z. Wang, and M. Mitchell. 2014. “Spatial Patterns of Land Surface Phenology Relative to Monthly Climate Variations: US Great Plains.” GIScience & Remote Sensing 51 (1): 30–50. doi:10.1080/15481603.2014.883210.
- Zhang, Y. G., M. S. Moran, M. A. Nearing, G. E. P. Campos, A. R. Huete, A. R. Buda, and D. D. Bosch. 2013. “Extreme Precipitation Patterns and Reductions of Terrestrial Ecosystem Production across Biomes.” Journal of Geophysical Research-Biogeosciences 118 (1): 148–157. doi:10.1029/2012jg002136.
- Zhao, M. S., F. A. Heinsch, R. R. Nemani, and S. W. Running. 2005. “Improvements of the MODIS Terrestrial Gross and Net Primary Production Global Data Set.” Remote Sensing of Environment 95 (2): 164–176. doi:10.1016/j.rse.2004.12.011.
- Zhao, M. S., and S. W. Running. 2010. “Drought-Induced Reduction in Global Terrestrial Net Primary Production from 2000 through 2009.” Science 329 (5994): 940–953. doi:10.1126/science.1192666.
- Zhu, L. K., and J. Southworth. 2013. “Disentangling the Relationships between Net Primary Production and Precipitation in Southern Africa Savannas Using Satellite Observations from 1982 to 2010.” Remote Sensing 5 (8): 3803–3825. doi:10.3390/Rs5083803.