
Abstract
Funafuti Atoll, Tuvalu is located in the southwestern Pacific Ocean, which has experienced some of the highest rates of global sea-level rise over the past 60 years. Atoll islands are low-lying accumulations of reef-derived sediment that provide the only habitable land in Tuvalu, and are considered vulnerable to the myriad possible impacts of climate change, especially sea-level rise. This study examines the shoreline change of twenty-eight islands in Funafuti Atoll between 2005 and 2015 using 0.65 m QuickBird, 0.46 m WorldView-2, and 0.31 m WorldView-3 imagery using an image segmentation and decision tree classification. Shoreline change estimates are compared to previous study that used a visual interpretation approach. The feasibility of estimating island area with Landsat-8 Operational Land Imager (OLI) data is explored using CLASlite software. Results indicate a 0.13% (0.35 ha) decrease in net island area over the study time period, with 13 islands decreasing in area and 15 islands increasing in area. Substantial decreases in island area occurred on the islands of Fuagea, Tefala and Vasafua, which coincides with the timing of Cyclone Pam in March, 2015. Comparison between the WorldView-2 shoreline maps and those created from Landstat-8 indicate that the estimates tend to be in higher agreement for islands that have an area > 0.5 ha, a compact shape, and no built structures. Ten islands had > 90% agreement, with percent disagreements ranging from 2.78 to 100%. The methods and results of this study speak to the potential of automated EoV shoreline monitoring through segmentation and classification tree approach, which would reduce down data processing and analysis time. With the growing constellation of high and medium spatial resolution satellite-based sensors and the development of semi or fully automated image processing technology, it is now possible to remotely assess the short and medium-term shoreline dynamics on dynamic atolls. Landsat estimates were reasonably matched to those derived from fine resolution imagery, with some caveats about island size and shape.
1. Introduction
Over fifty low-lying coastal countries and territories, classified as Small Island Developing States (SIDS), experience disproportionate environmental and socioeconomic challenges due to their small area, geographical isolation from human and economic resources, low economic resilience, and proclivity to frequent storm events (Barnett Citation2011; Briguglio Citation1995; Pelling and Uitto Citation2001; Turvey Citation2007). Since the official recognition of SIDS at the United Nations Conference on Environment and Development in Rio de Janeiro in 1992, there has been an increasing international commitment to the integrated goals of disaster risk reduction (DRR) and climate change adaptation for SIDS, guided by the Hyogo Framework of Action and the Sendai Framework for Disaster Risk Reduction (United Nations Office of Disaster Risk Reduction (UNISDR), Citation2015. https://www.unisdr.org/we/inform/publications/42809).
Rates of sea-level rise are not uniform across the globe, and as a result the western tropical Pacific has experienced rates up to four times the global average between 1993 and 2009 (Meyssignac et al. Citation2012; Nurse et al. Citation2014). Therefore, the global threats of climate change and the associated rising sea level are observed first, and most acutely in SIDS (Betzold Citation2015). Together with their heightened exposure to natural disasters, these small island states, dispersed throughout the world’s oceans, act as “…an early warning network for detecting the initial signs of environmental variability” (Shultz et al. Citation2016, p. 7). Understanding the extent and rate of recent shoreline changes is an important step toward assisting these vulnerable countries and communities to prepare for the environmental variability expected over the coming century (Albert et al. Citation2016).
Atoll islands are low-lying accumulations of reef-derived sediment found throughout the tropical Indo-Pacific Oceans that are particularly at risk to projected rises in sea level and extreme climate events (Mimura Citation1999; Yamano et al. Citation2007). For some atoll nations such as the Maldives in the Indian Ocean, Kiribati, Marshall Islands, and Tuvalu in the Pacific, atoll islands provide the only habitable land, surfaces of which rarely reach elevations greater than 2–3 m above the mean sea level (Ford Citation2013). Therefore, projected sea-level rise poses one of the most widely recognized threats – coastal erosion and inundation – in particular to low-lying islands and coral atoll ecosystems, upon which Pacific Island peoples depend for their livelihoods and cultures (Mortreux and Barnett Citation2009).
Additionally, extreme events such as tropical cyclones are frequent in much of the Pacific. For example in Tuvalu, an average of eight cyclones per decade developed in or crossed onto the Tuvalu Exclusive Economic Zone between the 1969 and 2010 (Vavae and Epu Citation2011). Cyclones are typically destructive in the short term (Vavae and Epu Citation2011; Connell Citation2015) but can also be agents of island geomorphic enhancement, as cyclone-generated waves and surge can transport and deposit coral line sediments along the coast (Etienne and Terry Citation2012; Connell Citation2015). Many climate models foresee a decrease in frequency but an increase in intensity of tropical cyclones in the southeast Pacific Ocean basin by the end of the twenty-first century (Knutson et al. Citation2010; Vavae and Epu Citation2011). The devastating impacts experienced in Vanuatu during Cyclone Pam in March 2015 exemplify the realities of SIDS’ vulnerabilities to tropical cyclones and the compounding economic and environmental consequences (Shultz et al. Citation2016).
1.1. Shoreline change in Atoll islands
Despite the substantial interest in the future geological stability of small atoll island nations in response to climate change over the last decade, the extent to which sea-level rise attributes to shoreline changes of atoll islands is not well understood (Hisabayashi Citation2016). This is largely due to the challenge of distinguishing between coastal changes due to sea level rise and changes resulting from other coastal processes, such as storm events, human modification, and variations in sediment supply (Maragos, Baines, and Beveridge Citation1973; Baines and McLean Citation1976; McLean and Hosking Citation1991; McLean and Kench Citation2015). Results from recent studies (Webb and Kench Citation2010; Ford Citation2013; Mann and Westphal Citation2014; Kench et al. Citation2015) that examined century-long shoreline changes highlight the dynamic nature of atoll island margins that are “…continually adjusting to normal seasonal erosion and accretion processes, to episodic extreme events and to variations in sediment supply” (McLean and Kench Citation2015, p. 459). However, there is little doubt that sea level will continue to rise and that rates of global mean sea-level rise will accelerate regardless of a global reduction in CO2 emissions (Church et al. Citation2011; Mimura et al. Citation2007; Nicholls and Cazenave Citation2010; Nurse et al. Citation2014), and it is unclear whether atoll islands will continue to maintain their dynamic adjustments at the projected higher rates of change (Kench et al. Citation2015). Indeed, local inter-decadal variability and tectonic movements compounded with the expected higher rates of global mean sea-level rise may result in periods when local rates of rise will be substantially larger than that observed over the last two decades (Albert et al. Citation2016). This gap in knowledge and understanding of island geological adjustments to sea-level rise is a major barrier to development and implementation of appropriate risk reduction and adaptation strategies in atoll nations (Barnett and O’Neil Citation2012; McLean and Kench Citation2015).
There is a large degree of uncertainty concerning the risks of future accelerating sea-level rise and extreme events for low-lying atoll nations. It is important, therefore, to utilize available data and technological capabilities to achieve a better understanding of the dynamism of island margins through inventory and monitoring (Ford Citation2013). For continental coastlines and large islands, analysis of long-term shoreline changes based on the interpretation of remotely sensed images has become an efficient and common approach to both quantify past changes and estimate future response (List et al. Citation1997; Boak and Turner Citation2005; Kumar and Kunte Citation2012; Raji et al. Citation2013; Romine et al. Citation2013; Jana et al. Citation2014; Hou et al. Citation2016). Unfortunately, the limited data availability along with the dynamic seasonal or episodic shoreline oscillations have so far hindered the development of a systematic monitoring approach that adequately examines the relationship between sea-level rise and shoreline changes on atoll islands (Mann and Westphal Citation2014). Nonetheless, there is an increasing number of studies (Biribo and Woodroffe Citation2013; Collen, Garton, and Gardner Citation2009; Ford Citation2011; Ford Citation2013; Houser et al. Citation2014; Kench et al. Citation2006; Mann and Westphal Citation2014; Rankey Citation2011; Yates et al. Citation2013) that use combinations of historical topographic surveys, aerial photographs, satellite imagery, and additional field data to evaluate multi-decadal atoll island shoreline changes. With an ever-growing number of satellites and sensors continuously monitoring the Earth, data derived from remote sensing and digital mapping will continue to provide potential solutions to monitoring island changes, especially in remote, data-poor locations (Lambin et al. Citation1999; Rogan and Mietkiewicz Citation2015).
This study examines the shoreline change of twenty-eight islands in Funafuti Atoll, Tuvalu, between 2005 and 2015 using fine spatial resolution satellite imagery, and explores the feasibility of estimating island area with no-cost moderate spatial resolution imagery. While it is hypothesized that the fine spatial resolution imagery will provide the most precise and consistent estimates of shoreline change, the feasibility of freely available Landsat imagery was evaluated in order to map shoreline conditions as a low-cost option for various conservation agencies.
Funafuti Atoll is located in the southwest Pacific Ocean, which has experienced some of the highest rates of sea-level rise (~5.1 ± 0.7 mm/yr) from 1950 to 2009 due to regional variability and vertical ground motion. The rate is nearly three times the global mean, and corresponds with a total increase in sea level of ~0.30 ± 0.04 m (Ballu et al. Citation2011; Becker et al. Citation2012). The objectives of this research are threefold:
Quantify the changes in island area of twenty-eight islands in Funafuti Atoll using QuickBird (0.65 m panchromatic, 2.4 m multispectral), WorldView-2 (0.46 m panchromatic, 2 m multispectral), and WorldView-3 (0.31 m panchromatic, 2 m multispectral) satellite imagery from five different years in the past decade (2005, 2010, 2012, 2014, 2015).
Compare the results to a published centennial-scale record of physical changes in the islands of Funafuti Atoll by Kench et al. (Citation2015) to determine the feasibility of our data and automated approach to mimic the findings produced through a time-consuming non-automated approach.
Explore the feasibility of quantifying the area of small islands with 30 m Landsat-8 OLI, a publicly available dataset, and CLASlite, a freely available stand-alone image processing software designed for automated vegetation mapping (Asner et al. Citation2009), by comparing between the WorldView-2 shoreline maps from 2015 and those created from Landsat-8 imagery.
2. Study area description
Tuvalu is an independent constitutional nation in the southwestern Pacific Ocean between latitudes 5–11°S and longitudes 176–180 °E, with a population of approximately 10,869 (). Within the total land area of 27 km2, the only habitable land in Tuvalu are small low-lying reef islands, the surfaces of which rarely reach an elevations greater than 2–3 m absolute mean sea level (AMSL) (Ford Citation2013; McLean and Kench Citation2015). Funafuti Atoll (8°S, 179°E; ), where over half of the nation’s population resides, is approximately 25 km north-to-south and 17.5 km in width. It contains 32 islands on the atoll rims, most of which are uninhabited. The islands vary in size, sedimentary composition, and amount of human modification (Kench et al. Citation2015). The capital island of Fongafale is the largest of Funafuti’s islets, and has a narrow and low-lying geography that is vulnerable to inundation under extreme events such as spring tides and tropical cyclones, leaving little space for the population to evacuate (SPRPE, Citation2012). Tuvalu has experienced some of the highest rates of sea-level rise (~5.1 ± 0.7mm/yr) over the past 60 years (Ballu et al. Citation2011; Becker et al. Citation2012), and there is a large degree of uncertainty around the future dynamism of atoll island margins under projected climate-ocean conditions, especially accelerating sea-level rise.
Figure 1. Map of Funafuti Atoll, Tuvalu, with Cyclone Pam’s path (March 2015).
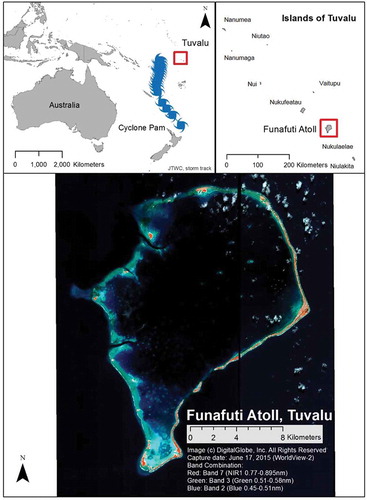
Tropical cyclones tend to impact Tuvalu between November and April, and an average of eight cyclones per decade developed within or crossed the Tuvalu Exclusive Economic Zone (EEZ) between the 1969/70 and 2010/11 seasons (Vavae and Epu Citation2011). Although Funafuti escaped major damage from the recent Category-5 Tropical Cyclone Pam in March 2015 (path shown in ), the cyclone created prolonged sea swells and storm surges that reached Nanumea, Nanumega, Niutao, Nui, Vaitupu, Nukufetau, and Nukulaelae atolls of Tuvalu (IFRC.org, Citation2015), and the cyclone has left visible changes in coastlines (North Citation2015).
2.1. Data description
Fine spatial resolution (<2.4 m) and moderate spatial resolution (30 m) satellite data were used in this study. The fine spatial resolution dataset includes: QuickBird-2 (QB2) satellite imagery captured in 2004, 2005, and 2010; WorldView-2 (WV2) imagery captured in 2010, 2012, and 2015; as well as WorldView-3 (WV3) imagery captured in 2014, provided by DigitalGlobe. The DigitalGlobe data were received in “standard imagery” format, involving radiometric correction: internal detector geometry, optical distortion, scan distortion, any line-rate variations, and registration of the panchromatic and multispectral bands. Additionally, the data were provided in geometrically corrected format (± 2 m horizontal error), and then projected to UTM Zone 60. Finally, all images were co-registered with an accuracy of 0.42 m using available road features and pseudoinvariant landmarks. Following the work of Fletcher et al. (Citation2003), and Cenci et al. (Citation2013) the potential uncertainty in the EoV estimates was calculated as the square root of the sum of squares of three known uncertainty factors: image positional uncertainty (i.e., +/- 0.42 m), EoV measurement uncertainty (i.e. ≥0.42 m), and maximum pixel support size for all data used in the analysis (i.e. 2.4 m). The total uncertainty value was calculated to be 2.47 m.
The dates of image capture are from different months of the year, but offered the best available combination of low cloud cover and off-nadir angles. Satellite imagery acquired at off-nadir angles face some problems associated with bidirectional effects that must be quantified (Qi et al. Citation1995). A brief comparison using three images captured during different months in 2014 with different view angles ranging from 13.33 to 25.64 degrees resulted in an area difference of 0.0807 ha between smallest and greatest angle, for the island of Tepuka; with the widest view angle underestimating island area. As a result, images with the smallest view angles were selected for all subsequent analysis in this study.
The moderate spatial resolution dataset comprises a Landsat-8 surface reflectance OLI image captured June 2015. The Landsat-8 image captured on 2 June 2015 was selected for this study because it was the closest available date to the WorldView-2 data captured on 17 June 2015, with low cloud cover. The characteristics of the satellite imagery from both datasets, including acquisition date, sensor, imaging bands, sensor view angle, solar elevation, cloud cover, and spatial resolution are presented in .
Table 1. Characteristics of satellite imagery used in this study.
3. Methods
Previous studies of shoreline change on atoll islands have used the edge of vegetation (the seaward edge of vegetation) (EoV) as a shoreline proxy, primarily due to the relative ease of identification of this feature within multiple sources of imagery. EoV is also favored for shoreline analysis given the relative long-term stability of the feature compared to short-term shoreline dynamics, and the importance of vegetation as a boundary for island residents (Ford Citation2011; Ford Citation2013; Webb and Kench Citation2010). This study adopts the EoV as a shoreline proxy to calculate the island area. The methodology employs six steps, noted below.
3.1. Data collection and preprocessing
The satellite image tiles that captured the study area were subset to each of the twenty-eight islands, for each year in the data set [2005, 2010, 2012, 2014, 2015]. When multiple images captured the same island in the same year, the image with least cloud cover was used. An image from 2004 was used as a substitute for the 2005 data for the island of Fatao, which was completely covered by cloud in the 2005 image. The satellite images were mostly captured during favorable viewing conditions, with cloud cover percentage ranging from 0% to 9%, view angle (max off nadir) from 1.37–25.64 degrees, and minimum sun elevation from 48.57 to 72.87 degrees.
3.2. Image segmentation
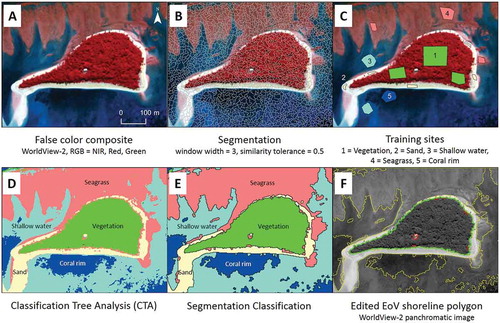
Segmentation is a procedure that groups image pixels into contiguous features based on spectral/variable similarity (Blaschke Citation2010). This study used the TerrSet segmentation module, which employs a watershed approach to partition input imagery based on their variance (Eastman Citation2015). There are three steps involved in the segmentation process. First, a surface image of variance is derived from the input data sets using a user-defined moving window. Then in the watershed delineation process, pixels within a homogeneous region from the surface image are grouped into initial segments based on areas of low variance. Last, adjacent image segments are iteratively merged to form a new image segment according to their spectral similarity based on a user-defined similarity tolerance (Eastman Citation2015). After performing a sensitivity analysis based on visual inspection, the window width of 2.0 and similarity tolerance of 0.5 were selected for use in this study. These segmentation parameters were derived based on trial and error, with subsequent visual inspection/validation. The same segmentation parameters were applied to all images for all years (, step B).
Figure 2. Data processing steps from satellite imagery to shoreline polygons (an example of Fualefeke 2015).
3.3. Decision tree classification
Decision tree classification (DTC) was used (Breiman et al. Citation1984) to map the EoV for the studied islands. DTC is a recursive partitioning algorithm useful for classifying remotely sensed and ancillary data in support of land cover mapping (Hansen, Dubayah, and DeFries Citation1996). DTC works by selecting a single input variable at a time, from which it makes a binary split that partitions the data into increasingly homogeneous sets (Rogan, Franklin, and Roberts Citation2002). When the tree reaches a point where a group of data cannot be split further (i.e. if any further split would not add information or create additional homogenous subsets), it defines that group as an end node representing one output class. Partitioning continues recursively until all user-defined training data are categorized into end nodes (Eastman Citation2015). DTC splitting efficiency was determined using the Gini coefficient, a measure of inequality of a distribution. It is defined as a ratio with values between 0 and 1: the numerator is the area between the Lorenz curve of the distribution and the uniform distribution line; the denominator is the area under the uniform distribution line. Calibration data (training site polygons) were created for each island for every year (, step C). Five land cover categories were used to characterize the island landscapes: vegetation, sand, shallow water, seagrass, and coral rim. For each of the category, at least two training sites were selected and the average size was 150 pixels.
3.4. Segmentation classification
The outputs from the segmentation and DTC steps were used as inputs for the SEGCLASS module in Terrset-IDRISI, which combines the pixel-based DTC with the image segments to create an object-based classification output. This tool classifies the each segment to the class of the majority of pixels within it (, step E). This process can improve the accuracy of the pixel-based classification and produce a smoother, more map-like classification result, while preserving the boundaries between the segments (Elmes et al. Citation2014). All vegetation land-cover was then exported to polygon format, and were edited using 0.35–0.63 m panchromatic imagery (, step F). This visual editing process was required for islands with built structures, where the automated classification process, described previously, classified the built land-cover as a different category from vegetation (often as sand or seagrass). Polygons representing built structures were reclassified as EoV in this visual editing process, in order to add their area to the calculations of the island area. No formal independent validation using an independent set of site was conducted in this analysis due to the very fine spatial resolution of the imagery.
3.5. Island change analysis
The area of each island was calculated using the EoV polygons. Absolute and percentage areal changes for all intervals between 2005, 2010, 2012, 2014, and 2015, the 5-year intervals of 2005–2010 and 2010–2015, as well as the decadal interval of 2005–2015 were calculated for each island. For the first and last year of the time series (2005 and 2015), data from the closest date were used as substitutes for unavailable data for three cases. The results of this approach were compared to those of Kench et al. (Citation2015) in terms of mapped island area (ha), percentage disagreement in island area, and standard score (Z-score).
3.6 Landsat-8 evaluation using CLASlite
The goal of this step was to examine the extent to which 30 m Landsat-8 imagery could be used to map small island areas in comparison with fine spatial resolution (<1 m) imagery from the same study area and time period, using CLASlite. CLASlite is a freely available, stand-alone image processing software developed at Stanford University (http://claslite.carnegiescience.edu/en/). CLASlite is designed for automated identification of deforestation and forest degradation in satellite imagery (Asner et al. Citation2009). CLASlite performs spectral unmixing, which produces a set of images describing the proportional coverage of each land-cover feature for each pixel. An Automated Monte Carlo Unmixing (AutoMCU) approach iteratively selects a Photosynthetic Vegetation (PV), a non-photosynthetic vegetation (NPV), and a Bare Substrate (S) endmember from a spectral library, and unmixes each pixel’s reflectance signature into constituent land-cover fractions. CLASlite produces images of the fractional covers of PV, NPV, and S, uncertainty estimates for each cover fraction, and total root mean squared error (RMSE) for each pixel in the image.
The CLASlite default thresholds for tropical forest are PV >0.80 and S < 0.20, and the alternative thresholds for mapping forest cover in CLASlite range between 0.70 and 0.85 for PV and between 0.05 and 0.25 for S. This process, however, was not suitable for this study due to the fact that the physical scene of the area of interest comprised different land cover classes (densely vegetated islands with some beach width, surrounded by a body of water) than what CLASlite was originally designed to map (forest vs. non-forest). Instead, various combinations of PV, S, and RMSE bands thresholds were explored via sensitivity analysis to determine the best estimates of island area in Funafuti Atoll using the shoreline polygons derived from WorldView-2 data from 2015 to guide the thresholding process.
4. Results
4.1. Island area change in Funafuti Atoll, 2005–2015
The calculated island area and the absolute and percentage changes in island area of the twenty-eight islands in Funafuti Atoll in the past decade (2005, 2010, 2012, 2014, 2015) are presented in . Missing values indicate that the island was not fully captured or was obscured by cloud in the satellite data. For the three data points marked with an asterisk in (Fatao and Fongafale for 2005 and Amatuku for 2015), images from the closest date were used as substitutes. Most of the islands remained stable, experiencing slight accretion or erosion or a combination of both over time. The total net land area of the islands increased by 1.55 ha (0.55%) between 2005 and 2010, and it has decreased by 1.90 ha (0.68%) between 2010 and 2015, resulting in a net decrease by 0.35 ha (0.13%). Over this 10-year period, 13 of 28 studied islands had a net decrease in area, ranging from −0.04% on Fongafale (−0.06 ha) to −100% on Vasafua (−0.07 ha). The decrease in area adds up to −2.56 ha and the mean reduction in island area for these 13 islands was −0.20 ha (−20.5%). The largest absolute decreases in island area occurred on Fuagea (−0.90 ha, −78.33%), Fualefeke (−0.54 ha, −7.94%), and Tefala (−0.34 ha, −43.86%), and Vasafua experienced the largest percentage decrease (−0.07 ha, −100%). Vasafua’s “disappearance” is discussed below. The remaining 15 of 28 studied islands had a net increase in area, totaling 2.21 ha, with a range from negligible values (Motugie, 0.01%, 0.00002 ha) to a 5.05% growth on Falefatu (0.18 ha). The mean increase in island area for these 15 islands was 0.15 ha (2.41%). The largest absolute increase in island area occurred on Funafala (0.83 ha, 3.56%), Avalau-Teafuafou (0.33 ha, 2.74%), and Telele-Motusanapa (0.33 ha, 3.59%).
Table 2. Funafuti Atoll island areas and changes in island area in hectare and in percentage, 2005–2015.
The net area changes in the twenty-eight islands in Funafuti Atoll between the first and last years of the time series (2005–2015) are presented in . The islands are listed along the horizontal axis in the order from the largest (Fongafale) to smallest (Vasafua) by their baseline area in 2005. The 28 islands comprise ten gravel, nine sand, and nine mixed islands, with 13 islands located in the western half and 15 islands in the eastern half (McLean and Hosking Citation1991). The black dots representing percent area change in this figure show how most of the island area changes were relatively small in percentage (+/− 10%) Fuagea and Tefala, both have large absolute and percentage decreases in area, and Vasafua has the largest percentage loss (−100%). Out of the 13 islands that experienced net loss in island area, nine islands (69% of this subset) are located on the western half of the atoll, and eight islands (62%) are sand islands.
Figure 3. Island area changes in hectares and in percentages, 2005–2015.
The gray bars show the magnitude and direction of absolute area change in hectares (scale along the left vertical axis). The black dots indicate the percent area change (scale along the right vertical axis). The two-letter label on each island represents the island’s type (G = Gravel, M = Mixed gravel and sand, or S = Sand) as well as its location (West or East half of the atoll).
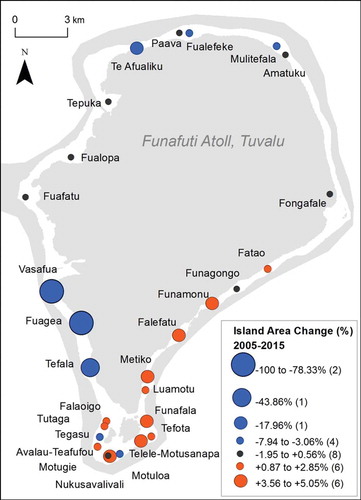
A map of Funafuti Atoll islands symbolized for their percentage area change between 2005 and 2015 is presented in . Fuagea, Tefala, and Vasafua, whose striking areal decreases were highlighted in the bar graph in , are all located on the southwestern side of the atoll. There are no islands that had a net accretion between 2005 and 2015 in the northern half of the atoll, and the islands on the southeast form a cluster of islands that had a positive net change in area.
Figure 4. Symbolized map of islands for percentage area change, 2005–2015. Positive changes in area (island accretion) are symbolized in orange, while negative changes in area (island erosion) are in blue and islands that experienced little change are symbolized in black circles. The size of the circle corresponds to the magnitude of percent change.
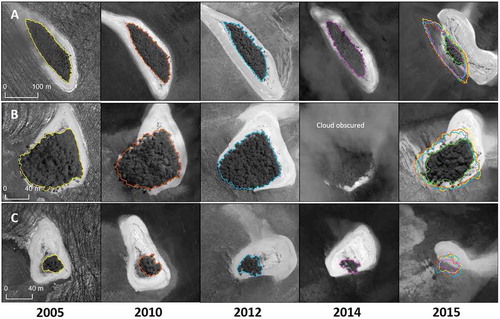
The shoreline changes of three islands in Funafuti Atoll that experienced striking decreases in island area over the last decade are presented in , which shows a time series of panchromatic imagery overlaid with EoV polygons for 2005, 2010, 2012, 2014, and 2015. There are some commonalities among these three islands: they are very small (Vasafua = 0.07 ha, Tefala = 0.77 ha, Fuagea = 1.14 ha in 2005), they are located in the southwestern edge of the atoll (see ), and are relatively isolated from other larger islands. Fuagea and Vasafua are sand islands, and Tefala is a gravel island. The changes in shape and size of the sand beach surrounding the vegetation seen in speaks to the dynamic nature of the island morphology, and there seems to be a west-to-east movement of the sand area over the years for all three islands. The imagery captured in 2015 reveals a significant change in shape and size of the vegetated area for all three islands, and Vasafua’s vegetation is completely missing in the 2015 image. These drastic differences between the 2014 and 2015 imagery are most likely the impacts of Cyclone Pam, which was a Category-5 tropical cyclone that struck the Pacific region on March 9–16 in 2015. The capture dates of the 2014 imagery (12 December 2014) and the 2015 data (17 June 2015) effectively fall roughly three months before and three months after the cyclone has passed west of Funafuti Atoll (See for cyclone path).
Figure 5. A time series of edge of vegetation shoreline polygons in selected islands that experienced significant decrease in island area between 2005 and 2015. A: Fuagea (−0.9ha, −78.33%). B: Tefala (−0.34, −43.86%), C: Vasafua (−0.07ha, −100%).
4.2. Comparison to Kench et al. (Citation2015)’s study
Kench et al. (Citation2015) used a combination of in situ and remotely sensed data to six time slices of shoreline position over the past 118 years on 29 islands (n = 26 after taking out three islands that merged to form single islands over the time period) on the rim of Funafuti Atoll and published a centennial-scale record of planform changes. Their multisource dataset that spans for 118 years include satellite imagery from 2005 (QuickBird) and 2013 (panchromatic WorldView-1). Although the exact date of image acquisition for the Kench et al. (Citation2015) study was not provided, the fact that the work also used data from the year 2005 allowed for a comparison of calculated island areas with this study. The comparison between the Kench et al. (Citation2015) island areas for 2005 and results for the same year from this study is presented in . Fualefeke and Paava were recorded as one entity in the Kench study, so the areas of the two islands for this study were summed for comparison. Fongafale’s area for this study is missing because it was not captured in its entirety by satellite data in 2005. Vasafua islet was not included as one of the islands in the Kench study.
Table 3. Comparison between this study and the Kench et al. (Citation2015) island areas for 2005.
The results show that on average, island area estimates were larger than the Kench study by 0.07 ha (2.45%), with an RMSE of 0.26 ha (7.06%). The values for percent disagreement are all under 10% in absolute value, except for Te Agualiku (17.29%) and Funamanu (−23.32%). Based on their z-score values, these two islands have significantly larger percent disagreement values than the rest of the islands. The island area estimate for Funamanu was significantly smaller (−0.85 ha, −23.32%, z-score −3.81), while the estimate for Te Afualiku (0.04 ha, 17.29%, z-score 2.20) was significantly larger than the Kench study. Except for these two islands, the estimated areas adequately matched between the two studies, with the absolute differences ranging from −0.16 ha to 0.63 ha and the percent disagreements ranging from −3.36% to 9.25%. Potential explanations for the disagreements in island area estimations include: the methodological difference of deriving the shoreline polygons (i.e. the automated approach developed in this study provided consistent estimates that were rigorously checked using Google Earth), and the different dates of data acquisition in 2005 (i.e. this study used near-nadir view angle data, whereas the view angle information for the Kench study is not known).
4.3. Feasibility of Landsat-8 OLI data for island area estimation using CLASlite
The feasibility of quantifying areas of small islands with publicly available dataset (Landsat-8 OLI) and free software (CLASlite) was explored, using the island shoreline polygons derived from the WorldView-2 satellite imagery as a comparison data set. The WorldView-2 image was captured 17 June 2015, and the Landsat-8 image was captured just 15 days prior, on 2 June 2015. The steps of CLASlite result analysis are presented in and . Various combinations of thresholds were tested to make the best estimates of the areas of the islands in Funafuti Atoll using the Photosynthetic Vegetation (PV), Bare Substrate (S), and error (RMSE) bands, and the following values were selected as thresholds: (1) PV ≥75%, (2) S = 100%, and (3) RMSE = 9. The pixels with PV fraction value greater than or equal to 75% that either fell within or intersected the EoV polygon were counted in, and the pixels that either had S fraction value of 100% or RMSE value of 9 (out of 10) were removed from the count. The Landsat-estimated island areas were calculated based on the number of pixels that passed these criteria. The comparison between WorldView-2-derived and Landsat-8-derived areas is presented in . All of the differences between the Landsat-derived and the WorldView-derived island area estimates were under 2 ha, ranging from −1.55 ha to 1.97 ha and averaging at 0.18 ha, except for the largest island of Fongafale, of which Landsat estimate was 72.3 ha smaller than the WorldView estimate due to high omission error.
Table 4. Comparison between island areas in 2015 derived from WorldView-2 and Landsat-8 data.
Figure 6. Examples of CLASlite fraction outputs derived from Landsat-8 data, with EoV shoreline polygon from high resolution data (A-D: Tepuka, E-H: Telele-Motusanapa).
A&E: False color composite of Landsat-8 bands. B&F: Pixels with PV fraction value equal or higher than 75% were selected. C&G: Pixels with S fraction value equal to 100% were taken out. D&H: Pixels with RMSE equal or higher than 9 (out of 10) were removed.
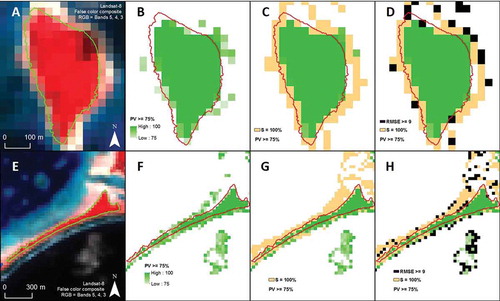
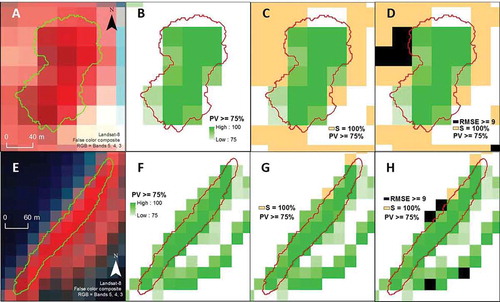
Figure 7. Examples of CLASlite fraction outputs derived from Landsat-8 data, with EoV shoreline polygon from high resolution data (A-D: Falaoigo, E-H: Luamotu).
A&E: False color composite of Landsat-8 bands. B&F: Pixels with PV fraction value equal or higher than 75% were selected. C&G: Pixels with S fraction value equal to 100% were taken out. D&H: Pixels with RMSE equal or higher than 9 (out of 10) were removed.
Areal estimates show a wide range of percentage error between WorldView and Landsat maps, with 11 out of 28 islands having percent error less than 10%, and 10 out of 28 islands having percent error greater than 30%. Focusing on the subset of islands that had low disagreements between the two estimates (<10%), these islands tended to be larger in area (average area: 5.79 ha), compact in shape (average perimeter-to-area ratio: 419.78 m/ha), and uninhabited – with dense vegetation and no building structures. On the other hand, some islands have large disagreements between the two estimates, such as 100% underestimation for Fuagea and 49.67% overestimation for Luamotu. This subset of islands that had large disagreement values (>30%) tended to be smaller in area (average area: 1.43 ha) and more elongated or had more edges (average perimeter-to-area ratio: 929.91 m/ha). Fongafale was treated as an outlier and was not included in the calculations of average area or average perimeter to area ratio for this subset. Amatuku and Fongafale, the only two inhabited islands, were both amongst the subset of islands whose Landsat estimate aligned very poorly with the WorldView estimate. Tepuka and Telele-Motusanapa () and Falaoigo and Luamotu () highlight how the compactness of the island shape influences the accuracy of Landsat estimate of island area. Tepuka (9.76 ha) and Telele-Motusanapa (9.52 ha) and Falaoigo (1.39 ha) and Luamotu (1.80 ha) are similar in size to each other, but Tepuka and Falaoigo are more compact in shape than Telele-Motusanapa and Luamotu. The elongated shape of Telele-Motusanapa and Luamotu causes overestimation of island area because any pixel that passes the thresholds that “intersect” with the WorldView shoreline polygon were counted in for the calculation of estimated area.
5. Discussion
The findings of this study demonstrate some potential and value of the use of remotely sensed data for shoreline monitoring in Pacific atoll nations. Shoreline mapping techniques have evolved from ground-based surveys, to aerial photographs, to satellite imagery, and there has been a recognized need to improve the accuracy of shoreline mapping through robust and repeatable detection techniques within the available data sources (Morton Citation1991; Boak and Turner Citation2005). Some studies (Leatherman, Zhang, and Douglas Citation2000; Romine et al. Citation2013; Albert et al. Citation2016) have systematically/rigorously shown the relationship between sea-level rise and shoreline changes, but the dramatic impacts of climate change felt on coastlines and people across the Pacific are still anecdotal and highlights the urgent need for further research.
This study supports the notion that high spatial resolution datasets can detect small island features, and are therefore appropriate for monitoring island landform changes in short intervals. For instance, the level of details observed in this study on Vasafua islet that lost all vegetation due to Cyclone Pam would not have been detected if not for the availability of fine spatial resolution data and the short revisit times. The methods and results of this study speak to the potential of automated EoV shoreline monitoring through segmentation and classification tree approach, which would dramatically cut down the data processing time in comparison to the manual hand-digitization approach. With the growing constellation of high resolution satellite-based sensors and the development of semi or fully automated image processing technology, it is now possible to remotely assess the short and medium-term shoreline dynamics on atolls (Ford Citation2013).
The potential of mapping and estimating the atoll island area using freely available data (Landsat-8) and automated vegetation mapping software (CLASlite) was also explored, and although further research is needed to establish best practices, results demonstrated that Landsat-8 OLI data can estimate island area with 85–90% agreement to area derived from WorldView-2 data for about a third of the islands in Funafuti Atoll. Landsat imagery is freely accessible, has an extensive historical archive, and has broader spatial and temporal coverage than high resolution satellite data or aerial orthophotos (Giner and Rogan Citation2012). This study therefore can have practical implications for coastal managers, government agencies or other organizations who lack the financial and personnel resources to access and process high resolution imagery for shoreline monitoring, but want to obtain reliable estimates of island areas.
While remote sensing and GIS technologies are powerful tools that can offer potential solutions in disaster risk reduction, the limitations must be discussed. Concerning the Landsat data analysis, we acknowledge that the efficacy of land surface reflectance correction is likely reduced in coastal regions where land area is small, relative to adjacent water. In this study we used the standard NASA Landsat products at face-value due to the ethos of the paper – to explore island area change at low cost for their implementation in SIDS. Future work will address the apparent influence of land surface reflectance correction in the context of SIDS.
A number of factors could have impacted the accuracy and validity of the calculated area and area change of the studied islands. The view angles of QuickBird and WorldView imagery are typically not at nadir and ranged from 1.37 to 25.64 degrees which could influence the geometric distortion of the data, as well as introducing reflectance artifacts. However, this study used the imagery with the smallest view angle whenever possible. The margin of error for island area estimates should be explored in the future, using imagery that capture the same area for a similar date but from different view angles. Third, the time series was not complete simply because of lack of coverage or cloud cover. Last, the data from each year in the time series were captured in different months of the year, which could result in failure to take seasonality into consideration of the change analysis.
With the rapid development in remote sensing technology over the last few decades and the increasing need of accurate coastline information in the context of global climate change and rising sea level, the development of systematic shoreline monitoring models has become a goal of high importance (Gens Citation2010; Klemas Citation2010; Ford Citation2013). Especially for small, low-lying island nations such Tuvalu and other Pacific nations located in the global sea-level rise hotspot, there is a critical need to understand the complex interplay between the projected accelerating sea-level rise and island shoreline dynamics, along with other changes such as winds, tides, and local tectonics (Albert et al. Citation2016). The popular narrative of sea-level rise resulting in island inundation and destruction and ultimately out-migration of people in the Pacific island nations undermines the development of constructive adaptive pathways that build resilience in island communities (Farbotko Citation2010; Kelman Citation2014; McCubbin, Smit, and Pearce Citation2015). Instead, the challenge into the future is to develop flexible adaptation strategies that accommodate the ongoing dynamism of island margins (McLean and Kench Citation2015). Reducing disaster risk is a cost effective investment, and remotely sensed data should become more available and more utilized to provide unique information to support the climate change resilience of small island states.
6. Conclusion
This study examined the shoreline change of twenty-eight islands in Funafuti Atoll, Tuvalu, between 2005 and 2015 using satellite images from QuickBird and WorldView sensors, and explored explore the feasibility of estimating island area with moderate spatial resolution data (Landsat-8) and automated vegetation mapping software (CLASlite). The key findings are summarized as follows:
Over the last decade, the high spatial resolution imagery indicated a 0.13% decrease in net island area in Funafuti Atoll. The short intervals between the satellite data used in this study support the findings of previous studies (see Kench et al. Citation2015) that island shoreline changes in this region are dynamic, as there was a net increase of 0.56% from 2005–2010, followed by a net decrease of 0.68% from 2010–2015 ().
Substantial decreases in island area were detected in three small, uninhabited islands all located in the southwestern rim of Funafuti Atoll (Fuagea, Tefota, and Vasafua ( and ). The most drastic changes in these islands occurred between December 2014 and June 2015, which we deduce to be the impact wrought by the Category 5 Cyclone Pam that passed through the southwest Pacific Ocean in March 2015.
The island areas calculated in this study are in reasonable agreement with the results from the Kench et al. (Citation2015) study, with a RMSE of 0.26 ha (7.06%). On average, the areal estimates were larger than the Kench estimates by 0.07 ha (2.45%).
The comparison between island area estimates derived from WorldView-2 (2 m) vs. Landsat-8 (30 m) showed notable potential for freely available Landsat-8 data to estimate island area with 85–90% agreement to area derived from WorldView-2 data. Island area estimates tended to have higher percentage agreement for larger, more compact islands.
Island area estimates derived from WorldView vs. Landsat tended to align poorly and have larger percent disagreement for very small (<0.5 ha) islands as well as islands with built structures. Landsat did not detect some of the smallest islands, and the building structures that fragmented the dense vegetation were the main cause of omission error for island area estimates. The bathymetric vegetation (seagrass) surrounding the islands also affected the PV fractional values in the water, increasing commission error.
Finally, we did not conduct a change analysis using a time-series of Landsat data, to carry out a comparison between the fine spatial resolution dataset and the Landsat data for the time interval 2005–2015 because we felt that this would be beyond the scope of the paper itself. Our intention was solely to determine the feasibility of free Landsat imagery to measure island area (using EoV) in relation to the fine spatial resolution imagery. Our results demonstrate that, almost surprisingly, the Landsat estimates are reasonably matched to those derived from fine resolution imagery, with some caveats about island size and shape. Therefore, future work will explore the use and efficacy of the Landsat data archive to track island area over the 15-year time frame.
Acknowledgments
The authors wish to thank the following people who kindly assisted with this research:
Andrew Steele (DigitalGlobe, Inc.), Ross Winans (NOAA Inouye Regional Center, Honolulu, Hawaii), Sam Ratick and Brenda Nikas-Hayes (Clark Graduate School of Geography, Worcester Massachusetts), Paul Kench (School of Environment, The University of Auckland) and Roger Mclean (School of Physical, Environmental and Mathematical Sciences, the University of New South Wales, Canberra).
Disclosure statement
No potential conflict of interest was reported by the authors.
References
- Albert, S., J. X. Leon, A. R. Grinhan, J. A. Church, B. R. Gibbes, and C. D. Woodroffe. 2016. “Interactions between Sea-Level Rise and Wave Exposure on Reef Island Dynamics in the Solomon Islands.” Environmental Research Letters 11 (5). doi:10.1088/1748-9326/11/5/054011.
- Asner, G. P., D. E. Knapp, A. Balaji, and G. Paez-Acosta. 2009. “Automated Mapping of Tropical Deforestation and Forest Degradation: CLASlite.” Journal of Applied Remote Sensing 3: 1–24. doi:10.1117/1.3223675.
- Baines, G. B., and R. F. McLean. 1976. “Sequential Studies of Hurricane Deposit Evolution at Funafuti Atoll.” Marine Geology 21 (1): M1–M8. doi:10.1016/0025-3227(76)90097-9.
- Ballu, V., M. N. Bouin, P. Simeoni, W. C. Crawford, S. Calmant, J. M. Bore, T. Kana, and B. Pelletier. 2011. “Comparing the Role of Absolute Sea Level Rise and Vertical Tectonic Motions in Coastal Flooding, Torres Islands (Vanuatu).” PNAS 108: 13019–13022. doi:10.1073/pnas.1102842108.
- Barnett, J. 2011. “Dangerous Climate Change in the Pacific Islands: Food Production and Food Security.” Regional Environmental Change 11 (1): 229–237. doi:10.1007/s10113-010-0160-2.
- Barnett, J., and S. O’Neil. 2012. “Islands, Resettlement and Adaptation.” Nature Climate Change 2: 8–10. doi:10.1038/nclimate1334.
- Becker, M., B. Meyssignac, C. Letetrel, W. Llovel, A. Cazenave, and T. Delcroix. 2012. “Sea Level Variations at Tropical Pacific Islands since 1950.” Global and Planetary Change 80-81: 85–98. doi:10.1016/j.gloplacha.2011.09.004.
- Betzold, C. 2015. “Adapting to Climate Change in Small Island Developing States.” Climate Change 133 (3): 481–489. doi:10.1007/s10584-015-1408-0.
- Biribo, N., and C. D. Woodroffe. 2013. “Historical Area and Shoreline Change of Reef Islands around Tarawa Atoll, Kiribati.” Sustainable Science 8: 345–362. doi:10.1007/s11625-013-0210-z.
- Blaschke, T. 2010. “Object Based Image Analysis for Remote Sensing.” ISPRS Journal of Photogrammetry and Remote Sensing 65 (1): 2–16. doi:10.1016/j.isprsjprs.2009.06.004.
- Boak, E. H., and I. L. Turner. 2005. “Shoreline Definition and Detection: A Review.” Journal of Coastal Research 2 (4): 688–703. doi:10.2112/03-0071.1.
- Breiman, L., J. Friedman, C. J. Stone, and R. A. Olshen. 1984. Classification and Regression Trees. Boca Raton, FL: CRC Press.
- Briguglio, L. 1995. “Small Island Developing States and Their Economic Vulnerabilities.” World Development 23 (9): 1615–1632. doi:10.1016/0305-750X(95)00065-K.
- Cenci, L., L. Disperati, L. P. Sousa, M. Phillips, and F. L. Alves. 2013. “Geomatics forIntegrated Coastal Zone Management: Multitemporal Shoreline Analysis and Future Regional Perspective for the Portuguese Central Region.” Journal of Coastal Research 65: 1349–1354. [ Special Issue.] doi:10.2112/SI65-228.1.
- Church, J. A., J. M. Gregory, N. J. White, S. M. Platten, and J. X. Mitrovica. 2011. “Understanding and Projecting Sea Level Change.” Oceanography 24 (2): 130–143. doi:10.5670/oceanog.
- Collen, J. D., D. W. Garton, and J. P. A. Gardner. 2009. “Shoreline Changes and Sediment Redistribution at Palmyra Atoll (Equatorial Pacific Ocean): 1874–Present.” Journal of Coastal Research 25 (3): 711–722. doi:10.2112/08-1007.1.
- Connell, J. 2015. “Vulnerable Islands: Climate Change, Tectonic Change, and Changing Livelihoods in the Western Pacific.” The Contemporary Pacific 27 (1): 1–26. doi:10.1353/cp.2015.0014.
- Eastman, J. R. 2015. TerrSet Geospatial Monitoring and Modeling Software. Worcester, MA: Clark Labs.
- Elmes, A., J. G. Yarlequé Ipanaqué, J. Rogan, N. Cuba, and A. Bebbington. 2014. “Mapping Licit and Illicit Mining Activity in the Madre De Dios Region of Peru.” Remote Sensing Letters 5 (10): 882–891. doi:10.1080/2150704X.2014.973080.
- Etienne, S., and J. P. Terry. 2012. “Coral Boulders, Gravel Tongues and Sand Sheets: Features of Coastal Accretion and Sediment Nourishment by Cyclone Tomas (March 2010) on Taveuni Island, Fiji.” Geomorphology 175: 54–65. doi:10.1016/j.geomorph.2012.06.018.
- Farbotko, C. 2010. “Wishful Sinking: Disappearing Islands, Climate Refugees and Cosmopolitan Experimentation.” Asia Pacific Viewpoint 51 (1): 47–60. doi:10.1111/apv.2010.51.issue-1.
- Fletcher, C., J. Rooney, M. Barbee, S.-C. Lim, and B. Richmond. 2003. “Mapping Shoreline Change Using Digital Orthophotogrammetry on Maui, Hawaii.” Journal of Coastal Research 38: 106–124. Special Issue.
- Ford, M. 2011. “Shoreline Changes on an Urban Atoll in the Central Pacific Ocean: Majuro Atoll, Marshall Islands.” Journal of Coastal Research 28: 11–22.
- Ford, M. 2013. “Shoreline Changes Interpreted from Multi-Temporal Aerial Photographs and High Resolution Satellite Images: Wotje Atoll, Marshall Islands.” Remote Sensing of Environment 135: 130–140. doi:10.1016/j.rse.2013.03.027.
- Gens, R. 2010. “Remote Sensing of Coastlines: Detection, Extraction and Monitoring.” International Journal of Remote Sensing 31 (7): 1819–1836. doi:10.1080/01431160902926673.
- Giner, N. M., and J. Rogan. 2012. “A Comparison of Landsat ETM+ and High-Resolution Aerial Orthophotos to Map Urban/Suburban Forest Cover in Massachusetts, USA.” Remote Sensing Letters 3 (8): 667–676. doi:10.1080/01431161.2012.656767.
- Hansen, M., R. Dubayah, and R. DeFries. 1996. “Classification Trees: An Alternative to Traditional Land Cover Classifiers.” International Journal of Remote Sensing 17 (5): 1075–1081. doi:10.1080/01431169608949069.
- Hisabayashi, M. (2016). Quantifying Shoreline Change in Funafuti Atoll, Tuvalu Using a Time Series of QuickBird and WorldView Data. MSci Thesis, Clark University. 49 pp.
- Hou, X. Y., T. Wu, W. Hou, Q. Chen, Y. D. Wang, and L. J. Yu. 2016. “Characteristics of Coastline Changes in Mainland China since the Early 1940s.” Science China Earth Sciences 59: 1791–1802. doi:10.1007/s11430-016-5317-5.
- Houser, C., T. D’Ambrosio, C. Bouchard, W. Heyman, K. Darbonne, and S. Kuykendall. 2014. “Erosion and Reorientation of the Sapodilla Cays, Mesoamerican Reef Belize from 1960 to 2012.” Physical Geography 34 (4): 335–354. doi:10.1080/02723646.2014.913932.
- International Federation of Red Cross and Red Crescent Societies. 2015. Emergency Plan of Action (Epoa) Tuvalu: Tropical Cyclone Pam. http://reliefweb.int/sites/reliefweb.int/files/resources/MDRTV001dref.pdf
- Jana, A., A. Biswas, S. Maiti, and A. K. Bhattacharya. 2014. “Shoreline Changes in Response to Sea Level Rise along Digha Coast, Eastern India: An Analytical Approach of Remote Sensing, GIS and Statistical Techniques.” Journal of Coastal Conservation 18 (3): 145–155. doi:10.1007/s11852-013-0297-5.
- Kelman, I. 2014. “No Change from Climate Change: Vulnerability and Small Island Developing States.” The Geographical Journal 180 (2): 120–129. doi:10.1111/geoj.2014.180.issue-2.
- Kench, P. S., R. W. Brander, K. E. Parnell, and R. F. McLean. 2006. “Wave Energy Gradients across a Maldivian Atoll: Implications for Island Geomorphology.” Geomorphology 81: 1–17. doi:10.1016/j.geomorph.2006.03.003.
- Kench, P. S., D. Thompson, M. R. Ford, H. Ogawa, and R. F. Mclean. 2015. “Coral Islands Defy Sea-Level Rise over the past Century: Records from a Central Pacific Atoll.” Geology 43 (6): 515–518. doi:10.1130/G36555.1.
- Klemas, V. 2010. “Remote Sensing Techniques for Studying Coastal Ecosystems: An Overview.” Journal of Coastal Research 27 (1): 2–17. doi:10.2112/JCOASTRES-D-10-00103.1.
- Knutson, T. R., J. L. McBride, J. Chang, K. Emanuel, G. Holland, C. Landsea, I. Held, J. P. Kosin, A. K. Srivastava, and M. Sugi. 2010. “Tropical Cyclones and Climate Change.” Nature Geoscience 3: 157–163. doi:10.1038/ngeo779.
- Kumar, A. A., and P. D. Kunte. 2012. “Coastal Vulnerability Assessment for Chennai, East Coast of India Using Geospatial Techniques.” Natural Hazards 64 (1): 853–872. doi:10.1007/s11069-012-0276-4.
- Lambin, E. F., X. Baulies, N. Bockstael, G. Fischer, T. Krug, R. Leemans, E. F. Moran et al. (1999). Land-Use and Land-Cover Change (LUCC) Implementation Strategy. IGBP Report 48, IHDP Report 10.
- Leatherman, S. P., K. Zhang, and B. C. Douglas. 2000. “Sea Level Rise Shown to Drive Coastal Erosion.” Eos, Transactions American Geophysical Union 81 (6): 55–57. doi:10.1029/00EO00034.
- List, J. H., A. H. Sallenger, M. E. Hansen, and B. E. Jaffe. 1997. “Accelerated Relative Sea-Level Rise and Rapid Coastal Erosion: Testing a Causal Relationship for the Louisiana Barrier Islands.” Marine Geology 140 (3): 347–365. doi:10.1016/S0025-3227(97)00035-2.
- Mann, T., and H. Westphal. 2014. “Assessing Long-Term Changes in the Beach Width of Reef Islands Based on Temporally Fragmented Remote Sensing Data.” Remote Sensing 6: 6961–6987. doi:10.3390/rs6086961.
- Maragos, J. E., G. B. Baines, and P. J. Beveridge. 1973. “Tropical Cyclone Bebe Creates a New Land Formation on Funafuti Atoll.” Science 181 (4105): 1161–1164. doi:10.1126/science.181.4105.1161.
- McCubbin, S., B. Smit, and T. Pearce. 2015. “Where Does Climate Fit? Vulnerability to Climate Change in the Context of Multiple Stressors in Funafuti, Tuvalu.” Global Environmental Change 30: 43–55. doi:10.1016/j.gloenvcha.2014.10.007.
- McLean, R., and P. Kench. 2015. “Destruction or Persistence of Coral Atoll Islands in the Face of 20th and 21st Century Sea-Level Rise?” WIREs Climate Change Wiley Interdisciplinary Reviews: Climate Change 6: 445–463. doi:10.1002/wcc.2015.6.issue-5.
- McLean, R. F., and P. L. Hosking. 1991. “Geomorphology of Reef Islands and Atoll Motu in Tuvalu.” South Pacific Journal of Natural Science 11: 167–189.
- Meyssignac, B., M. Becker, W. Llovel, and A. Cazenave. 2012. “An Assessment of Two- Dimensional past Sea Level Reconstructions over 1950–2009 Based on Tide-Gauge Data and Different Input Sea Level Grids.” Surveys in Geophysics 33 (5): 945–972. doi:10.1007/s10712-011-9171-x.
- Mimura, N. 1999. “Vulnerability of Island Countries in the South Pacific to Sea Level Rise and Climate Change.” Climate Research 12 (2–3): 137–143. doi:10.3354/cr012137.
- Mimura, N., L. Nurse, R. F. McLean, J. Agard, L. Briguglio, P. Lefale, R. Payet, and G. Sem. 2007. “Small Islands. Climate Change 2007: Impacts, Adaptation and Vulnerability.” In Contribution of Working Group II to the Fourth Assessment Report of the Intergovernmental Panel on Climate Change, Edited by M. L. Parry, O. F. Canziani, J. P. Palutikof, P. J. van der Linden, and C. E. Hanson, 687–716. Cambridge, UK: Cambridge University Press.
- Morton, R. A. 1991. “Accurate Shoreline Mapping: Past, Present, and Future.” Proceedings of the Coastal Sediments 91: 997–1010.
- Mortreux, C., and J. Barnett. 2009. “Climate Change, Migration and Adaptation in Funafuti, Tuvalu.” Global Environmental Change 19: 105–112. doi:10.1016/j.gloenvcha.2008.09.006.
- Nicholls, R. J., and A. Cazenave. 2010. “Sea-Level Rise and Its Impact on Coastal Zones.” Science 328 (5985): 1517–1520. doi:10.1126/science.1185782.
- North, R. (2015, April 17). Nowhere to Run. Tuvaluans consider their future after Tropical Cyclone Pam. Retrieved April 22, 2016, from http://www.ifrc.org/en/news-and-media/news-stories/asia-pacific/tuvalu/nowhere-to-run- tuvaluans-consider-their-future-after-tropical-cyclone-pam-68429/
- Nurse, L. A., R. F. McLean, J. Agard, L. P. Briguglio, V. Duvat-Magnan, N. Pelesikoti, E. Tompkins, and A. Webb. 2014. “Small Islands.” In Climate Change 2014: Impacts, Adaptation, and Vulnerability. Part B: Regional Aspects. Contribution of Working Group II to the Fifth Assessment Report of the Intergovernmental Panel on Climate Change, edited by V. R. Barros, C. B. Field, D. J. Dokken, M. D. Mastrandrea, K. J. Mach, T. E. Bilir, M. Chatterjee, et al., 1613–1654. Cambridge, United Kingdom and New York, NY, USA: Cambridge University Press.
- Pelling, M., and J. I. Uitto. 2001. “Small Island Developing States: Natural Disaster Vulnerability and Global Change.” Environmental Hazards 3: 49–62. doi:10.3763/ehaz.2001.0306.
- Qi, J., M. S. Moran, F. Cabot, and G. Dedieu. 1995. “Normalization of Sun/View Angle Effects Using Spectral Albedo-Based Vegetation Indices.” Remote Sensing of Environment 52 (3): 207–217. doi:10.1016/0034-4257(95)00034-X.
- Raji, O., S. Niazi, M. Snoussi, L. Dezileau, and A. Khouakhi. 2013. “Vulnerability Assessment of a Lagoon to Sea Level Rise and Storm Events: Nador Lagoon (NE Morocco).” Journal of Coastal Research 1 (65): 802. doi:10.2112/SI65-136.1.
- Rankey, E. C. 2011. “Nature and Stability of Atoll Island Shorelines: Gilbert Island Chain, Kiribati, Equatorial Pacific.” Sedimentology 58: 1831–1859. doi:10.1111/sed.2011.58.issue-7.
- Rogan, J., J. Franklin, and D. A. Roberts. 2002. “A Comparison of Methods for Monitoring Multitemporal Vegetation Change Using Thematic Mapper Imagery.” Remote Sensing of Environment 80 (1): 143–156. doi:10.1016/S0034-4257(01)00296-6.
- Rogan, J., and N. Mietkiewicz. 2015. “Land Cover Change Detection.” In Land Resources Monitoring, Modeling, and Mapping with Remote Sensing, Vol. 2, Remote Sensing Handbook, 579–603. CRC Press.
- Romine, B. M., C. H. Fletcher, M. M. Barbee, T. R. Anderson, and L. N. Frazer. 2013. “Are Beach Erosion Rates and Sea-Level Rise Related in Hawaii?” Global and Planetary Change 108: 149–157. doi:10.1016/j.gloplacha.2013.06.009.
- Secretariat of the Pacific Regional Environment Programme, Global Environment Facility. Australian Agency for International Development., Secretariat of the Pacific Community., Pacific Adaptation to Climate Change (PACC), United Nations Development Programme. Tuvalu National Strategic Action Plan for Climate Change and Disaster Risk Management, 2012-2016. OCLC Number 893242466. Apia, Samoa. Secretariat of the Pacific Regional Environment Programme, (2012). Web. 19 October 2015.
- Shultz, J. M., M. A. Cohen, S. Hermosilla, Z. Espinel, and A. McLean. 2016. “Disaster Risk Reduction and Sustainable Development for Small Island Developing States.” Disaster Health 3: 32–44. doi:10.1080/21665044.2016.1173443.
- Turvey, R. 2007. “Vulnerability Assessment of Developing Countries: The Case of Small-Island Developing States.” Development Policy Review 23 (2): 243–264. doi:10.1111/j.1467-7679.2007.00368.x.
- United Nations Office of Disaster Risk Reduction. (2015). Sendai Framework for Disaster Risk Reduction 2015-2030. http://www.preventionweb.net/files/43291_sendaiframeworkfordrren.pdf
- Vavae, H., and K. Epu Australian Bureau of Meteorology and CSIRO. (2011). Climate Change in the Pacific: Scientific Assessment and New Research. Volume 2. Country Reports. Chapter 15 (Tuvalu).
- Webb, A. P., and P. S. Kench. 2010. “The Dynamic Response of Reef Islands to Sea-Level Rise: Evidence from Multi-Decadal Analysis of Island Change in the Central Pacific.” Global and Planetary Change 72: 234–246. doi:10.1016/j.gloplacha.2010.05.003.
- Yamano, H., H. Kayanne, T. Yamaguchi, Y. Kuwahara, H. Yokoki, H. Shimazaki, and M. Chicamori. 2007. “Atoll Island Vulnerability to Flooding and Inundation Revealed by Historical Reconstruction: Fongafale Islet, Funafuti Atoll, Tuvalu.” Global and Planetary Change 57: 407–416. doi:10.1016/j.gloplacha.2007.02.007.
- Yates, M. L., G. Le Cozannet, G. Garcin, E. Salai, and P. Walker. 2013. “Multi-Decadal Atoll Shoreline Change on Manihi and Manuae, French Polynesia.” Journal of Coastal Research 29: 870–892. doi:10.2112/JCOASTRES-D-12-00129.1.