
Abstract
One of the challenges in fighting plant invasions is the inefficiency of identifying their distribution using field inventory techniques. Remote sensing has the potential to alleviate this problem effectively using spectral profiling for species discrimination. However, little is known about the capability of remote sensing in discriminating between shrubby invasive plants with narrow leaf structures and other cohabitants with similar ecological niche. The aims of this study were therefore to (1) assess the classification performance of field spectroradiometer data among three bushy and shruby plants (Artemesia afra, Asparagus laricinus, and Seriphium plumosum) from the coexistent plant species largely dominated by acacia and grass species, and (2) explore the performance of simulated spectral bands of five space-borne images (Landsat 8, Sentinel 2A, SPOT 6, Pleiades 1B, and WorldView-3). Two machine-learning classifiers (boosted trees classification and support vector machines) were used to classify raw hyperspectral (n = 688) and simulated multispectral wavelengths. Relatively high classification accuracies were obtained for the invasive species using the original hyperspectral bands for both classifiers (overall accuracy, OA = 83–97%). The simulated data resulted in higher accuracies for Landsat 8, Sentinel 2A, and WorldView-3 compared to those computed for bands simulated to SPOT 6 and Pleiades 1B data. These findings suggest the potential of remote-sensing techniques in the discrimination of different plant species with similar morphological characteristics occupying the same niche.
Introduction
Invasive alien plants present a major threat to the world’s ecological system and its biodiversity, ranking second after direct anthropogenic habitat destructions (Mack, Simberloff, and Lonsdale Citation2000; Richardson and Van Wilgen Citation2004). Efficient management and control of such plants must be guided by accurate information related to target as well as co-existing plants. The traditional method of field-based vegetation characterization is considered accurate; this is nevertheless constrained by various factors such as the inability to offer large spatial coverage, cost ineffectiveness, and reliance on labor that can introduce subjectivity in the information (Rocchini et al. Citation2015). In contrast, remote sensing offers a time- and cost-efficient alternative. Although several studies have applied multispectral remote-sensing systems for alien or weedy plants assessment (e.g. Hardin et al. Citation2007; Meng et al. Citation2012; Diao and Wang Citation2016; Michez et al. Citation2016; Peerbhay et al. Citation2016; Robinson et al. Citation2016; Adam, Mureriwa, and Newete Citation2017; Mafanya et al. Citation2017; Perroy, Sullivan, and Stephenson Citation2017; Pu and Bell Citation2017; Wallace et al. Citation2017), discrimination of subtle differences in species composition remains a major problem of such systems that operate using broad spectral bands.
Hyperspectral remote sensing provides several narrow and contiguous bands that enhance discrimination between native and non-native plants (Huang and Asner Citation2009). A growing number of research is therefore exploiting the capabilities of imaging spectroscopy to map non-native/invasive plants in different vegetation types (e.g. Hestir et al. Citation2008; Yang and Everitt Citation2010; Swain, Narumalani, and Mishra Citation2011; Taylor et al. Citation2012; Ghosh et al. Citation2013; Mirik et al. Citation2013; Atkinson, Ismail, and Robertson Citation2014). Yang and Everitt (Citation2010), for example, used air-borne hyperspectral data to map three invasive weeds including Ashe juniper, broom snakeweed, and water hyacinth, each mixed with different plant species. The study reported high accuracy levels; however, there was a great deal of variation in foliage morphology between the plants of interest. Pantazi, Moshou, and Bravo (Citation2016) utilized hyperspectral imagery acquired from a robotic platform to discriminate maize crop and cohabitant weeds with high levels of accuracy. Spectral discrimination of plants in managed farms characterized by homogeneity in species composition and growth conditions is expected to be easier than those observed in natural environments where diversity in terms of species composition and growth patterns are common.
Similarly, several studies applied field-based hyperspectral remote sensing to distinguish alien plants from cohabitant plants (e.g. Taylor et al. Citation2012; Ghosh et al. Citation2013; Lehmann et al. Citation2015; Aneece and Epstein Citation2017; Kganyago et al. Citation2017). Taylor, Hill, and Edwards (Citation2013) used field spectral data to successfully discriminate rhododendron (Rhododendron ponticum), categorized as a non-native and invasive plant in the study area, from other winter plants. The plant, however, had relatively large leaf dimensions measuring approximately 6–13 cm in length and a leaf-to-width ratio ranging 2.9–3.7. Lehmann et al. (Citation2015) estimated tannin concentrations of an invasive Acacia Longifolia and co-existing Mediterranean native plants using hand-held spectral data, and subsequently classified all the plants based on variations in tannin concentrations. Similar to the instances in the work of Taylor, Hill, and Edwards (Citation2013), A. longifolia had relatively larger leaf size compared to the co-existing plants under consideration. Furthermore, Taylor, Hill, and Edwards (Citation2013) collected leaf-level spectra acquired using contact remote-sensing approach, and thus did not simulate common non-contact remote-sensing scenarios that are prone to atmospheric and background interferences. Spectral readings from broad-leaved plants are relatively uncontaminated by information from background reflectance. In contrast, the gaps that exist in the foliage of narrow-leaved plants result in spectral responses from both the plant components and features lying under the plant. Moreover, anatomical and physiological variations that exist between large plants can be captured spectrally with relative ease, compared to the variations in small herbaceous or shrubby plants. There is, therefore, the need to explore the utility of remote-sensing tools in detecting narrow-leaved weeds.
Another limitation that needs to be taken into consideration in relation to utilizing imaging spectroscopy is the limited availability of the system for routine monitoring purposes. In contrast, multispectral data remain an affordable and easily accessible alternative among research communities and conservation practitioners worldwide. Calibrating and improving the performance of multispectral data for plant species identification is therefore vital to assist in the management of plant invasions and conservation efforts. In this regard, the proliferation of field spectroscopy presents the opportunity for simulating current and planned multispectral remote-sensing missions. Fletcher and Reddy (Citation2016), for example, simulated WorldView-3 multispectral bands from field spectroradiometer data to classify soybean varieties and pigweeds, and reported high accuracy levels. Although such results do not necessarily compare with what would be obtained from actual data collected by WorldView-3, they provide strong indication on the efficacy of multispectral data for detecting invasive or undesirable plants.
This study aims to investigate the utility of a field spectroradiometer data in detecting different shrubby invasive weeds and other cohabiting plants. The study has two specific objectives: (1) to assess the performance of visible/infrared field spectroradiometery in discriminating narrow-leaved invasive species, namely, Artemisia afra, Asparagus laricinus, and Seriphium plumosum, from each other and from co-existent narrow-leaved plants; (2) to investigate the potential of spectra simulated according to multispectral bands of selected space-borne images to discriminate the plants in objective (1). The first objective intends to determine the efficacy of spectroradiometer data in discriminating targets comprised of spectral mixture from different plants as well as other likely background interference. In addition, it attempts to discriminate plants that have similar leaf-level morphological characteristics. The second objective will explore the performances of broad bands simulated according to a number of space-borne sensors. Successful findings from this specific assessment will have great potential in tracking the dynamics of these undesirable plants and consequently improve the efficiency of managing them.
Methods
Study area and target plant species
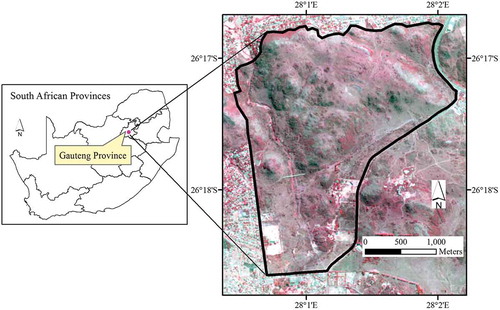
The study was conducted in the Klipriviersberg Nature Reserve in Johannesburg, South Africa (). The reserve covers an area of approximately 680 ha, making it the largest reserve in the City of Johannesburg. It is located in the Klipriviersberg area which is in transition between grassland and savanna biomes (Kotze Citation2002). Long-term (Year 1904–2017) mean daily temperature varied between 13.6°C and 27.1°C in summer and between −2.3°C and 18.1°C in winter (SAWS Citation2017). Average rainfall in the reserve and surrounding areas from the year 1900 to 2017 is approximately 650 mm per annum with the majority (85%) falling in the months of October–March (SAWS Citation2017). Vegetation types of the reserve are classified as Andesite Mountain Bushveld and a section of Tsakane Clay Grassland at the flatter southern end (Cousins, Faiola, and Vermaak Citation2014). The reserve holds a relatively rich biodiversity of approximately 650 indigenous plant species, 215 bird species, 16 reptile species, and 32 butterfly species.
Figure 1. Map showing the Klipriviersberg Nature Reserve in Johannesburg, where field spectroradiameter data was collected from the S. plumosum, A. afra Jacq, and A. laricinus plant species. Background picture is a false-color composite SPOT imagery.
The reserve is designated as conservation area for protection of the fast dwindling Grassland Biome. However, it is currently threatened by more than 20 invasive species with a varying degree of encroachment. Three of these species identified for immediate management intervention and considered in the current study include Artemisia afra, Asparagus laricinus, and Seriphium plumosum. A. afra Jacq Ex Willd. (Asteraceae), which is also known as the African wormwood, is a multi-stemmed perennial clump-forming shrub with fluffy silver-gray foliage that grows to a height of up to 1.5 m (Burits, Asres, and Bucar Citation2001). Individuals of the plant measured in the field had foliage width that varied approximately 0.1–0.3 m. The leaves, specifically, are soft-textured with dark green color on the upper and light green on the lower surface (Liu, Van Der Kooy, and Verpoorte Citation2009). Field observations in the reserve revealed that the plant grows mainly in open areas often creating a mosaic with grass species. Asparagus laricinus, commonly known as Bridal creeper, is a scrambling shrub with fine feather-like foliage that generally grows up to a height of 1.5 m while the crown width was generally greater than A. afra ranging roughly between 0.2 and 0.5 m. Most of the distribution of this plant was associated with acacia trees while limited young individuals were observed in open grasslands. Seriphium plumosum, commonly known as bankrupt bush, has 36 species of which 32 are indigenous to South Africa and is a proclaimed encroacher with a characteristic allelopathic effect on cohabitant plant species (Snyman Citation2010; Snyman Citation2012). It is a perennial woody shrub that has multiple florets fused together to give its characteristic single flower appearance with grayish tufted leaves. The plant is generally short in size and can grow to a height of about 0.6 m, with sampled individuals having approximate crown widths of 0.1–0.2 m. Although these three plants are indigenous to South Africa and have various benefits such as medicinal values (Liu, Van Der Kooy, and Verpoorte Citation2009) and carbon sequestration (e.g. Mudavanhu et al. Citation2017), their spread is becoming a threat to ecosystem structures and services in the reserve.
Field data
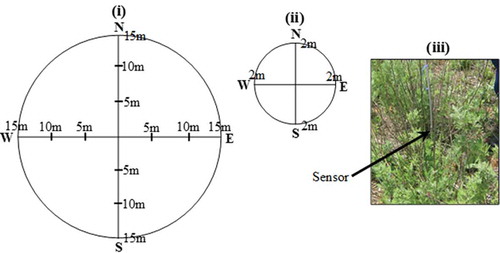
Field surveys were conducted within the summer season between 2 and 14 December 2014. This is the time when all the target plants were observed to have a high vigor in the area, although A. laricinus is an evergreen plant. Exploiting such an opportune time is important for remote-sensing applications to invasive species characterization (Huang and Asner Citation2009). A total of 12 and 15 sample plots, each measuring 15 m radius, were delineated for sampling A. afra and A. laricinus, respectively. This plot size was preferred by taking into consideration the potential extension of the analysis to space-borne remote-sensing techniques. The plot therefore accommodates at least one pixel of Landsat imagery (30 m resolution) and a number of SPOT 5 pixels (1.5–10 m resolutions). The center of each plot was recorded using global positioning system (GPS) and its locational accuracy improved using Google Earth™. A line transect was laid between the center and the periphery of the plot in four cardinal directions. Individual plants of the target species (A. afra or A. laricinus) were taken at 5 m intervals along each transect ()). A similar approach was followed for S. plumosum where 15 sample plots were also surveyed. However, the plot size was reduced to a radius of 2 m due to its limited occurrence; this size was large enough relative to crown width of individuals of the plant (≤0.2 m). A total of five S. plumosum samples located at the four cardinal directions as well as at the center of the plot were taken for spectral reading (ii)). In all cases, the nearest plant was sampled, in an instance where there was no individual plant of the species encountered along the transect line. Despite such an effort to maximize sample size, the total number of samples was less than what was expected of the sampling design.
Figure 2. A layout of sampling design for (i) A. afra and A. laricinus, (ii) S. plumosum, and (iii) an illustration of scanning over a foliage of a sample.
Spectral measurements were collected using a Spectral Evolution® PSR-3500 Remote Sensing Portable Spectroradiometer (Spectral Evolution Inc., Lawrence, MA, USA). The spectrometer records electromagnetic radiation between 340 nm and 2503 nm at a nominal spectral resolution of 3 nm between 350 and 1000 nm, 8 nm @ 1500 nm, and 6 nm @ 2100 nm. The nominal spectral interval of the instrument was 1.5 nm in the range 350–1000 nm, 3.8 nm @ 1500 nm, and 2.5 nm @ 2100 nm, resulting in 1024 spectral bands. Three spectral measurements were taken from each sample, in addition to 25 internal scans specified per reading. These measurements were taken from different canopy parts of the plant using a fiber optic of 25° field of view at approximately 10 cm height at nadir. These specifications are equivalent to an approximately 5 cm diameter coverage at the target; this coverage was small enough to include features within the canopy of a target plant only and large enough to accommodate multiple plant components (as opposed to being dominated by a single leaf). All measurements were taken under sunny conditions between 9:00 A.M. and 2:00 P.M. local time. Such conditions are best achieved at local noon time. This position permits attaining most of the reflected electromagnetic radiation (Cho et al. Citation2008; Olsson, Van Leeuwen, and Marsh Citation2011; Fernandes et al. Citation2013; Lehmann et al. Citation2015). A white reference panel made of polytetrafluoroethylene with high diffuse reflectance was used to calibrate reflectance readings taken from target plants. The calibration was done as frequently as possible (after ~20 readings) in order to maintain homogenous spectral readings.
Data preparation
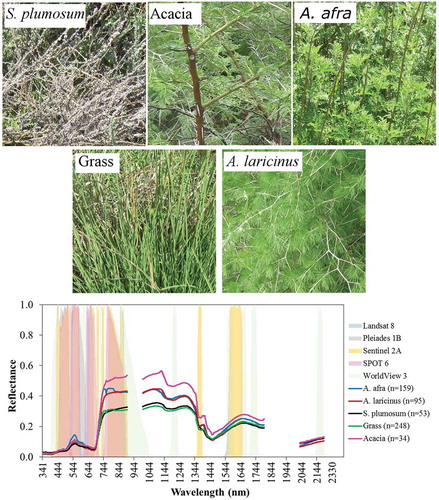
The spectral data were first inspected graphically to identify regions with noisy reflectance. A conservative approach was adopted in this regard to ascertain that only reflectance with high signal-to-noise ratio were used in data analysis. Accordingly, reflectance in the wavelength ranges of 900.1–1000.2 nm (n = 112), 1800.2–2030.4 nm (n = 95), and 2202.7–2503.4 nm (n = 129) were excluded from the data, resulting in a total of 688 usable bands ranging between 340.6 and 2200.1 nm. illustrates sample pictures of each vegetation type taken in the field and mean reflectance per vegetation type post noise removal. The number of samples for each vegetation type is given in brackets in the spectral plots of the figure. The relatively small number of samples for acacia was a clear limitation of the study that emanated from the fact that the minimum number of cohabiting samples was not predetermined.
Figure 3. Examples of target species (A. afra, A. laricinus, and S. plumosum) and co-existent plants that were considered during the field spectroradiameter data acquisition in the Klipriviersberg Nature Reserve of Johannesburg. The spectral curves represent mean reflectance of each plant type with the numbers in brackets showing sample size per plant type considered in the study. Shades of different colors and varying between reflectance values of 0–1 illustrate band passes of the multispectral images. Note that overlaps of certain bands among the images resulted in colors that could not be reflected in the legend.
The noise-free spectra were then used in the classification of the five vegetation types considered in the study; this spectral data set is termed hereafter hyperspectral data, due to the large number of narrow-width bands (n = 688). Such a large number of predictors is often associated with high dimensionality and redundant information that can be screened through variable importance selection (Liu et al. Citation2011). Accordingly, bands that contributed most to the classifications were used as predictors in both support vector machine (SVM) and gradient boosting modeling (GBM) classifiers (discussions on the classifiers are presented in data analysis section). Selection of the bands followed variable importance ranking in both SVM and GBM classifiers. Ranking in GBM involves quantifying the number of times a variable is used for classifying weighted by the improvement on the classification. The average weighted improvement is then used to rank variable importance (Friedman and Meulman Citation2003). SVM ranks the importance of each variable (band) by creating a Receiver Operating Characteristic curve and quantifying the Area Under the Curve score (Huang and Ling Citation2005).
In addition, the spectral reflectance were resampled to simulate bands of five multispectral images (Landsat 8, Pleiades 1B, Sentinel 2A, SPOT 6, and WorldView-3) in ENVI 5.3 (Exelis Visual Information Solutions, Boulder, Colorado). The resampling method utilized filter functions of the images built in the software. Simulating these images was restricted to wavelengths that were deemed usable (n = 688) in this study. Band passes of these images are plotted in , which shows that only WorldView-3 has a band within the 900–1000 nm region that was found to be noisy and excluded from the hyperspectral data used in the study.
Data analysis
Initially, three commonly used non-parametric supervised classifiers, including Random Forest (Breiman Citation1996), SVM (Boser, Guyon, and Vapnik Citation1992), and boosted trees classification (Friedman Citation2001) were explored for suitability to the data. Random Forest returned a significantly poorer accuracy using a test data set referred to as out-of-bag (OOB) data. OOB, which represents approximately a third of the entire data set, is created internally to evaluate the accuracy of the model trained with in-bag (two-thirds of the data) data set (Breiman Citation1996). In this study, leave-one-out-cross-validation (LOOCV) was preferred due to sample size that was deemed insufficient for certain classes. Accuracy assessment using out-of-bag data drawn from unbalanced population sizes might lead to bias and therefore is not recommended (Lawrence, Wood, and Sheley Citation2006). Further analysis therefore utilized boosted trees classification and SVM algorithms within r statistical package (Kuhn et al. Citation2017). Specifically, the generalized stochastic GBM for r (Ridgeway Citation2017) was implemented for the first approach. Boosting uses an ensemble of binary classification trees to assign spectral data (predictor) to a class (dependent variable) (Friedman Citation2001). The method first builds a standard classification tree from a random subset of samples; successive trees are then built by giving more weight to classes that had more error in the preceding classification. By emphasizing classifications with higher error more, the approach ultimately builds a strong classifier from weak classifiers.
The classification requires setting three parameters: the number of classifiers (trees), learning rate, and the number of nodes that will be used to produce the final classes. The optimal number of trees that returned minimum classification error was searched by running a three-fold cross validation analysis and capped at 3000 trees to avoid overfitting. The number of terminal nodes, which refers to the number of splits per tree, was specified at three; that is, a training sample (parent node) was partitioned into two child nodes at each step. A relatively small number of nodes (i.e., small-sized trees also called stumps) are preferred to avoid the problem of overfitting (Lawrence et al. Citation2004). The learning rate refers to the level of error reduction with the addition of each tree during the training phase. For a given number of trees, the higher this rate is the more quickly the prediction error is attained; however, this is at the expense of model stability. A low (slow) learning rate is recommended to avoid overfitting, though overfitting in this study was also addressed by identifying the optimal number of trees (Elith, Leathwick, and Hastie Citation2008). A learning rate of 0.01 was applied in this study.
SVM classifies features (reflectance values at different wavelengths in this case) according to known classes by constructing hyperplanes/boundaries between nearest points in different classes (Boser, Guyon, and Vapnik Citation1992). Unlike other classifiers that seek to minimize the classification error in all points, SVM searches hyperplanes that maximize the separation between classes. Modeling using this classifier has evolved from a simple delineation of straight-line (linear) boundary to nonlinear boundaries that are suitable to commonly encountered data structures. A nonlinear SVM that utilizes radial basis function kernel (Boser, Guyon, and Vapnik Citation1992; Cortes and Vapnik Citation1995) and customized for r (Karatzoglou et al. Citation2004) was applied in this study, since this method can accommodate both linear and nonlinear relationships between a class and a predictor (Keerthi and Lin Citation2003). The classifier requires specifying two parameters to balance the accuracy and reliability of classification: the cost factor (C) and gamma (γ) (Cortes and Vapnik Citation1995). The C factor relates to the penalty (cost) of misclassification error, while γ determines the influence of a training sample thus the ability to capture the complexity in the data. Both the C and γ were determined by running a three-fold cross validation method, similar to the approach that was used in optimizing boosted classification parameters. Optimization comparability between the two classifiers (GBM and SVM) was also enforced by using the same samples for cross-validation. The optimal parameters were then applied to train the classification.
Classification accuracy is commonly quantified by partitioning the data into training and testing sets, both of which should ideally have a relatively sufficient number of samples to enhance reliability. The sample sizes for acacia (n = 34) and S. plumosum (n = 53) were rather small and thus partitioning into two sets was considered inappropriate. Therefore, LOOCV was used for both classifiers in this study using the classification and regression training (caret) package for r (Kuhn et al. Citation2017). This method trains a classification model by using n-1 samples (n = all samples) and evaluate the model’s performance on the hold out sample. This process continues until all samples are used; subsequently, an average performance is computed. LOOCV is preferred because it ensures contribution from each sample, compared to other k-fold (k > 1) cross validation approaches that generalize contributions from k samples. Overall, producer’s, and user’s accuracies as well as kappa statistic obtained from the error matrices were used to evaluate classifications produced from hyperspectral and simulated multispectral data. In addition, kappa statistic was used to see the level of classification being a random occurrence.
Results
Classification using hyperspectral spectra
Classification accuracies obtained for both SVM and GBM classifiers using all hyperspectral and most important variables are presented in . Overall accuracies and kappa coefficient were comparable for the two classifiers, though slightly better for SVM. Producer’s accuracies were generally high in both classifiers exceeding 90% with the exception of a lower accuracy for Acacia in the case of GBM (85%). In contrast, both classifiers achieved comparably high user’s accuracy for all plants.
Table 1. Classification accuracy of five plant types derived using all (n = 688) and most important hyperspectral bands as predictors.
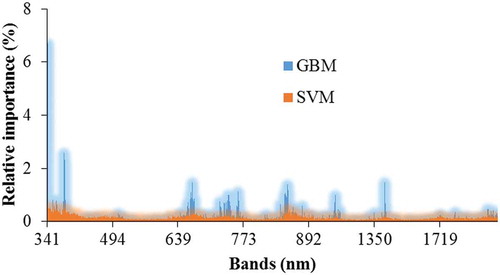
plots the relative importance of all hyperspectral bands considered in the classifications. It was decided to limit the selection to a few spectral bands spread across the visible to shortwave infrared regions of the electromagnetic radiation. The selection identified 17 wavelengths for SVM (340.2, 353.2, 364.1, 379.7, 387.5, 404.5, 474.6, 637.5, 654.2, 670.8, 685.8, 743.1, 855.8, 867.4, 883.4, 1722.5, and 2161.9 nm) and 13 wavelengths for GBM (342.2, 379.2, 381.3, 665.2, 668, 743.1, 761.2, 848.8, 850.0, 854.7, 855.8, 1118.5, and 1407.1 nm). These variables represent 7% and 23% of the importance for SVM and GBM, respectively. It is evident from the plots that these bands fall within regions that generally have high importance for the classifications. Moreover, there was strong similarity in terms of important regions between the two classifiers, although several bands were identified to have significantly higher importance than others using the GBM approach.
Figure 4. Relative importance of hyperspectral bands in classifying the five plant types using GBM and SVM methods.
Overall accuracy and kappa decreased marginally using SVM and the important variables; the decrease however was considerable when GBM was used (). The class that had the worst producer’s accuracy was acacia followed by A. laricinus while grass had the worst user’s accuracy. It is worth noting the sources of class confusions produced by using selected important bands. Most of the losses in the producer’s accuracies were due to samples being misclassified to grass ().
Table 2. Confusion matrix of five plant types derived using most important hyperspectral bands (n = 17 for SVM and n = 13 for GBM) as predictors.
Simulation of multispectral data
Classification accuracies using simulated multispectral bands are presented in . Simulation according to WorldView-3 yielded the best overall accuracies and kappa coefficients, followed by Sentinel 2A and Landsat 8 simulations. Comparison of these statistics between the two classifiers shows better results for SVM with the largest difference in overall accuracy observed for WorldView-3 simulation. Class-level accuracy shows mixed comparisons between the two classifiers. For example, the difference in producer’s accuracy of A. afra classified using SVM and GBM was low particularly for Landsat 8, SPOT 6, and Pleiades 1B. In contrast, producer’s accuracies of A. laricinus and acacia differed greatly between the two classifiers while they had much less differences in user’s accuracies.
Table 3. Classification accuracy of five plant types derived using simulated multispectral bands as predictors.
In most simulations, A. afra had the best producer’s accuracy of the three invasive plants while S. plumosum had the best user’s accuracy (). Another notable observation from the classifications using both methods was the very low producer’s accuracies of SPOT 6 and Pleiades 1B simulations, while the user’s accuracies in both cases were high. presents a confusion matrix for classifications based on Sentinel 2A, SPOT 6, and WorldView-3 simulations to show the sources of misclassifications; Landsat 8 and Pleiades are not included due to similar results with Sentinel 2A and SPOT 6, respectively. Most of the confusion of the target species using Sentinel 2A and WorldView-3 simulations was due to misclassification with grass. Low producer’s accuracy for A. laricinus using SPOT 6 simulation was due to misclassifications with A. afra and grass. It is important to note the sources of misclassification in grass and acacia (considered native plants in the reserve), particularly if the confusions are with the target invasive plants. Grasses were missed (loss in producer’s accuracy) due mainly to confusion with A. afra and to a less extent with A. laricinus in both classifiers and for the three simulations. On the other hand, large numbers of samples from the three target species were wrongly committed to grass, except in the case of WorldView-3 simulations. Acacia was misclassified mostly with A. laricunus (compared to the other target species) although the misclassifications were fairly low.
Table 4. Confusion matrix of five plant types derived using simulated multispectral bands as predictors.
Variable importance was computed for each simulation in an attempt to see the general trend in terms of wavelength size importance (). In general, classification using GBM was influenced highly by long wavelength radiations while contributions by all bands were comparable in SVM classifier. According to the GBM classifier, the top five or six band simulations of Sentinel 2A and WorldView-3 images consist of red and near-infrared bands with those in Sentinel 2A contributing to 75% and WorldView-3 to 64%. These contributions are comparable to the one obtained using the same bands of Landsat 8 (71%), but inferior to results obtained using SPOT 6 (86%) and Pleiades 1B (92%). Contribution by the NIR band alone in each of Sentinel 2A and SPOT 6 simulations was less than 30%, significantly lower than the contributions of the same band by Landsat 8, SPOT 6, and Pleiades 1B simulations. This is the result of decomposition of the red or near-infrared bands to add separate red edge bands in Sentinel 2A and WorldView-3.
Figure 5. Relative importance of simulated multispectral bands in classifying the five plant types using GBM and SVM methods.
Discussion
Performances of hyperspectral and simulated multispectral data
This study sought to investigate the potential of remote sensing in classifying vegetation species that have relatively similar morphological characteristics. Such similarity is perceived to pose a major challenge to foliage spectral separability of species due to the similarity in leaf structure. Furthermore, the background reflectance in such structurally similar species is somewhat comparable. The producer’s and user’s accuracies of detecting the target species (A. afra, A. laricinus, and S. plumosum) using raw hyperspectral data (688 bands) were generally high. Classification using the most important variables selected yielded slightly lower accuracies for SVM and GBM classifiers, particularly for the three target species, albeit these accuracies are still high. The kappa statistics for classification using all bands and selected bands were quite high (), and support the fact that classification accuracy of each target species was not random. The results are in agreement with the findings by Taylor, Hill, and Edwards (Citation2013), who used field-based hyperspectral data and logistic regression to discriminate rhododendron from cohabitant plants. However, the plants used in their study have long and broad leaves that are capable of minimizing background reflectance, compared to the plants used in our study. On the other hand, our results were more positive than those by Martin et al. (Citation2011) who reported unsatisfactory spectral separability between wheat and barley groups versus grass weeds, all of which belonged to the same biological family and thus showing strong morphological resemblance. Furthermore, the crops and weeds were planted at the same time, resulting in comparable fractional covers.
Simulations according to spectral bands of Worldview-3, Sentinel 2A, and Landsat 8 images returned promising results, while spectra simulated to SPOT and Pleiades bands had low accuracies (). The difference in accuracy between the two groups is attributable to the number of bands that each has. Landsat, Sentinel 2A, and WorldView-3 have 6, 12, and 13 bands, respectively; these bands included visible, near-infrared, and shortwave infrared regions of the electromagnetic radiation. In contrast, Pleiades 1B and SPOT 6 images have only one near-infrared band, in addition to the visible bands. Longer wavelength bands are generally good for discriminating plant species (e.g. Martin et al. Citation2011; Fletcher and Reddy Citation2016). This was confirmed by variable importance analysis (), in which GBM in particular identified longer bands as more important than others were. Band comparison using the SVM classifier on the other hand indicated similarities between bands, although longer bands had marginally greater importance. Variable importance differences between the two classifiers agree with results obtained from classifications using narrow bands ().
In general, classification accuracies using both raw hyperspectral data and data simulated according to multispectral bands of space-borne images were satisfactory. The producer’s accuracies of the three invasive plants were generally high, except for SPOT 6 and Pleiades 1B that returned very low producer’s accuracies (). It is important to achieve a high producer’s accuracy, since it shows a low omission error and thus the capability to identify most of the target species with acceptable level of success. The user’s accuracies were generally high in all instances. It should be noted that commission errors quantified in user’s accuracies may not necessarily signal a problem from an ecological conservation point of view. This error is introduced when plants from other species are classified into a class of interest; these plants can be verified through field survey and consequently eliminated from the class. Committing a target species to an area should, therefore, be considered a “no-regret” mistake for ecological management, while on the contrary a very low omission of such species must be envisaged in classifications.
The accuracies observed in this study should also be appreciated in light of morphological characteristics of the plants. All the plants had narrow leaves resulting in varying degree of foliage openness per individual plant; spectral readings taken from such a plant is likely contaminated by background reflectance. Another noteworthy morphological characteristic in this study’s data was the similarity in size of particularly grasses and the invasive A. afra and S. plumosum due to clearance of the invasive plants routinely. Such equal growth stage is likely to contribute to spectral similarity (Martin et al. Citation2011). Despite these morphological similarities, the accuracies obtained in this study are regarded very promising.
Potential for space-borne remote sensing
It should be acknowledged that simulation of remotely sensed data using ground-based spectroscopy does not mimic space-borne (or air-borne) systems accurately due to a great deal of atmospheric interference in the latter case (Taylor, Hill, and Edwards Citation2013). The sampling design used in this study attempted to best inform the potential of space-borne remote sensing for identifying invasive plants of interest in the study area. The sampling was done in the field, instead of in the laboratory, primarily to simulate the natural illumination scenarios that are encountered with space-borne remote sensing. Although all attempts were made to scan samples under clear sky conditions, there were instances when this could not be achieved. The difficulty of attaining the ideal atmospheric conditions in the study simulated to a certain degree what is commonly observed in space-borne remote sensing. Despite these circumstances, the accuracies obtained using simulated data were very encouraging.
The high accuracies achieved by simulating Landsat and Sentinel were vital considering the availability of the images at no cost and the long-term operation plan promised by their custodians. Research has demonstrated the role of Landsat data for time-series analysis of invasive plants (e.g. Diao and Wang Citation2016). It is therefore important to investigate the accuracy of classifying the target species using actual data from these images as well as the others, if they are available. Spatial factors must however be taken into consideration when applying imagery for mapping purpose (Huang and Asner Citation2009). Landsat (15–30 m) and Sentinel (10–60 m) have coarse spatial resolutions compared to the current distribution patterns of the invasive plants in the study area, although the most important variables particularly red and NIR bands () have higher spatial resolutions (10 or 15 m) and thus a better chance to be applied in the study area. Even with such spatial resolution, however, it is unlikely that these images can be used successfully for mapping S. plumosum, which currently occurs in the reserve as individual plants scattered predominantly among grasses. Another alternative is treating a pixel of these images as a mixture of two or more species that should be decomposed (unmixed) using spectral mixture analysis. Spectral unmixing of pixels was used to detect invasive Hyptis suaveolens (L.) Poit in Earth Observation 1 (EO-1) Advanced Land Manager (ALI) image (Padalia, Kudrat, and Sharma Citation2013), and bamboo and slash pine plants on ProSpecTIR-VS hyperspectral data (Amaral et al. Citation2015).
On the other hand, the increasing encroachment of A. afra and A. laricinus onto different land cover types such as grass and woody plants makes the applicability of Landsat and Sentinel images plausible. In comparison, WorldView-3 has the best potential with its superior spatial and spectral characteristics; however, its availability or affordability must be taken into consideration. Although simulations according to SPOT bands did not yield the best result, exploring the utility of this imagery using actual data is encouraged for two main reasons. First, a constellation of SPOT 6 and 7 satellites has a high temporal resolution (a revisit time of 3 days or less) that allows for short-term dynamics of plant invasions. This functionality is ideal to model the currently undetermined expansion rates of the invasive plants considered in this study. Second, SPOT 6/7 constellation produces high spatial resolution imagery (up to 1.5 m) that has the potential to discriminate species using a combination of spectral and structural properties.
Conclusion
This study sought to investigate the performance of spectroradiometer data in discriminating narrow-leaved invasive plants (A. afra, A. laricinus, and S. plumosum) from each other, and from morphologically similar cohabitant plants using narrow wavelength hyperspectral bands and broad bands simulated according to Landsat 8, Sentinel 2A, Pleiades 1B, SPOT 6, and WorldView-3. The findings were generally satisfactory, indicating the potential of applying the approaches in identifying invasive plants of interest. Although the results suggest a great potential for space-borne remote sensing, translation into practice must follow more investigations using actual data obtained from space-borne platforms. It is also important that future works on the utility of remote sensing to detection of the invasive species factor in growth characteristics such as phenology and seasonality of the species that can influence spectral separability (Mirik et al. Citation2013; Diao and Wang Citation2016). A successful detection of the invasive plants at young growth stages informs early mitigation actions. Similarly, the ideal season for applying remote sensing would be one when there is maximum spectral separability among the species and at the period before the occurrence of dispersal of the species.
Acknowledgment
This study was funded by the University of Johannesburg. We are also grateful for all the assistance we received from Mr. Bishop Ngobeni, the manager of the Klipriviersburg Nature Reserve, and Bongeka Wendy Mbatha and Minenhle Gumede who assisted us during the entire field survey. We would like to thank four anonymous reviewers whose constructive and critical comments improved the quality of the paper.
Disclosure statement
No potential conflict of interest was reported by the authors.
Additional information
Funding
References
- Adam, E., N. Mureriwa, and S. Newete. 2017. “Mapping Prosopis Glandulosa (Mesquite) in the Semi-Arid Environment of South Africa Using High-Resolution WorldView-2 Imagery and Machine Learning Classifiers.” Journal of Arid Environments 145: 43–51. doi:10.1016/j.jaridenv.2017.05.001.
- Amaral, C. H., D. A. Roberts, T. I. R. Almeida, and C. R. S. Filho. 2015. “Mapping Invasive Species and Spectral Mixture Relationships with Neotropical Woody Formations in South Eastern Brazil.” ISPRS Journal of Photogrammetry and Remote Sensing 108: 80–93. doi:10.1016/j.isprsjprs.2015.06.009.
- Aneece, I., and H. Epstein. 2017. “Identifying Invasive Plant Species Using Field Spectroscopy in the VNIR Region in Successional Systems of North-Central Virginia.” International Journal of Remote Sensing 38: 100–122. doi:10.1080/01431161.2016.1259682.
- Atkinson, J. T., R. Ismail, and M. Robertson. 2014. “Mapping Bugweed (Solanum Mauritianum) Infestations in Pinus Patula Plantations Using Hyperspectral Imagery and Support Vector Machines.” IEEE Journal of Selected Topics in Applied Earth Observations and Remote Sensing 7: 17–28. doi:10.1109/JSTARS.2013.2257988.
- Boser, B. E., I. M. Guyon, and V. N. Vapnik. 1992. “A Training Algorithm for Optimal Margin Classifiers.” In Proceedings of the Fifth Annual Workshop on Computational Learning Theory – COLT ‘92, New York, USA: ACM Press, pp. 144-152. ISBN 089791497X. doi:10.1145/130385.130401
- Breiman, L. 1996. “Bagging Predictors.” Machine Learning 24: 123–140. doi:10.1007/BF00058655.
- Burits, M., K. Asres, and F. Bucar. 2001. “The Antioxidant Activity of the Essential Oils of Artemisia Afra, Artemisia Abyssinica and Juniperus Procera.” Phytotherapy Research 15: 103–108. doi:10.1002/ptr.691.
- Cho, M., I. Sobhan, A. Skidmore, and J. de Leeuw. 2008. “Discriminating Species Using Hyperspectral Indices at Leaf and Canopy Scales.” International Archives of Photogrammetry and Remote Sensing Spatial Information Sciences, Vol XXXVII, pp. 369-376.
- Cortes, C., and V. Vapnik. 1995. “Support-Vector Networks.” Machine Learning 20: 273–297. doi:10.1007/BF00994018.
- Cousins, S., J. Faiola, and V. Vermaak. 2014. “Klipriviersberg: Johannesburg’s Green Jewel of the South.” Veld and Flora 100: 68–71.
- Diao, C., and L. Wang. 2016. “Incorporating Plant Phenological Trajectory in Exotic Saltcedar Detection with Monthly Time Series of Landsat Imagery.” Remote Sensing of Environment 182: 60–71. doi:10.1016/j.rse.2016.04.029.
- Elith, J., J. R. Leathwick, and T. Hastie. 2008. “A Working Guide to Boosted Regression Trees.” Journal of Animal Ecology 77: 802–813. doi:10.1111/j.1365-2656.2008.01390.x.
- Fernandes, M. R., F. C. Aguiar, J. M. N. Silva, M. T. Ferreira, and J. M. C. Pereira. 2013. “Spectral Discrimination of Giant Reed (Arundo Donax L.): A Seasonal Study in Riparian Areas.” ISPRS Journal of Photogrammetry and Remote Sensing 80: 80–90. doi:10.1016/j.isprsjprs.2013.03.007.
- Fletcher, R. S., and K. N. Reddy. 2016. “Random Forest and Leaf Multispectral Reflectance Data to Differentiate Three Soybean Varieties from Two Pigweeds.” Computers and Electronics in Agriculture 128: 199–206. doi:10.1016/j.compag.2016.09.004.
- Friedman, J. H. 2001. “Greedy Function Approximation: A Gradient Boosting Machine.” Annals of Statistics 29: 1189–1232. doi:10.1214/aos/1013203451.
- Friedman, J. H., and J. J. Meulman. 2003. “Multiple Additive Regression Trees with Application in Epidemiology.” Statistics in Medicine 22: 1365–1381. doi:10.1002/(ISSN)1097-0258.
- Ghosh, A., P. K. Joshi, R. D. Garg, and S. Mukherjee. 2013. “Identification of Invasive Plant Species Using Field Spectro-Radiometer and Simulated Hyperion Spectra – A Rapid Mapping of Invasiveness.” Current Science 104: 1148–1151.
- Hardin, P. J., M. W. Jackson, V. J. Anderson, and R. Johnson. 2007. “Detecting Squarrose Knapweed (Centaurea Virgata Lam. Ssp. Squarrosa Gugl.) Using A Remotely Piloted Vehicle: A Utah Case Study.” GIScience and Remote Sensing 44: 203–219. doi:10.2747/1548-1603.44.3.203.
- Hestir, E. L., S. Khanna, M. E. Andrew, M. J. Santos, J. H. Viers, J. A. Greenberg, S. S. Rajapakse, and S. L. Ustin. 2008. “Identification of Invasive Vegetation Using Hyperspectral Remote Sensing in the California Delta Ecosystem.” Remote Sensing of Environment 112: 4034–4047. doi:10.1016/j.rse.2008.01.022.
- Huang, C., and G. P. Asner. 2009. “Applications of Remote Sensing to Alien Invasive Plant Studies.” Sensors 9: 4869–4889. doi:10.3390/s90604869.
- Huang, J., and C. X. Ling. 2005. “Using AUC and Accuracy in Evaluating Learning Algorithms.” IEEE Transactions on Knowledge and Data Engineering 17: 299–310. doi:10.1109/TKDE.2005.50.
- Karatzoglou, A., A. Smola, K. Hornik, and A. Zeileis. 2004. “Kernlab – An S4 Package for Kernel Methods in R.” Journal of Statistical Software 11: 1–20. doi:10.18637/jss.v011.i09.
- Keerthi, S. S., and C.-J. Lin. 2003. “Asymptotic Behaviours of Support Vector Machines with Gaussian Kernel.” Neural Computation 15: 1667–1689. doi:10.1162/089976603321891855.
- Kganyago, M., J. Odindi, C. Adjorlolo, and P. Mhangara. 2017. “Selecting A Subset of Spectral Bands for Mapping Invasive Alien Plants: A Case of Discriminating Parthenium Hysterophorus Using Field Spectroscopy Data.” International Journal of Remote Sensing 38: 5608–5625. doi:10.1080/01431161.2017.1343510.
- Kotze, P. J. 2002. The Ecological Integrity of the Klip River and the Development of a Sensitivity Weighted Fish Index of Biotic Integrity (SIBI). South Africa: University of Johannesburg.
- Kuhn, M., J. Wing, S. Weston, A. Williams, C. Keefer, A. Engelhardt, T. Cooper, et al. 2017. “Caret: Classification and Regression Training.” R package version 6.0-76. https://CRAN.R-project.org/package=caret.
- Lawrence, R., A. Bunn, S. Powell, and M. Zambon. 2004. “Classification of Remotely Sensed Imagery Using Stochastic Gradient Boosting as a Refinement of Classification Tree Analysis.” Remote Sensing of Environment 90: 331–336. doi:10.1016/j.rse.2004.01.007.
- Lawrence, R. L., S. D. Wood, and R. L. Sheley. 2006. “Mapping Invasive Plants Using Hyperspectral Imagery and Breiman Cutler Classifications (Randomforest).” Remote Sensing of Environment 100: 356–362. doi:10.1016/j.rse.2005.10.014.
- Lehmann, J. R. K., A. Große-Stoltenberg, M. Römer, and J. Oldeland. 2015. “Field Spectroscopy in the VNIR-SWIR Region to Discriminate between Mediterranean Native Plants and Exotic-Invasive Shrubs Based on Leaf Tannin Content.” Remote Sensing 7: 1225–1241. doi:10.3390/rs70201225.
- Liu, N. Q., F. Van der Kooy, and R. Verpoorte. 2009. “Artemisia Afra: A Potential Flagship for African Medicinal Plants?” South African Journal of Botany 75: 185–195. doi:10.1016/j.sajb.2008.11.001.
- Liu, Q., C. Chen, Y. Zhang, and Z. Hu. 2011. “Feature Selection for Support Vector Machines with RBF Kernel.” Artificial Intelligence Review 36: 99–115. doi:10.1007/s10462-011-9205-2.
- Mack, R. N., D. Simberloff, and W. M. Lonsdale. 2000. “Biotic Invasions: Causes, Epidemiology, Global Consequences, and Control.” Ecological Applications 10: 689–710. doi:10.1890/1051-0761(2000)010[0689:BICEGC]2.0.CO;2.
- Mafanya, M., P. Tsele, J. Botai, P. Manyama, B. Swart, and T. Monate. 2017. “Evaluating Pixel and Object Based Image Classification Techniques for Mapping Plant Invasions from UAV Derived Aerial Imagery: Harrisia Pomanensis as a Case Study.” ISPRS Journal of Photogrammetry and Remote Sensing 129: 1–11. doi:10.1016/j.isprsjprs.2017.04.009.
- Martin, M. P., L. Barreto, D. Rianõ, C. Fernandez-Quintanilla, and P. Vaughan. 2011. “Assessing the Potential of Hyperspectral Remote Sensing for the Discrimination of Grassweeds in Winter Cereal Crops.” International Journal of Remote Sensing 32: 49–67. doi:10.1080/01431160903439874.
- Meng, R., P. E. Dennison, L. R. Jamison, C. van Riper, P. Nager, K. R. Hultine, D. W. Bean, and T. Dudley. 2012. “Detection of Tamarisk Defoliation by the Northern Tamarisk Beetle Based on Multitemporal Landsat 5 Thematic Mapper Imagery.” GIScience and Remote Sensing 49: 510–537. doi:10.2747/1548-1603.49.4.510.
- Michez, A., H. Piégay, L. Jonathan, H. Claessens, and P. Lejeune. 2016. “Mapping of Riparian Invasive Species with Supervised Classification of Unmanned Aerial System (UAS) Imagery.” International Journal of Applied Earth Observation and Geoinformation 44: 88–94. doi:10.1016/j.jag.2015.06.014.
- Mirik, M., R. J. Ansley, K. Steddom, D. C. Jones, C. M. Rush, G. J. Michels Jr., and N. C. Elliott. 2013. “Remote Distinction of a Noxious Weed (Musk Thistle: Carduus Nutans) Using Airborne Hyperspectral Imagery and the Support Vector Machine Classifier.” Remote Sensing 5: 612–630. doi:10.3390/rs5020612.
- Mudavanhu, S., J. Blignaut, N. Stegmann, G. Barnes, W. Prinsloo, and A. Tuckett. 2017. “The Economic Value of Ecosystem Goods and Services: The Case of Mogale’s Gate Biodiversity Centre, South Africa.” Ecosystem Services 26: 127–136. doi:10.1016/j.ecoser.2017.06.005.
- Olsson, A. D., W. J. D. Van Leeuwen, and S. E. Marsh. 2011. “Feasibility of Invasive Grass Detection in a Desert Scrub Community Using Hyperspectral Field Measurements and Landsat TM Imagery.” Remote Sensing 3: 2283–2304. doi:10.3390/rs3102283.
- Padalia, H., M. Kudrat, and K. P. Sharma. 2013. “Mapping Sub-Pixel Occurrence of an Alien Invasive Hyptis Suaveolens (L.) Poit. Using Spectral Unmixing Technique.” International Journal of Remote Sensing 34: 325–340. doi:10.1080/01431161.2012.714003.
- Pantazi, X.-E., D. Moshou, and C. Bravo. 2016. “Active Learning System for Weed Species Recognition Based on Hyperspectral Sensing.” Biosystems Engineering 146: 193–202. doi:10.1016/j.biosystemseng.2016.01.014.
- Peerbhay, K., O. Mutanga, R. Lottering, V. Bangamwabo, and R. Ismail. 2016. “Detecting Bugweed (Solanum Mauritianum) Abundance in Plantation Forestry Using Multisource Remote Sensing.” ISPRS Journal of Photogrammetry and Remote Sensing 121: 167–176. doi:10.1016/j.isprsjprs.2016.09.014.
- Perroy, R. L., T. Sullivan, and N. Stephenson. 2017. “Assessing the Impacts of Canopy Openness and Flight Parameters on Detecting a Sub-Canopy Tropical Invasive Plant Using a Small Unmanned Aerial System.” ISPRS Journal of Photogrammetry and Remote Sensing 125: 174–183. doi:10.1016/j.isprsjprs.2017.01.018.
- Pu, R., and S. Bell. 2017. “Mapping Seagrass Coverage and Spatial Patterns with High Spatial Resolution IKONOS Imagery.” International Journal of Applied Earth Observation and Geoinformation 54: 145–158. doi:10.1016/j.jag.2016.09.011.
- Richardson, D. M., and B. W. van Wilgen. 2004. “Invasive Alien Plants in South Africa: How Well Do We Understand the Ecological Impacts?” South African Journal of Science 100: 45–52.
- Ridgeway, G. with contributions from others. 2017. “Gbm: Generalized Boosted Regression Models.” R package version 2.1.3. https://CRAN.R-project.org/package=gbm.
- Robinson, T. P., G. W. Wardell-Johnson, G. Pracilio, C. Brown, and R. D. Van Klinken. 2016. “Testing the Discrimination and Detection Limits of WorldView-2 Imagery on a Challenging Invasive Plant Target.” International Journal of Applied Earth Observation and Geoinformation 44: 23–30. doi:10.1016/j.jag.2015.07.004.
- Rocchini, D., D. S. Boyd, J.-B. Féret, G. M. Foody, K. S. He, A. Lausch, H. Nagendra, M. Wegmann, and N. Pettorelli. 2015. “Satellite Remote Sensing to Monitor Species Diversity: Potential and Pitfalls.” Remote Sensing in Ecology and Conservation 25–36. doi:10.1002/rse2.9.
- SAWS. 2017. South African Weather Service. South Africa's Meteorological and Climatological Data - Digital Forma: Pretoria, South Africa.
- Snyman, H. A. 2010. “Knowledge of Seed Ecology Essential for Seriphium Plumosum Control.” Grassroots: Newsletter of the Grassland Society of Southern Africa 10: 9–14.
- Snyman, H. A. 2012. “Habitat Preferences of the Encroacher Shrub.” Seriphium Plumosum. South African Journal of Botany 81: 34–39. doi:10.1016/j.sajb.2012.05.001.
- Swain, S., S. Narumalani, and D. R. Mishra. 2011. “Monitoring Invasive Species: Detecting Purple Loosestrife and Evaluating Biocontrol along the Niobrara River, Nebraska.” GIScience and Remote Sensing 54: 225–244. doi:10.2747/1548-1603.48.2.225.
- Taylor, S., L. Kumar, N. Reid, and C. R. G. Lewis. 2012. “Optimal Band Selection from Hyperspectral Data for Lantana Camara Discrimination.” International Journal of Remote Sensing 33: 5418–5437. doi:10.1080/01431161.2012.661093.
- Taylor, S. L., R. A. Hill, and C. Edwards. 2013. “Characterising Invasive Non-Native Rhododendron Ponticum Spectra Signatures with Spectroradiometry in the Laboratory and Field: Potential for Remote Mapping.” ISPRS Journal of Photogrammetry and Remote Sensing 81: 70–81. doi:10.1016/j.isprsjprs.2013.04.003.
- Wallace, C. S. A., P. Thenkabail, J. R. Rodriguez, and M. K. Brown. 2017. “Fallow-Land Algorithm Based on Neighborhood and Temporal Anomalies (FANTA) to Map Planted versus Fallowed Croplands Using MODIS Data to Assist in Drought Studies Leading to Water and Food Security Assessments.” GIScience and Remote Sensing 54: 258–282. doi:10.1080/15481603.2017.1290913.
- Yang, C., and J. H. Everitt. 2010. “Mapping Three Invasive Weeds Using Airborne Hyperspectral Imagery.” Ecological Informatics 5: 429–439. doi:10.1016/j.ecoinf.2010.03.002.