
 ?Mathematical formulae have been encoded as MathML and are displayed in this HTML version using MathJax in order to improve their display. Uncheck the box to turn MathJax off. This feature requires Javascript. Click on a formula to zoom.
Abstract
Classification and regression tree (CART) has been widely implemented to estimate impervious surface, an important indicator of urbanization and environmental quality. Although the CART algorithm gains higher overall accuracy than linear regression models, only very few studies have noticed that reliability of CART is affected by systematic errors. Especially, CART typically overestimates impervious surfaces in low-density urban areas and underestimates them in high-density urban areas. The primary objective of this study is to develop an improved integrated method to estimate impervious surface with higher accuracy by reducing the systematic errors of CART. This improved method was applied to three urban areas, Chicago (United States), Venice (Italy), and Guangzhou (China) to examine its effectiveness. When compared with the conventional CART, overall mean average error (MAE) and root mean square error (RMSE) of improved method are decreased by 22.64% and 20.93%, respectively, and R2 rises from 0.9 to 0.96. In high-density impervious surfaces, where intensely developed urban area is located, the MAE and RMSE for the improved method are 0.066 and 0.088, respectively, largely improved from 0.100 to 0.130. Since accurate estimation of high-density impervious surfaces is the fundamental issue for monitoring and understanding the urban environment, the improved method demonstrated in this study is significant.
Keywords:
Introduction
The world has experienced significant population growth in urban areas since the 1990s when approximately 43% (2.3 billion) of the world’s population lived in urban areas. And this number has grown to 54% (4 billion) in 2015 (UNHabitat Citation2016). Rapid urbanization and urban sprawl bring significant impact to the urban environment (Yang et al. Citation2003b; Sofia et al. Citation2017) and much more attention is paid to understanding and monitoring the compositions and processes in urban areas (Stow and Chen Citation2002; Wu Citation2004; Xiao et al. Citation2006). For studying the heterogeneous urban landscapes, identification/description/quantification of land-use and land-cover compositions, rather than simple hard classification, should be applied (Ridd Citation1995; Mather Citation1999; Weng Citation2012). As a quantifiable land-use indicator that correlates closely with urbanization impacts, the impervious surface has long been considered as an indicator of urbanization and environmental quality (Arnold Jr and Gibbons Citation1996).
Impervious surfaces refer to materials through which water cannot infiltrate. In urban areas, impervious surfaces primarily consist of anthropogenic features such as roads, driveways, sidewalks, parking lots, rooftops, etc. The expansion of impervious surfaces can exert considerable influence on urban environment in many aspects (Weng Citation2001; Yang et al. Citation2003a; Yuan and Bauer Citation2007; Sofia et al. Citation2016; Zhang and Weng Citation2016). Impervious surfaces increase urban runoff (Corbett et al. Citation1997; Dams et al. Citation2013), which aggravates the burden of draining and flood prevention (Sofia et al. Citation2017). Due to the increased runoff, fluvial denudation and basal erosion of river channel are intensified (Weng Citation2012; Prosdocimi et al. Citation2015). Impervious surfaces can also have crucial repercussions on the hydrologic cycle and furthermore result in the decrease of water quality (Meyer and BL Turner Citation1994; Beck et al. Citation2016), especially for non-point source pollution sources including pathogens, nourishing materials, toxic substances, sediment, and so on. As a result, the increase of impervious surfaces altered the environment and biological conditions of watersheds and river systems. Researchers have suggested that the impairment from impervious surfaces becomes remarkable at approximately 10% (Schueler Citation1994). In addition, the expansion of impervious surfaces altered the thermal capacity of an entire city and strengthened urban heat island effects (Mathew et al. Citation2016).
Efficient and accurate estimation of impervious surfaces distribution with remote-sensing techniques is fundamental in impervious surfaces studies (Weng Citation2012). Due to the relatively low cost and suitability for large area mapping, remote-sensing techniques have been widely applied for impervious surface estimation since 2000 (Bauer et al. Citation2004). Some effective approaches, such as imagery transformation (Cablk and Minor Citation2003), post-classification analysis (Dougherty et al. Citation2004), classification decision tree algorithm (Zhang et al. Citation2014), and normalized index extraction (Piyoosh and Ghosh Citation2017), were developed for mapping impervious surface in per-pixel level. However, in urban areas, most pixels in medium resolution imagery are mixed and composed of several land-use types (Yang et al. Citation2003b). To evaluate the proportions of impervious surfaces for each pixel, subpixel methods, including linear spectral mixture analysis (LSMA) and classification and regression tree (CART) are widely employed.
Ridd (Citation1995) suggested that pixels in medium resolution imagery are linearly mixed by impervious surface, vegetation, and soil (V-I-S model) since the land-use and land-cover(LULC) of urban areas can be deemed as a linear combination of them (Ridd Citation1995). Based on the V-I-S model, LSMA is able to estimate impervious surface at the subpixel level with properly selected end-members (pure pixels). LSMA model has been continuously promoted and widely used due to its effectiveness in dealing with spectral mixture problem (Roberts et al. Citation1999; Wu and Murray Citation2003; Weng Citation2012; Huadong et al. Citation2014; Fan et al. Citation2015). Wu (Citation2004) normalized the spectral characteristics of three types of endmembers in the model to overcome the problem associated with the selection of endmembers and within-class spectral variability (Wu Citation2004). Phinn et al. (Citation2002) overlaid the classification results with the LSMA extraction of impervious surfaces and analyzed the abundance of the V-I-S endmembers in different land-use categories at the subpixel level (Phinn et al. Citation2002). Wu and Murray (Citation2003) suggested that the endmember of the impervious surface should be considered and divided into two types (high-albedo and low-albedo) instead of one considering the obvious heterogeneity of spectral characteristics (Wu and Murray Citation2003). Lu and Weng (Citation2006) added land-surface temperatures (LST) data while using four-endmember model (vegetation, high-albedo, low-albedo, and soil) to estimate the impervious surface with ETM imagery (Lu and Weng Citation2006). To address the endmember variability problem, Li and Wu (Citation2016) varied endmember sets spatially by applying kriging interpolation and developed geostatistical temporal mixture analysis technique (Li and Wu Citation2016). With these improvements, LSMA has then been further implemented in different study areas (Li et al. Citation2010; Fan and Deng Citation2014; Scott et al. Citation2014; Zhang, Chen, and Lu 2015; Hao et al. Citation2016). However, some problems can still affect the accuracy of LSMA for the following reasons: (1) the variability of spectral characteristics causes low-albedo impervious surfaces to be confused with water and shadow and high-albedo to be confused with sandy bare soil (Small and Lu Citation2006); (2) misestimation can occur in areas with complex distribute of small or large amounts of impervious surfaces (Weng Citation2012).
For estimating impervious surfaces at subpixel level using CART, a rule-based model repeatedly splits each parent node into two child nodes, treating each child node as a potential parent node for further split (Breiman et al. Citation1984). The rule-based model for predicting continuous variables is recursively produced based on training data. Each rule set defines the conditions under which a multivariate linear regression model is established (Huang and Townshend Citation2003; Yang et al. Citation2003a). Huang and Townshend (Citation2003) largely improved Breiman’s algorithm by introducing a linear regression model instead of a single target variable for each subset (Huang and Townshend Citation2003). Yang et al. (Citation2003a) acquired training data by overlaying impervious surface data extracted from an IKONOS imagery with an ETM+ and TM grid and proposed a CART algorithm to estimate the extent of impervious surfaces at the subpixel level (Yang et al. Citation2003a). Using finer resolution data for calibration/validation and coarser resolution data for predicting impervious surface area at the regional or continental levels, CART has further been implemented by Xian et al. (Citation2005), Xian et al. (Citation2008), Yang et al. (Citation2009), Im et al. (Citation2012), Shao et al. (Citation2015), and Fu et al. (Citation2016) to develop impervious surface estimation model based on multispectral imagery or Synthetic-aperture radar(SAR) data (Xian and Crane Citation2005; Xian, Crane, and McMahon Citation2008; Yang et al. Citation2009; Im et al. Citation2012; Shao et al. Citation2015; Fu et al. Citation2016). Being able to estimate the non-linear relationship between independent and target variables, the regression tree model is considered to have better accuracy and predictability than that of the linear regression model (Yang et al. Citation2003a). However, despite all the advantages of CART, it is still worth mentioning that the results of the model are affected by some systematic errors. Substantially, underestimation of high-density impervious surfaces and overestimation of low-density impervious surface evidently appeared in many CART research (Yang et al. Citation2003b; Jiang et al. Citation2008, Citation2009; Gao et al. Citation2009; Im et al. Citation2012; She and Li Citation2013; Shao et al. Citation2015). Although some efforts were made to improve the performance of CART, such as Random Forests, which adopts a series of different CART algorithms (Breiman Citation2002), the application of these new approaches to estimate impervious surfaces (Deng and Wu Citation2013; Bernat and Drzewiecki Citation2014; Zhang et al. Citation2014) is relatively narrow. Besides, it is indicated by comparison research that for estimating impervious surfaces based on medium resolution imagery, the improvement of Random Forests was inconspicuous (Deng and Changshan Citation2013; Bernat and Drzewiecki Citation2014; Drzewiecki Citation2016).
Other approaches, such as artificial neural network (ANN) and nighttime light photography (NTL) analysis, have also been applied to estimate subpixel impervious surfaces. Hu and Weng (Citation2009) estimated impervious surfaces from medium spatial resolution imagery using the self-organizing map (SOM) and multi-layer perception (MLP), the two most widely used models of ANN, and concluded that MLP was slightly more accurate (Hu and Weng Citation2009). ANN modeling is capable of solving non-linear relationships (Weng Citation2012). However, the drawbacks of ANN should be noted. For MLP, none of the methods for estimating the number of hidden layer nodes is widely accepted (Kavzoglu and Mather Citation2003). Besides, the accuracy of SOM heavily relies on the size of the feature map and the error increases significantly with too few or too many neurons (Weng Citation2012). NTL analysis, mainly used to estimate the distribution of impervious surfaces at regional to continental scales, has gained more attention recently. Elvidge, Christopher D., et al. (Citation2007) developed a model to estimate the density of impervious surface in globe range based on the radiance-calibrated NTL and the LandScan population count (Elvidge et al. Citation2007). Ma, Ting, et al. (Citation2012) estimated the dynamics of the urban impervious surface in China from 1992 to 2009 using the Vegetation Adjusted NTL Urban Index, which combines NTL and Normalized Difference Vegetation Index data to achieve a higher accuracy (Ma et al. Citation2012). Shao and Liu (Citation2014) generated impervious surfaces results based on a linear-regression model developed between the subpixel impervious surfaces fraction and a multi-source index with the integrated use of DMSP-OLS NTL and MODIS NDVI (Shao and Liu Citation2014). Kotarba andAleksandrowicz (Citation2016) used high resolution nighttime photography from the International Space Station and provided more reliable estimates of impervious surface in smaller area (Kotarba and Aleksandrowicz Citation2016). Previous research found a good correlation between the actual extent of urban areas and NTL data. However, since the data sources of higher resolution NTL data are heavily limited, OLS-based maps suffer from the saturation problem and coarse resolution of the NTL sensor (Zhang and Seto Citation2011; Ma et al. Citation2012).
As one of the most predominate impervious surfaces estimation methods, CART is considered to be more accurate than linear-regression models (De’ath and Fabricius Citation2000; Huang and Townshend Citation2003; Yang et al. Citation2003a; Shao et al. Citation2015; Lu et al. Citation2016). However, the research gap appears with the lack of close analysis of the systematic errors of CART algorithm and reasonable improvement of it. Further improvement of CART is a non-trivial challenge. The primary objective of this study is to develop an integrated approach which is objective, repeatable and automate to improve the impervious surface estimation. To address the above-mentioned misestimation problems, an integrated method specifically analyzing and reducing the systematic errors in different density aided by LSMA and error analysis is proposed. This method is able to produce subpixel impervious surface map with higher accuracy compared with conventional CART or LSMA. With the improved ability of impervious estimation, the method demonstrated in this study can provide reliable basic data for research on heat island, hydrology, and other environmental issues in the urban area.
Materials and methods
Study area and data source
In this study, three study areas locate in Chicago, Venice, Guangzhou, which are one of the largest cities in America, Italy, and China, respectively, were selected to test the applicability of the methods to estimate impervious surfaces from complex urban surfaces all over the world (). Each of the study areas covers 258.71 km2 and encompasses the center area of the cities, where intensely developed urban area is located. Different types of impervious surfaces, from farmhouse, factory to skyscraper, are all widely distributed in the study areas. These areas are selected also for their complex spatial distribution patterns of non-impervious/impervious surfaces with various densities. Large areas of grassland (Chicago), mountain forest (Guangzhou), farmland, and wetland (Venice) are also included. Therefore, the efficiency of different methods for impervious surface estimation is tested in properly selected study areas.
Figure 1. Location of the study areas in Chicago (America), Venice (Italy), and Guangzhou (China) with training and validation area.
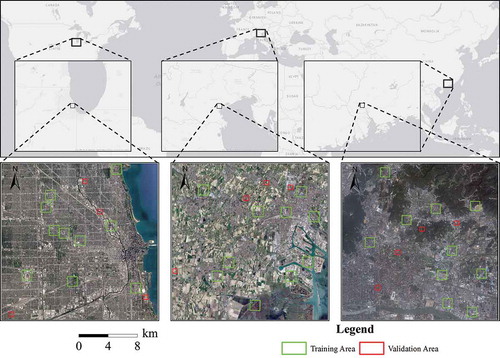
Three cloud-free Landsat8 Oli imageries (path/row: 23/31, 192/28, and 122/44; resolution: 30 m) cover the study areas in Chicago, Venice, and Guangzhou were collected. The imageries were acquiredon 12 September, 2016, 23 September, 2014 and 15 October 2014, respectively. They were registered to the Transverse Mercator Projection System and geometric corrections were processed according to 1:50,000 topographic maps. Radiometric correction was performed using the files released by the USGS EROS Data Center. And FLAASH module was applied to conduct atmosphere correction. To reduce errors, water body was excluded using MNDWI (Han-Qiu Citation2005). In addition, QuickBird Imageries (resolution: 0.6 m) covers all the study area in Chicago (18 June 2016), Venice (14 March 2014), and Guangzhou (5 October 2014) were collected to produce training and validation data ().
CART algorithm estimation of impervious surfaces
CART algorithm produces rule set and tree models to predict target variables. Based on training data, the independent variables are recursively divided into subsets such that the total residual sum square (RSS) of all the subsets is minimized. The RSS of the kth subset is calculated as:
Where, is the quantity of the training data in the kth subset,
and
the predicted and actual values of the target variable (Breiman et al. Citation1984). However, this algorithm is less satisfactory because the predicted target variable for each subset is a single value
, the mean value of all the target variables of training data in that subset. The accuracy of the algorithem can be significantly improved with linear regression functions employed to estimate the predicted target variables in each subset. Least square-regression method is used to determine the linear regression functions for each subset (Huang and Townshend Citation2003). Huang and Townshend (Citation2003) suggest that while a relationship may not be linear globally, a linearity assumption shall be valid for a small subset of the data. Therefore, the CART algorithm is theoretically applicable to explore the complicated relationships between density of impervious surfaces area (ISA) and remote sensing spectral reflectance.
In this study, the process of impervious surface estimation involves the following steps: (1) developing training data using QuickBird imagery; (2) modeling CART algorithm with training data; (3) estimating ISA in the study area using CART algorithm. In this study, CART algorithm was developed using Cubist® (http://www.rulequest.com). This program is a powerful tool for generating CART algorithm presented by Huang and Townshend (Huang and Townshend Citation2003).
shows the detailed information for training and validation areas. First, 10 training areas were randomly selected for each of the QuickBird imageries of Chicago, Venice, and Guangzhou ( and )). Each of the training areas covered 0.86 km2, corresponding to 961 pixels in Landsat8 Oli imagery. Next, the impervious surface was extracted from QuickBird imagery using object-oriented classification, which is capable of integrating different spatial information such as texture, shape, and context to better discriminate between spectrally similar types of land cover. Compared with pixel-based classification, object-oriented classification is more suitable for high resolution remote sensing (Li et al. Citation2011). Misclassifications caused by shadow, water, or small spot of vegetation were manually checked and modified with visual interpretation. The classification results were then merged to produce a binary raster imagery of impervious versus non-impervious ()). Afterward, the classification results were overlaid with grid extracted from Landsat8 Oli imagery ()) and ISA was calculated for every Landsat8 Oli imagery pixels in training area according to the following equation ()):
Figure 2. Process of ISA estimation with CART: (a) one of the training areas in QuickBird imagery (Guangzhou); (b) binary map of impervious surfaces in training area extracted using O-O classifier; (c) grid corresponding to Landsat8 Oli imagery in training areas; (d) density of impervious surfaces in training area (30 m resolution) for training; (e) one of the validation areas in QuickBird imagery (Chicago); (f) density of impervious surfaces in validation area (30 m resolution) for accuracy validation.
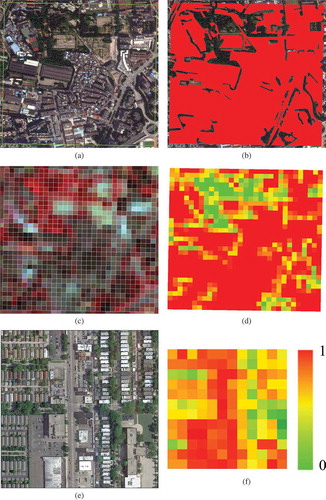
where, A is the area of the impervious surfaces in one Oli imagery pixel that covers 900 m2. In addition, validation data was also estimated by the similar approach () and ()). Finally, ISA (target variables) and the spectral characteristics (independent variables) of Landsat8 Oli imagery pixels in training area were read as training data to develop a CART algorithm, which was expressed as collections of rules associated with a series of multivariate linear model, to estimate ISA for the all three study areas.
LSMA model estimation of impervious surfaces
LSMA is a linear unmixing model that calculates the abundance of endmembers in mixed pixels, which extensively exist in the imagery produced by medium resolution sensors such as Landsat8 Oli. As each mixed pixel of an imagery can be viewed as a linear combination of the endmembers, the mathematical model of the LSMA can be expressed by the following equation (Roberts et al. Citation1999):
where, Ri is the spectral reflectance of band i, k the class number of endmembers, fk is the proportion of endmember k within the pixel, Rik is the known spectral reflectance of endmember k at band i and is the error for band i. The following conditions must be satisfied to solve for fk:
where, . In this study, four-endmembers-LSMA-model was chosen to estimate ISA after comparing the accuracy. Impervious surface fraction was estimated by analyzing the proportion of low- and high-albedo endmembers, together with endmembers of soil and vegetation in pixels (Wu and Murray Citation2003).
The following four steps were processed to estimate impervious surfaces in this study: (1) exclusion of bodies of water that primarily consisted of pure pixels; (2) minimum noise fraction (MNF) rotation, which produced a smaller number of components that contain most of the information; (3) calculation of the Pixel Purity Index (PPI) from the MNF component imagery and selection of endmembers; and (4) linear spectral mixing analysis and post-processing.
Error analysis
Four validation areas (each covering 0.13 km2) were randomly selected from each of the study areas in Chicago, Venice, and Guangzhou ( and ) and ()). The validation areas contain 1728 Landsat8 Oli imagery pixels for producing validation data.
In this study, CART algorithm was improved with the LSMA estimation results based on several error analysis methods, including scatter plot, the residual error (RE), the RMSE, and the mean absolute error (MAE).
Scatter plot is widely used for validating the accuracy of estimation of the impervious surface (Wu and Murray Citation2003; Jiang et al. Citation2008, Citation2009; Hu and Weng Citation2009; She and Xiaoning Citation2013; Ebrahimian et al. Citation2016). With actual value on the x-axis and predicted value on the y-axis, scatter plot is a straightforward way to analyze the errors of different impervious surfaces estimation methods. And linear fitting function and can be calculated by simple linear regression.
Residual error, which measures the difference between estimated and actual ISA, was calculated for each of the pixels in the validation area:
where, and
are the estimated and actual values, respectively.
RMSE and MAE were calculated based on statistics of RE. RMSE is one of the most widely reported error measures in the climatic and environmental literature. While the RMSE treats variance as it gives errors with larger absolute values more weight than errors with smaller absolute values, MAE gives the same weight to all errors and measures the mean absolute value of each difference (Chai and Draxler Citation2014). Compared with RMSE, MAE is considered to be a more natural and unambiguous index to estimate errors (Willmott and Matsuura Citation2005). They are commonly calculated by the following equations:
where, is the number of validation data,
and
the estimated and actual values. In this study, scatter plot was applied to estimate the overall accuracy of CART and LSMA while RSME and MAE were used to evaluate and compare the errors of the above two approaches in surfaces with different ISA.
Improving impervious surface estimation
For further analysis and improvements, we divided the resultant impervious surfaces into 10 categories based on their density: 0.0 ~ 0.1(non-impervious surfaces), 0.1 ~ 0.2, 0.2 ~ 0.3, 0.3 ~ 0.4 (low-density impervious surfaces), 0.4 ~ 0.5, 0.5 ~ 0.6, 0.6 ~ 0.7 (medium-density impervious surfaces), and 0.7 ~ 0.8, 0.8 ~ 0.9, 0.9 ~ 1 (high-density impervious surfaces).
The improved method can be divided into several steps (), including (1) estimating residual errors (REc) from CART for all validation pixels based on the estimated results (Figures 4 and 5); (2) selecting poorly estimated pixels as the ones with high absolute value (ABS) of REc. In order to find out the error source, the amount of poorly estimated pixels in each of the above mentioned 10 categories were quantified and analyzed ()); (3) calculating the MAE of CART and LSMA (MAEc & MAEl) for each of the categories based on the pixels in the validation area (); (4) choosing the pixels with MAEl much less than MAEc as targeted pre-improved pixels; (5) modifying the CART estimated results by replacing ISAc with ISAl for all the targeted pixels in the study area.
Figure 3. Procedure of improved CART algorithm by LSMA and error analysis.
Figure 4. Impervious surfaces estimated by CART and LSMA.
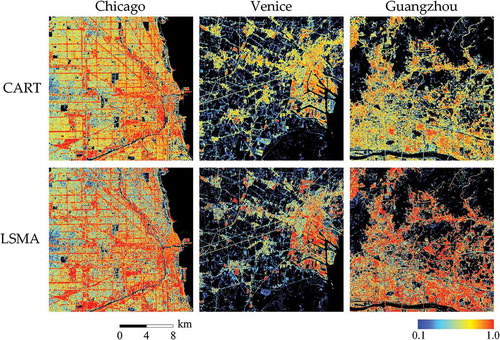
Figure 5. Accuracy assessment scatter plot of (a) CART and (b) LSMA.
Figure 6. (a) Box plot of REc, (b) quantity of pixels aggregated by ABS of REc, and (c) ISAc.
Figure 7. MAE of CART and LSMA estimation in different ISA.
The improved method becomes significant if most of the poorly estimated pixels from CART can be corrected with better estimated ISAl. In this study, the statistics in the validation area show that of all the 171 poorly estimated pixels from CART ()) (with REc higher than 0.15), 113 of them were corrected. More detailed analyses and discussion of the improved results are provided in Chapters 3.3 and 4.
Results and analysis
Results estimated by CART algorithm and LSMA model
shows the results of impervious surfaces in three study areas estimated by CART algorithm and LSMA model. And scatter plot was used to analyze the results of accuracy validation based on all the pixels in validation areas (). While both results gained acceptable R2, CART algorithm performed slightly better than LSMA with higher overall accuracy and R2. Besides, the overall MAE and RMSE of CART algorithm were 0.053 and 0.086, respectively, which was slightly less than that of LSMA (0.054 and 0.093). It is also worth mentioning the CART algorithm got more accurate results than LSMA in medium density impervious areas (ISA ranging 0.4 to 0.7) with lower MAE (0.077 vs. 0.107). However, impervious surfaces with actual ISA greater than 0.9 were underestimated and low density (less than 0.1) were overestimated in many cases. Besides, the fitting curve of CART algorithm was not so reasonable as that of LSMA, while the ideal function should be y = x.
Targeted pre-improved pixel
In order to find out the exact error sources of CART algorithm, the distribution of REc of all the 1728 pixels in validation area was analyzed into statistics. The box plot ()) shows 0.15 is the upper limit of the REc and outlier pixels with REc greater than 0.15 should be considered as poorly estimated. ) shows that 1557 pixels were adequately estimated by CART with absolute value (ABS) of REc less than 0.15 while the other 171 pixels were poorly estimated.
The ISAc of the 171 poorly estimated pixels were then analyzed into statistics ()) and it surprisingly showed that the ISAc of nearly half of the poorly estimated pixels ranged 0.7 ~ 0.9. Most of these pixels were underestimated by CART and their actual ISA should be greater than 0.99. Meanwhile, the poorly estimated pixels with ISAc ranged 0.1 ~ 0.4 were more likely to be overestimated rather than underestimated. Therefore, the underestimation of the high-density impervious surfaces and overestimation of low-density impervious surfaces should be the main error sources of CART algorithm in this study.
Then it is necessary to reduce the underestimation of high-density impervious surfaces by discerning the targeted poorly estimated pixels from all the pixels with ISAc ranging 0.1 ~ 0.4 or 0.7 ~ 0.9 in the study areas, where actual ISA is not available. The estimation results from LSMA () were then applied. We compared the MAE of CART and LSMA (MAEc & MAEl) in different ISA by dividing it into 10 categories (). And some features can be seen: (1) for pixels with ISAc ranging 0.7 ~ 0.9, the MAEc was expectedly high; (2) for pixels with ISAc ranging 0.1 ~ 0.4, MAEc was relatively high when compared with other pixels. These two problems are subsequently related to underestimation of high-density impervious surfaces and overestimation of low-density impervious surfaces, which also correspond with what the scatter plot shows. Besides, the coefficient of x in the function of the fitting curve for validating CART (y = 0.94x+0.03) was reduced from 1.00 to 0.94 ()). It is due to the underestimation of high-density impervious surfaces and overestimation of low-density impervious surfaces. Meanwhile, the MAEl of the pixels with ISAl ranging 0 ~ 0.1 or 0.9 ~ 1 is low, especially when compared with MAEc of the pixels with ISAc ranging 0.1 ~ 0.4 or 0.7 ~ 0.9. Therefore, if a pixel has the ISAc ranging 0.1 ~ 0.4 and ISAl less than 0.1, its LSMA-estimated results should be more accurate. Similarly, The LSMA-estimated results should be more accurate in pixels with ISAc ranging 0.7 ~ 0.9 and ISAl greater than 0.9. Based on the above analysis, the ISAc can be corrected with the help of ISAl addressing at the underestimation and overestimation problems.
First, pixels with ISAc ranging 0.7 ~ 0.9 and ISAl greater than 0.8 were selected as targeted pre-improved pixels. It is very likely that ISAl were more accurate and should become finally improved results instead of ISAc, since these pixels’ MAEl were much lower than MAEc ().
Then for the same reason, the pixels with ISAc ranging 0.1 ~ 0.4 and ISAl less than 0.1 were selected as targeted pre-improved pixels. The ISAl for these pixels were used to improve the CART estimated results.
Aided by LSMA, the targeted poorly estimated pixels were discerned and the accuracy of CART algorithm can be improved.
Results of the improved method
shows the final results of impervious surfaces map estimated by the improved method. Compared with conventional CART estimated results, high-density impervious surfaces properly increase. And the complex pattern of medium-density impervious surfaces and tiny patches of low-density impervious surfaces remains, which is much better than conventional LSMA estimated results (). Besides, non-impervious surfaces such as aggregately distributed vegetation and water body are clearly and finely delineated.
Figure 8. Improved estimation of impervious surfaces in (a) Chicago, (b) Venice, (c) Guangzhou, and (d) accuracy assessment.
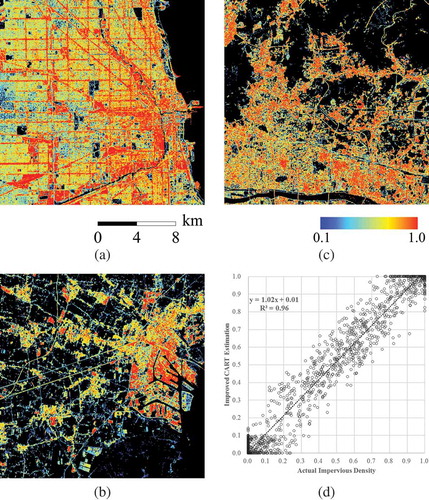
Obvious improvements are also revealed from accuracy validation of different error measurements () and scatter plot of accuracy assessment with the fitting curve ()). Overall MAE and RMSE of improved method are lowered by 22.64% and 20.93%, respectively, and R2 rises from 0.95 to 0.96. Besides, the function of the fitting curve in validation/prediction compromised scatter plot (y = 1.02x+0.01) improves from the previous y = 0.94x+0.03. Compared with y = x, the coefficient and constant in the function both become substantially more reasonable.
Table 1. Accuracy of impervious estimation.
More remarkable improvements appear in high-density impervious surfaces (actual ISA > 0.70) where intensely developed urban area locates with land use of CBD, high-density residential and light industry (Ridd Citation1995). The MAE and RMSE for the improved method in these areas are 0.066 and 0.088, respectively (), which are apparently improved when compared with those of conventional CART algorithm (0.100 and 0.130).
Discussion
In recent years, CART algorithm has been widely considered to be more accurate than linear regression models and has been continuously implemented to estimate impervious surfaces (De’ath and Fabricius Citation2000; Huang and Townshend Citation2003; Yang et al. Citation2003a; Im et al. Citation2012; Shao et al. Citation2015; Lu et al. Citation2016). However, the evident appearance of underestimation in high-density and overestimation in low-density impervious surfaces in CART algorithm implemented by many researchers undoubtedly indicates that these errors should be systematic, which were presented by their own accuracy validations (Yang et al. Citation2003b; Jiang et al. Citation2008, Citation2009; Gao et al. Citation2009; Im et al. Citation2012; She and Xiaoning Citation2013; Shao et al. Citation2015). Meanwhile, the discussions of these systematic errors are far from sufficient, let alone analysis or improvement. Much more attention should have been paid to these errors since they not only cause the major decrease of the accuracy in the poorly estimated pixels, but also affect the reliability of the entire algorithm by producing the imprecise fitting curve. Therefore, reasonable improvements of CART algorithm are non-trivial in consideration of the facts that it has already become one of the most predominant methods for impervious surfaces estimation due to its high accuracy.
In this study, we used conventional CART algorithm to estimate impervious surfaces and achieved acceptable overall accuracy. However, large areas of high-density impervious surfaces were underestimated and low-density impervious surfaces overestimated, similar as relevant research. The results estimated by LSMA model were applied to improve the estimation accuracy of CART is based on error analysis. In this study, LSMA, a widely used model for estimating impervious surfaces, was chosen for its effectiveness and conveniences. Besides, LSMA model was less affected by the underestimation in high-density impervious areas and the overestimation of non-imperviousness, although its overall accuracy was lower than the CART algorithm. With proper selections of the model and endmembers, LSMA could produce sound fitting curve in validation/prediction scatter plots as reported in previous research (Yang et al. Citation2010, Citation2012; Weng and Pu Citation2013; Fan and Deng Citation2014).
Other approaches such as ANN and Random Forests were also tested in one of the study area (Chicago) and compared with conventional CART in order to find out whether they can be applied to improve impervious surfaces estimation (). However, in high-density impervious surfaces area, the mean errors (ME) of ANN and Random Forests were −0.038 and −0.044, respectively. Similar as CART algorithm, ANN and Random Forests are both affected by problems of underestimating the high-density impervious surfaces. Besides, the overall accuracy of ANN and Random were both lower than CART. Other comparative research has also shown that Random Forests and ANN could be more seriously impacted by underestimation of high-density impervious surfaces than CART (Bernat and Drzewiecki Citation2014; Drzewiecki Citation2016). Indicated by related research (), although Random Forests and ANN are more elaborate models, especially when compared with linear analysis model, they are not able to create impervious surfaces results more accurate than conventional LSMA or CART algorithm in most cases (Hu and Weng Citation2009; Deng and Changshan Citation2013; She and Xiaoning Citation2013; Bernat and Drzewiecki Citation2014; Fan et al. Citation2015; Drzewiecki Citation2016). Therefore, for reducing the systematic errors of CART, the application of Random Forests and ANN should not be effective.
Table 2. Accuracy assessment comparison of different methods tested in study area of Chicago.
Table 3. Accuracy assessment comparison of different methods in related research.
Instead, we discerned and modified targeted pixels whose ISAc were poorly estimated. The 82,612 targeted poorly estimated pixels, which accounted for 9.60% of all three study areas, were improved in this study. With reasonable improvements, the poorly estimated pixels, especially pixels in high-density impervious areas were largely corrected. Compared with conventional CART algorithm, the area of surfaces with impervious density above 0.8 in Chicago, Venice, and Guangzhou increased by 15.23%, 27.90%, and 33.64%, respectively, from 74.45 km2 to 85.80 km2, 13.87 km2 to 17.73 km2, and 30.51 km2 to 45.97 km2. The total area of non-imperviousness also increased from 294.36 km2 to 329.12 km2. With these improvements, high-density impervious surfaces and non-imperviousness are clearly and properly delineated while the complex pattern of medium-density impervious surfaces and tiny patches of low-density impervious surfaces remains.
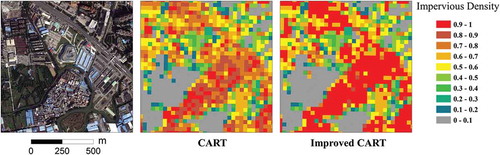
A small area covering 1 km2 in Guangzhou was chosen for a comparative analysis of the estimation results at a small-scale (). Above all, the improved estimation of high-density impervious surfaces became much more accurate than conventional CART. For instance, the congested residential estate in the middle part and the road in the northeast part are accurately estimated as high-density impervious surfaces. Since accurate estimation of high-density impervious surfaces, where intensely developed urban area locates, is the fundamental issue for monitoring and understanding the urban environment, the significance of the improvement is beyond what accuracy validation reveals.
Figure 9. Small-scale comparison of the estimation results of conventional and improved CART in Guangzhou, China.
It also worth mentioning that the application of the proposed improved method will be limited if high resolution imageries do not match well with the multispectral imagery. Besides, the proposed method is more suitable for urban areas where impervious surfaces distribute with high heterogeneity, in which scenarios the conventional CART algorithm is likely to underperform.
Conclusions and future study
In this study, it is found out that the source of systematic errors in conventional CART algorithm for estimating impervious surfaces should be the underestimation of high-density impervious and overestimation in low-density impervious surfaces. An improved method for effectively estimating impervious surfaces was then demonstrated based on error analysis of CART algorithm and LSMA. With these improvements, the pixels poorly estimated by conventional CART were discerned and modified. It is particularly significant to improve impervious surface estimation based on CART algorithm since it is one of the most widely used methods of estimating impervious surfaces with high accuracy. With lower MAE and RMSE, higher R2 and more reasonable fitting curve in validation/prediction compromised scatter plot, the improved method is proved to be accurate, objective, and repeatable. Besides, it is indicated by small-scale comparison that the significance of the improvement is beyond what the accuracy validation reveals, because the improvement in the estimation of high-density impervious surfaces, where intensely developed urban area locates, is particularly evident when compared with conventional CART algorithm. And the complex pattern of medium-density impervious surfaces and tiny patches of low-density impervious surfaces remains.
The monitoring and understanding of urban surfaces have long been challenging research issues due to spatial complexity. With the improved ability of impervious estimation, the method demonstrated in this study can provide reliable basic data for research on heat island, hydrology, and other environmental change detection in urban area. In the future study, more improvements are worth trying. It may include in-depth analysis for error sources inside CART algorithm itself and more reasonable methods to reduce the poorly estimated pixels. With these approaches, further improvements may appear.
Disclosure statement
No potential conflict of interest was reported by the authors.
Additional information
Funding
References
- Arnold, J., L. Chester, and C. James Gibbons. 1996. “Impervious Surface Coverage: The Emergence of a Key Environmental Indicator.” Journal of the American Planning Association 62 (2): 243–258.
- Bauer, M. E., N. J. Heinert, J. K. Doyle, and F. Yuan. 2004. “Impervious Surface Mapping and Change Monitoring Using Landsat Remote Sensing.” Paper presented at the ASPRS annual conference proceedings, May. Denver, CO.
- Beck, S. M., M. R. Mchale, and G. R. Hess. 2016. “Beyond Impervious: Urban Land-Cover Pattern Variation and Implications for Watershed Management.” Environmental Management. 58 (1): 1–16.
- Bernat, K., and W. Drzewiecki. 2014. “Two-Stage Subpixel Impervious Surface Coverage Estimation: Comparing Classification and Regression Trees and Artificial Neural Networks.” Paper presented at the Image and Signal Processing for Remote Sensing October, Amsterdam.
- Breiman, L. 2002. Manual on Setting Up, Using, and Understanding Random Forests V3. 1. CA: Statistics Department University of California Berkeley.
- Breiman, L. I., J. H. Friedman, R. A. Olshen, and C. J. Stone. 1984. “Classification and Regression Trees (CART).” Encyclopedia of Ecology 40 (3): 358.
- Cablk, M. E., and T. B. Minor. 2003. “Detecting and Discriminating Impervious Cover with High-Resolution IKONOS Data Using Principal Component Analysis and Morphological Operators.” International Journal of Remote Sensing 24 (23): 4627–4645.
- Chai, T., and R. R. Draxler. 2014. “Root Mean Square Error (RMSE) or Mean Absolute Error (Mae)?–Arguments against Avoiding RMSE in the Literature.” Geoscientific Model Development 7 (3): 1247–1250.
- Corbett, C. W., M. Wahl, D. E. Porter, D. Edwards, and C. Moise. 1997. “Nonpoint Source Runoff Modeling A Comparison of A Forested Watershed and an Urban Watershed on the South Carolina Coast.” Journal of Experimental Marine Biology & Ecology 213 (1): 133–149.
- Dams, J., J. Dujardin, R. Reggers, I. Bashir, F. Canters, and O. Batelaan. 2013. “Mapping Impervious Surface Change from Remote Sensing for Hydrological Modeling.” Journal of Hydrology 485 (485): 84–95.
- De’ath, G., and K. E. Fabricius. 2000. “Classification and Regression Trees: A Powerful yet Simple Technique for Ecological Data Analysis.” Ecology 81 (11): 3178–3192.
- Deng, C., and W. Changshan. 2013. “The Use of Single-Date MODIS Imagery for Estimating Large-Scale Urban Impervious Surface Fraction with Spectral Mixture Analysis and Machine Learning Techniques.” ISPRS Journal of Photogrammetry and Remote Sensing 86: 100–110.
- Dougherty, M., R. L. Dymond, S. J. Goetz, C. A. Jantz, and N. Goulet. 2004. “Evaluation of Impervious Surface Estimates in a Rapidly Urbanizing Watershed.” Photogrammetric Engineering & Remote Sensing 70 (11): 1275–1284.
- Drzewiecki, W. 2016. “Improving Sub-Pixel Imperviousness Change Prediction by Ensembling Heterogeneous Non-Linear Regression Models.” Geodesy and Cartography 65 (2): 193–218.
- Ebrahimian, A., B. N. Wilson, and J. S. Gulliver. 2016. “Improved Methods to Estimate the Effective Impervious Area in Urban Catchments Using Rainfall-Runoff Data.” Journal of Hydrology 536: 109–118.
- Elvidge, C. D., B. T. Tuttle, P. C. Sutton, K. E. Baugh, A. T. Howard, C. Milesi, B. Bhaduri, and R. Nemani. 2007. “Global Distribution and Density of Constructed Impervious Surfaces.” Sensors 7 (9): 1962–1979.
- Fan, F., and Y. Deng. 2014. “Enhancing Endmember Selection in Multiple Endmember Spectral Mixture Analysis (MESMA) for Urban Impervious Surface Area Mapping Using Spectral Angle and Spectral Distance Parameters.” International Journal of Applied Earth Observation and Geoinformation 33: 290–301.
- Fan, F., W. Fan, and Q. Weng. 2015. “Improving Urban Impervious Surface Mapping by Linear Spectral Mixture Analysis and Using Spectral Indices.” Canadian Journal of Remote Sensing 41 (6): 577–586.
- Fu, H., Z. Shao, T. Conghuan, and Q. Zhang. 2016. “Impacts of Feature Selection for Urban Impervious Surface Extraction Using Optical Image and SAR Data.” Paper presented at the Earth Observation and Remote Sensing Applications (EORSA), 2016, 4th International Workshop on. August. Guangzhou, China.
- Gao, Z., L. Zhang, M. Liao, and L. Jiang. 2009. “Estimating Urban Impervious Surface Percentage with Multi-Source Remote Sensing Data.” Paper presented at the 2009 Joint Urban Remote Sensing Event. June. Shanghai, China.
- Han-Qiu, X. U. 2005. “A Study on Information Extraction of Water Body with the Modified Normalized Difference Water Index (MNDWI).” Journal of Remote Sensing 5: 589–595.
- Hao, P., Z. Niu, Y. Zhan, W. Yunchao, L. Wang, and Y. Liu. 2016. “Spatiotemporal Changes of Urban Impervious Surface Area and Land Surface Temperature in Beijing from 1990 to 2014.” GIScience & Remote Sensing 53 (1): 63–84.
- Hu, X., and Q. Weng. 2009. “Estimating Impervious Surfaces from Medium Spatial Resolution Imagery Using the Self-Organizing Map and Multi-Layer Perceptron Neural Networks.” Remote Sensing of Environment 113 (10): 2089–2102.
- Huadong, G., H. Qingni, L. Xinwu, S. Zhongchang, and Z. Ying. 2014. “Spatiotemporal Analysis of Urban Environment Based on the Vegetation–Impervious Surface–Soil Model.” Journal of Applied Remote Sensing 8 (1): 084597. doi:10.1117/1.JRS.8.084597
- Huang, C., and J. R. G. Townshend. 2003. “A Stepwise Regression Tree for Nonlinear Approximation: Applications to Estimating Subpixel Land Cover.” International Journal of Remote Sensing 24 (1): 75–90.
- Im, J., L. Zhenyu, J. Rhee, and L. J. Quackenbush. 2012. “Impervious Surface Quantification Using a Synthesis of Artificial Immune Networks and Decision/Regression Trees from Multi-Sensor Data.” Remote Sensing of Environment 117: 102–113.
- Jiang, L., M. Liao, H. Lin, Y. A. N. G. Limin, and W. A. N. G. Changcheng. 2008. “Estimating Urban Impervious Surface Percentage with ERS-1/2 InSAR Data.” Journal of Remote Sensing-Beijing- 12 (1): 184.
- Jiang, L., M. Liao, H. Lin, and L. Yang. 2009. “Synergistic Use of Optical and InSAR Data for Urban Impervious Surface Mapping: A Case Study in Hong Kong.” International Journal of Remote Sensing 30 (11): 2781–2796.
- Kavzoglu, T., and P. M. Mather. 2003. “The Use of Backpropagating Artificial Neural Networks in Land Cover Classification.” International Journal of Remote Sensing 24 (23): 4907–4938.
- Kotarba, A. Z., and S. Aleksandrowicz. 2016. “Impervious Surface Detection with Nighttime Photography from the International Space Station.” Remote Sensing of Environment 176: 295–307.
- Li, C., D. Jinkang, S. Youpeng, L. Qian, and L. Chen. 2010. “Extraction of Impervious Surface Based on Multi-Source Satellite Data of Qinhuai River Basin from 1979–2009.” Paper Presented at the Geoinformatics, 2010 18th International Conference On. September. Beijing, China.
- Li, W., Z. Ouyang, W. Zhou, and Q. Chen. 2011. “Effects of Spatial Resolution of Remotely Sensed Data on Estimating Urban Impervious Surfaces.” Journal of Environmental Sciences 23 (8): 1375–1383.
- Li, W., and W. Changshan. 2016. “A Geostatistical Temporal Mixture Analysis Approach to Address Endmember Variability for Estimating Regional Impervious Surface Distributions.” GIScience & Remote Sensing 53 (1): 102–121.
- Lu, D., and Q. Weng. 2006. “Use of Impervious Surface in Urban Land-Use Classification.” Remote Sensing of Environment 102 (1): 146–160.
- Lu, X., L. Jia, P. Duan, J. Wang, and C. Zhang. 2016. “Research on Impervious Surface Dynamic Changes Based on Landsat Satellite Images in Nantong, China.” Paper Presented at the International Symposium on Optoelectronic Technology and Application 2016. October. Beijing, China.
- Ma, T., C. Zhou, T. Pei, S. Haynie, and J. Fan. 2012. “Quantitative Estimation of Urbanization Dynamics Using Time Series of DMSP/OLS Nighttime Light Data: A Comparative Case Study from China’s Cities.” Remote Sensing of Environment 124: 99–107.
- Mather, P. M. 1999. “Land Cover Classification Revisited.” Advances in Remote Sensing and GIS Analysis 7–16.
- Mathew, A., S. Khandelwal, and N. Kaul. 2016. “Spatial and Temporal Variations of Urban Heat Island Effect and the Effect of Percentage Impervious Surface Area and Elevation on Land Surface Temperature: Study of Chandigarh City, India.” Sustainable Cities and Society 26: 264–277.
- Meyer, W. B., and I. I. B. L. Turner. 1994. Changes in Land Use and Land Cover: A Global Perspective. Vol 4. Cambridge University Press.
- Phinn, S., M. Stanford, P. Scarth, A. T. Murray, and P. T. Shyy. 2002. “Monitoring the Composition of Urban Environments Based on the Vegetation-Impervious Surface-Soil (VIS) Model by Subpixel Analysis Techniques.” International Journal of Remote Sensing 23 (20): 4131–4153.
- Piyoosh, A. K., and S. K. Ghosh. 2017. “Semi-Automatic Mapping of Anthropogenic Impervious Surfaces in an Urban/Suburban Area Using Landsat 8 Satellite Data.” GIScience & Remote Sensing 54 (4): 471–494.
- Prosdocimi, M., G. Sofia, G. Dalla Fontana, and P. Tarolli. 2015. “Bank Erosion in Agricultural Drainage Networks: New Challenges from Structure-From-Motion Photogrammetry for Post-Event Analysis.” Earth Surface Processes and Landforms 40: 1891–1906.
- Ridd, M. K. 1995. “Exploring a VIS (Vegetation-Impervious Surface-Soil) Model for Urban Ecosystem Analysis through Remote Sensing: Comparative Anatomy for Cities.” International Journal of Remote Sensing 16 (12): 2165–2185.
- Roberts, D. A., G. Batista, J. Pereira, E. Waller, and B. Nelson. 1999. Change Identification Using Multitemporal Spectral Mixture Analysis: Applications in Eastern Amazonia.
- Schueler, T. R. 1994. “The Importance of Imperviousness.” Watershed Protection Techniques 1 (3): 100–111.
- Scott, D., G. P. Petropoulos, J. Moxley, and H. Malcolm. 2014. “Quantifying the Physical Composition of Urban Morphology Throughout Wales Based on the Time Series (1989–2011) Analysis of Landsat TM/ETM+ Images and Supporting GIS Data.” Remote Sensing 6 (12): 11731–11752.
- Shao, Y., G. L. Li, E. Guenther, and J. B. Campbell. 2015. “Evaluation of Topographic Correction on Subpixel Impervious Cover Mapping with CBERS-2B Data.” IEEE Geoscience and Remote Sensing Letters 12 (8): 1675–1679.
- Shao, Z., and C. Liu. 2014. “The Integrated Use of DMSP-OLS Nighttime Light and MODIS Data for Monitoring Large-Scale Impervious Surface Dynamics: A Case Study in the Yangtze River Delta.” Remote Sensing 6 (10): 9359–9378.
- She, Y., and L. Xiaoning. 2013. “Estimating Impervious Surface Percent in Plain River Network Regions Using a Refinement CART Analysis.” Paper Presented at the 2013 the International Conference on Remote Sensing, Environment and Transportation Engineering (RSETE 2013).
- Small, C., and J. W. T. Lu. 2006. “Estimation and Vicarious Validation of Urban Vegetation Abundance by Spectral Mixture Analysis.” Remote Sensing of Environment 100 (4): 441–456.
- Sofia, G., F. Mariniello, and P. Tarolli. 2016. “Metrics for Quantifying Anthropogenic Impacts on Geomorphology: Road Networks.” Earth Surface Processes and Landforms 41: 240–255.
- Sofia, G., G. Roder, G. Dalla Fontana, and P. Tarolli. 2017. “Flood Dynamics in Urbanised Landscapes: 100 Years of Climate and Humans’ Interaction.” Scientific Reports 7: 40527.
- Stow, D. A., and D. M. Chen. 2002. “Sensitivity of Multitemporal NOAA AVHRR Data of an Urbanizing Region to Land-Use/Land-Cover Changes and Misregistration.” Remote Sensing of Environment 80 (2): 297–307.
- UNHabitat. 2016. World Cities Report 2016: Urbanization and Development - Emerging Futures.
- Weng, F., and P. Ruiliang. 2013. “Mapping and Assessing of Urban Impervious Areas Using Multiple Endmember Spectral Mixture Analysis: A Case Study in the City of Tampa, Florida.” Geocarto International 28 (7): 594–615.
- Weng, Q. 2001. “Modeling Urban Growth Effects on Surface Runoff with the Integration of Remote Sensing and GIS.” Environmental Management 28 (6): 737–748.
- Weng, Q. 2012. “Remote Sensing of Impervious Surfaces in the Urban Areas: Requirements, Methods, and Trends.” Remote Sensing of Environment 117 (2): 34–49.
- Willmott, C. J., and K. Matsuura. 2005. “Advantages of the Mean Absolute Error (MAE) over the Root Mean Square Error (RMSE) in Assessing Average Model Performance.” Climate Research 30 (1): 79–82.
- Wu, C. 2004. “Normalized Spectral Mixture Analysis for Monitoring Urban Composition Using ETM+ Imagery.” Remote Sensing of Environment 93 (4): 480–492.
- Wu, C., and A. T. Murray. 2003. “Estimating Impervious Surface Distribution by Spectral Mixture Analysis.” Remote Sensing of Environment 84 (4): 493–505.
- Xian, G., and M. Crane. 2005. “Assessments of Urban Growth in the Tampa Bay Watershed Using Remote Sensing Data.” Remote Sensing of Environment 97 (2): 203–215.
- Xian, G., M. Crane, and M. Cory. 2008. “Quantifying Multi-Temporal Urban Development Characteristics in Las Vegas from Landsat and ASTER Data.” Photogrammetric Engineering & Remote Sensing 74 (4): 473–481.
- Xiao, J., Y. Shen, G. Jingfeng, R. Tateishi, C. Tang, Y. Liang, and Z. Huang. 2006. “Evaluating Urban Expansion and Land Use Change in Shijiazhuang, China, by Using GIS and Remote Sensing.” Landscape and Urban Planning 75 (1): 69–80.
- Yang, F., B. Matsushita, and T. Fukushima. 2010. “A Pre-Screened and Normalized Multiple Endmember Spectral Mixture Analysis for Mapping Impervious Surface Area in Lake Kasumigaura Basin, Japan.” ISPRS Journal of Photogrammetry and Remote Sensing 65 (5): 479–490.
- Yang, F., B. Matsushita, T. Fukushima, and W. Yang. 2012. “Temporal Mixture Analysis for Estimating Impervious Surface Area from Multi-Temporal MODIS NDVI Data in Japan.” ISPRS Journal of Photogrammetry and Remote Sensing 72: 90–98.
- Yang, L., C. Huang, C. G. Homer, B. K. Wylie, and M. J. Coan. 2003a. “An Approach for Mapping Large-Area Impervious Surfaces: Synergistic Use of Landsat-7 ETM+ and High Spatial Resolution Imagery.” Canadian Journal of Remote Sensing 29 (2): 230–240.
- Yang, L., L. Jiang, H. Lin, and M. Liao. 2009. “Quantifying Sub-Pixel Urban Impervious Surface through Fusion of Optical and InSAR Imagery.” GIScience & Remote Sensing 46 (2): 161–171.
- Yang, L., G. Xian, J. M. Klaver, and B. Deal. 2003b. “Urban Land-Cover Change Detection through Sub-Pixel Imperviousness Mapping Using Remotely Sensed Data.” Photogrammetric Engineering & Remote Sensing 69 (9): 1003–1010.
- Yuan, F., and M. E. Bauer. 2007. “Comparison of Impervious Surface Area and Normalized Difference Vegetation Index as Indicators of Surface Urban Heat Island Effects in Landsat Imagery.” Remote Sensing of Environment 106 (3): 375–386.
- Zhang, C., Y. Chen, and L. Dengsheng. 2015. “Detecting Fractional Land-Cover Change in Arid and Semiarid Urban Landscapes with Multitemporal Landsat Thematic Mapper Imagery.” GIScience & Remote Sensing 52 (6): 700–722.
- Zhang, L., and Q. Weng. 2016. “Annual Dynamics of Impervious Surface in the Pearl River Delta, China, from 1988 to 2013, Using Time Series Landsat Imagery.” ISPRS Journal of Photogrammetry and Remote Sensing 113: 86–96.
- Zhang, Q., and K. C. Seto. 2011. “Mapping Urbanization Dynamics at Regional and Global Scales Using Multi-Temporal DMSP/OLS Nighttime Light Data.” Remote Sensing of Environment 115 (9): 2320–2329.
- Zhang, Y., H. Zhang, and H. Lin. 2014. “Improving the Impervious Surface Estimation with Combined Use of Optical and SAR Remote Sensing Images.” Remote Sensing of Environment 141: 155–167.