
Abstract
The greyback canegrub (Dermolepida albohirtum) is the main pest of sugarcane crops in all cane-growing regions between Mossman (16.5°S) and Sarina (21.5°S) in Queensland, Australia. In previous years, high infestations have cost the industry up to $40 million. However, identifying damage in the field is difficult due to the often impenetrable nature of the sugarcane crop. Satellite imagery offers a feasible means of achieving this by examining the visual characteristics of stool tipping, changed leaf color, and exposure of soil in damaged areas. The objective of this study was to use geographic object-based image analysis (GEOBIA) and high-spatial resolution GeoEye-1 satellite imagery for three years to map canegrub damage and develop two mapping approaches suitable for risk mapping. The GEOBIA mapping approach for canegrub damage detection was evaluated over three selected study sites in Queensland, covering a total of 254 km2 and included five main steps developed in the eCognition Developer software. These included: (1) initial segmentation of sugarcane block boundaries; (2) classification and subsequent omission of fallow/harvested fields, tracks, and other non-sugarcane features within the block boundaries; (3) identification of likely canegrub-damaged areas with low NDVI values and high levels of image texture within each block; (4) the further refining of canegrub damaged areas to low, medium, and high likelihood; and (5) risk classification. The validation based on field observations of canegrub damage at the time of the satellite image capture yielded producer’s accuracies between 75% and 98.7%, depending on the study site. Error of commission occurred in some cases due to sprawling, drainage issues, wind, weed, and pig damage. The two developed risk mapping approaches were based on the results of the canegrub damage detection. This research will improve decision making by growers affected by canegrub damage.
1. Introduction
Sugarcane is a tall-growing perennial plant that is cultivated in the tropics and subtropics for its ability to store high concentrations of sucrose in the internodes of the stem (Grof and Campbell Citation2001). The greyback canegrub, Dermolepida albohirtum (Waterhouse) (Coleoptera: Scarabaeidae), is the principal pest of sugarcane crops grown along the east coast of Australia, particularly within a 700-km region, extending from Mossman in Far North Queensland to Sarina in the Central District. Previous estimates of lost production from canegrub damage are around $10 million annually, but can reach $40 million in years of high infestation (Allsopp et al. Citation1993; Chandler Citation2002). The greyback canegrub exhibits a one-year lifecycle. The adult beetles emerge in late spring or early summer following the onset of rainfall around October–December, and lay eggs in the soil in December–January. The larval stage has three instars, all of which feed extensively on the root mass of the sugarcane plant, causing-reduced growth, stool tipping, and ultimately plant death (Sallam Citation2011). By the time visual symptoms of damage are apparent during autumn (April–June), the size of the crop prohibits mechanical application of insecticide. Therefore, sugarcane growers need to apply chemical treatment during the harvesting, ratooning, and planting phase (July–October) when crops are sufficiently small for such operations and before the next commencement of beetle flight (Sallam Citation2011). Although it is difficult to predict where greyback cane beetles will lay their eggs, damage incurred in a previous crop is a strong indicator of where damage will occur in an upcoming season (Sallam and Lowe Citation2012). Canegrub numbers have also been found to build up over a number of seasons. Hence, knowledge on the spatial location and extent of canegrub damage can facilitate the assessment of where damage is likely to occur the following year and ultimately where treatment should be implemented.
Regional cane inspection is a demanding task due to the impenetrable nature of sugarcane fields. There is a significant need for a reliable detection method to serve as an early warning system to growers before infestation escalates to unmanageable levels. Without the ability to monitor canegrub damage, sugarcane growers are unable to treat strategically and instead either neglect an application of insecticide therefore risking a yield deficit or needlessly apply insecticide to unaffected crops, resulting in unnecessary input costs. Strategic application of pesticides is now implemented in Far North Queensland based on advice generated through the GrubPlan program (Sallam and Lowe Citation2012; Samson, Chandler, and Sallam Citation2012). However, monitoring and forecast methodologies rely on extensive fieldwork, including digging up cane plants and manually counting canegrub numbers. High spatial resolution remote sensing may offer the opportunity to proactively identify emerging canegrub damage on a regional level.
Vegetation indices derived from multi-spectral image data have long been used to estimate crop yield (Lobell Citation2013; Robson Citation2007; Wiegand and Richardson, Citation1991; Yang and Everitt Citation2002). Remote sensing has also been used for pest and disease detection. For example, airborne multi-spectral image data have been used to map late blight infestations in tomato fields in California (Zhang, Qui, and Liu Citation2005), while high-spatial resolution QuickBird satellite and airborne hyper-spectral image data have been used to detect powdery mildew and leaf rust in winter wheat in Germany (Franke and Menz Citation2007). In Australia, Hyperion satellite image data have been used to detect orange rust disease in sugarcane fields (Apan et al. Citation2004). Remote sensing of sugarcane has so far focused on extent mapping, crop age class identification, variety discrimination, yield prediction (Rahman and Robson Citation2016; Robson et al. Citation2012; Vieira et al. Citation2012), crop health, and nutritional status monitoring (Abdel-Rahman and Ahmed Citation2008; Robson et al. Citation2016). Although courser spatial resolution image data have been successfully used for yield estimation of sugarcane (Duveiller, Lopez-Lozano, and Baruth Citation2013; Mulianga et al. Citation2013), the within-block detection of disturbance and variability requires high-spatial resolution data. Despite the importance of maintaining competitiveness, there is only very limited remote sensing based research focusing on disease management of sugarcane. Johansen et al. (Citation2014) provided some preliminary results on the potential use of high-spatial resolution satellite imagery to detect canegrub damage. Based on symptoms of canegrub damage and the spatial manifestation of these symptoms, Johansen et al. (Citation2014) identified high-spatial resolution satellite image data as being suitable for canegrub damage detection. However, this study was only based on one year of image data.
The objective of this study was to use geographic object-based image analysis (GEOBIA) and high-spatial resolution GeoEye-1 satellite imagery for a three-year period to map canegrub damage and develop two mapping approaches suitable for risk mapping. GEOBIA overcomes problems of traditional pixel-based mapping approaches of high-spatial resolution image data by grouping pixels into homogenous objects (Blaschke Citation2010; Johansen, Bartolo, and Phinn Citation2010). The rationale for employing a GEOBIA framework for monitoring of canegrub damage was: (1) the high-spatial resolution of the used GeoEye-1 image data, which caused large spectral variation of the pixel values, representing canegrub damage and hence prohibited the use of pixel-based approaches, whereas the average spectral and textural information at the object-level allowed discrimination of canegrub and non-canegrub affected areas; and (2) the large spectral and textural variation in how canegrub damage is exhibited among different sugarcane blocks with different cane varieties. Hence, a multi-scale approach, assessing individual sugarcane blocks one at a time, was deemed important. Hay et al. (Citation2001), (Citation2003), (Citation2005) highlight the usefulness of GEOBIA for multi-scale analysis.
2. Study area
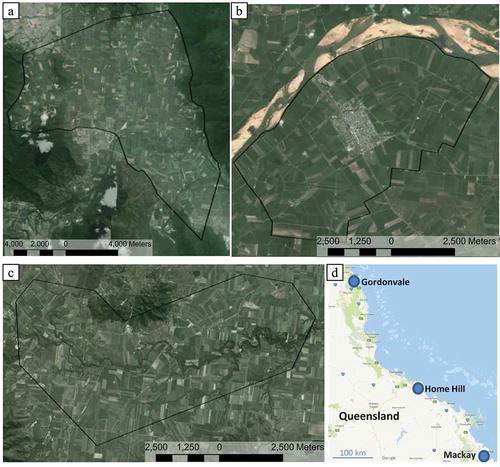
The three study areas were located in the tropics around Mackay (Central district), Home Hill (the Burdekin), and Gordonvale (Mulgrave, Far North Queensland) (). The selected location of each of the three study areas was based on records of canegrub damage in 2010 from productivity services in each region and a preliminary survey of farmers by Sugar Research Australia (SRA) during June–July 2011. The Gordonvale study area was located 10 km south of Cairns and covered 128 km2. The Home Hill study area was 7 km south of Ayr along the southern banks of the Burdekin River and covered 53 km2. The Mackay study area was located approximately 15 km southwest of Mackay and covered an area of 73 km2. As sugarcane needs plenty of water to grow, the growing regions occur in the coastal areas east of the Great Dividing Range. The Mackay, Ayr, and Cairns regions receive an average annual rainfall of 1,600 mm, 1,000 mm, and 2,000 mm, respectively. This may vary considerably from year to year and hence irrigation is needed at times. Harvest starts in mid-June and goes for several months. After harvest new shots appear within a few weeks, and the sugarcane grows to 2–5 m height by the time of harvest. Annual yield varies per region, but appears in the range of 60–130 t/ha (Robson et al. Citation2016).
Figure 1. The three study sites in Queensland: (a) Gordonvale; (b) Home Hill; (c) Mackay, and (d) study site locations in Queensland. The black outlines on the GeoEye-1 images in (a)-(c) indicate the areas captured by the GeoEye-1 satellite sensor.
3. Data and methods
3.1. Field data
A stratified-random-sampling approach was initially tested for collection of field data of canegrub damage within selected blocks. However, this prevented most locations with canegrub damage from being included and resulted in a large number of samples with healthy cane. That, combined with the challenging and time-consuming logistics of accessing sites and walking large distances through near impenetrable cane, limited the field data collection sampling design to a more targeted approach. As healthy cane was relative easy to map; the main focus of the field data collection was to target and assess locations with canegrub damage and other disturbances to test if these could be discriminated. Hence, for the three study sites, the locations with likely canegrub damage and other disturbances visited in the field were selected: (1) independently of the image data, generally by field surveys conducted around April and/or helicopter flyovers around the time of harvest (mid-June); and (2) by visual interpretation of the image data (generally around June–July). As canegrub damage identified at any time during the growing season become gradually worse and visually more distinct toward the time of harvest, all field data collected during the growing season can be matched with a satellite image collected around the time of harvest. To avoid bias and artificially high mapping accuracies, oversampling was required of sites canegrub damage and other disturbances, while healthy cane was undersampled.
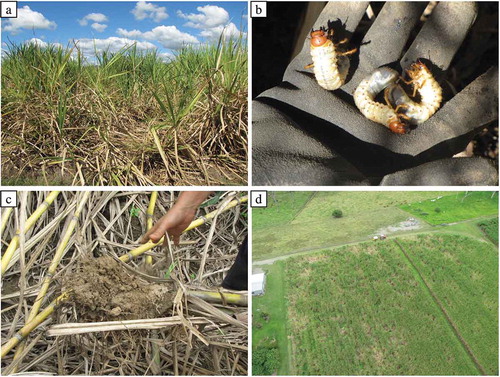
Damage identification independent of the image data was initially done based on distinct visual characteristics; for example, stool tipping, changed leaf color, and exposure of soil ()). Up to five digs, one in the center and in four directions within 5 m from the center point, were then carried out to confirm the presence or absence of canegrubs ()). If no canegrubs were recovered, then the root mass was inspected for signs of canegrub feeding ()). The damage was then defined as: (1) the presence of canegrubs; (2) the presence of fresh damage with canegrubs present or absent; or (3) old damage in case of the presence of damage signs from an old infestation and the absence of fresh damage. Other causes of damage such as waterlogging, weeds, wind, other pests and diseases, nutrients deficiency, herbicides, and natural lodging were also recorded. A GPS reading from the center point was collected for each of these sites together with supporting photos. Likely canegrub damage and other disturbances identified from helicopter surveys conducted prior to harvest (June) were followed by field validation using the approach described above. For the Mackay region, a helicopter survey was conducted once in 2013 and for Gordonvale on three separate occasions in 2012, 2013, and 2014. Selected locations visually interpreted as potential canegrub damage or other disturbance factors in the satellite image data were also visited and field validated using the approach described above. For the Gordonvale site, 130, 175, and 90 field validation locations of canegrub damage were visited in 2012, 2013, and 2014, respectively. For the Mackay site, 77, 83, and 167 field validation locations of canegrub damage were visited in 2012, 2013, and 2014, respectively. In addition, field training data of 15 canegrub damage sites, 15 sites of other types of disturbance (e.g. sprawling, wind damage, pig damage), and 15 sites of healthy cane were collected each year for both the Gordanvale and Mackay sites. These training data were used for GEOBIA described in Section 3.3. Limited canegrub damage was observed for the Burdekin site. Only 36 canegrub damage sites were field identified in 2013 and these were used for validation. No training data were available for the Burdekin site.
Figure 2. (a) Canegrub infested sugarcane showing tool tipping, changed leaf color, and exposure of soil; (b) greyback canegrubs; (c) roots damaged by canegrubs; and (d) aerial photo from helicopter, showing advanced canegrub damage.
In addition, canegrub counting was undertaken at the Mackay site. The number of canegrubs was counted from digging up 20 stools within 20 m × 13 rows at a total of 56 sites, which were visited in 2012, 2013, or 2014. The sites were selected within areas prone to canegrub damage and based on access. Canegrub counting was conducted in March–April by digging up 20 cane plants from the four corners and the center of each 20 m × 13 row site. A shovel was used for each of the 20 digs to remove a 30-cm cube of soil containing the stool and the soil was inspected for canegrubs (Sallam et al. Citation2008). The minimum, maximum, first quantile (Q1), median, and third quantile (Q3) values of the number of canegrubs were related to the mapped canegrub damage likelihood categories, explained in Section 3.3.
3.2 Image data and preparation
Shapefiles of the sugarcane block boundaries, updated on an annual basis, were supplied by the sugarcane productivity services from each region. GeoEye-1 multispectral imagery (blue 450–510 nm, green 510–580 nm, red 655–690 nm, and near infrared 780–920 nm) of 2 m × 2 m pixels and panchromatic (450–800 nm) imagery of 0.50 m × 0.50 m pixels were acquired over the Mackay, Home Hill, and Gordonvale study sites. Generally, the visible symptoms of canegrub damage are most evident before harvest in June. However, canegrub activity and related detection of damage may vary and cloud cover may prevent the capture of image data at specific times, so to explore damage representation in the imagery at different times of the year, a number of additional images were collected during the three-year study. Image collection dates are listed in .
Table 1. GeoEye-1 image collection dates for the three study sites.
All images were first radiometrically corrected to represent Top of Atmosphere reflectance using provided image metadata and mean solar exoatmospheric irradiance values (Kuester Citation2017). Further atmospheric corrections were not undertaken due to the absence of detailed information on the atmospheric condition at the time of overpass. The Shuttle Radar Topography Mission Digital Elevation Model with 30-m pixels was then used together with the rational polynomial coefficients provided with the image data to orthorectify all the images. The images were then geometrically matched to the existing spatial layers with sugarcane block boundaries and previously collected images. All images were also pan-sharpened to achieve a multi-spectral image with a pixel size of 0.5 m. The Gram-Schmidt spectral sharpening process was used together with a bilinear resampling approach in the ENVI software, as this approach was found to best preserve the pixel values of the corrected multi-spectral image bands (Johansen et al., Citation2006; Yuhendra et al. Citation2012).
3.3 GEOBIA mapping of canegrub damage
Initial texture and spectral analysis showed that different cane varieties exhibited significant variation in texture and spectral reflectance. This is a result of different canopy architecture and spectral responses (Abdel-Rahman and Ahmed Citation2008). It was found essential to use adaptive thresholds based on statistical values, for example, set object quantiles as described below, for each individual sugarcane block to detect canegrub damage, as one specific threshold for one block appeared different to other blocks due to variation in varieties, growing conditions, and different grower management practices, and treatments. It was also found that light canegrub damage in cane varieties with a smooth texture may appear similar to some healthy cane varieties with a rougher texture. This suggested that damage assessment was required at the individual block level to eliminate effects of varying canopy architecture and spectral properties from different varieties and age groups of sugarcane. Thus, a GEOBIA approach was deemed most suitable to allow not only spectral and textural information to be used, but also contextual information, object shape information and analysis at multiple spatial scales (Blaschke, Citation2010; Johansen, Bartolo, and Phinn Citation2010).
The eCognition Developer 9.0 software was used to develop an approach for canegrub damage mapping by building a rule set of conditions based on the pan-sharpened GeoEye-1 imagery. The main focus of the segmentation process was on color rather than shape, as areas with canegrub damage did not exhibit specific shapes. A number of segmentation routines were applied. Firstly, objects were created at the sugarcane block level based on an existing shapefile, which allowed the detection and analysis of canegrub damage to be carried out block by block ()). Subsequently, all areas with sugarcane within the block boundaries were classified to exclude all non-sugarcane areas such as those associated with fallow crops and areas already harvested ()). This was done by setting a threshold of 0.35 of the Normalized Difference Vegetation Index (NDVI). Secondly, at a new level, the multiresolution segmentation algorithm (color: 0.9, shape: 0.1; compactness: 0.5) was applied with a scale parameter of 10 to divide each block into small homogenous objects to allow small patches of canegrub damage to be detected (Benz et al. Citation2004). Then, the spectral difference segmentation algorithm was used to merge neighboring homogenous objects (generally health cane) to reduce the overall number of objects ()). This improved the discrimination between objects consisting of healthy cane and potentially grub damaged cane.
Figure 3. (a) Image subset in the Gordonvale area with known canegrub damage; (b) block-boundary segmentation (yellow lines); (c) classification of fallow and sugarcane fields; (d) fine-scale segmentation (blue lines); (e) normalized difference vegetation index; (f) texture image; (g) classification of potential canegrub damage objects; and (h) classification of high, medium, and low likelihood of canegrub damage.
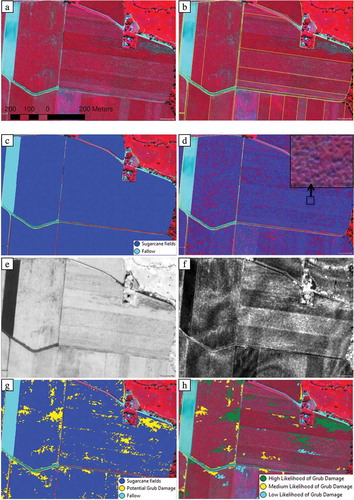
As canegrub damage is often manifested by reduced growth, stool tipping, and exposure of bare ground, sugarcane occurring within an object representing “canegrub damage” appeared less vigorous than healthy undamaged cane. Hence, a NDVI ()) was produced to identify those regions of a crop within the 30 quantile (30% of lowest values) of NDVI values. This threshold was empirically derived and applied at the block level to limit the influence of the varying cane varieties. An edge-detection filter was applied due to its sensitivity to the textural variations in canopy reflectance associated with canegrub damage. The various spectral bands and sigma values (distance of a data point from its mean in standard deviations) were assessed in a similar manner to Johansen et al. (Citation2007), and the red band with a sigma value of five was found to exhibit large textural differences between damage and non-damage areas. A Gaussian smoothing filter with a kernel size of 21 × 21 pixels was used to reduce noise and highlight areas with rough texture ()). Subsequently, the 70 quantile (30% of highest values) of the smoothed edge detection layer was used to identify rough texture as expected in damaged sites. The 70 quantile (30% of highest values) of the standard deviation of the red-band objects was also used to identify those areas with the roughest texture, potentially representing damaged cane. If objects within a block fulfilled all of the three conditions, for example, lowest 30% NDVI values and highest 30% texture values, the objects were considered to be potential canegrub damage ()).
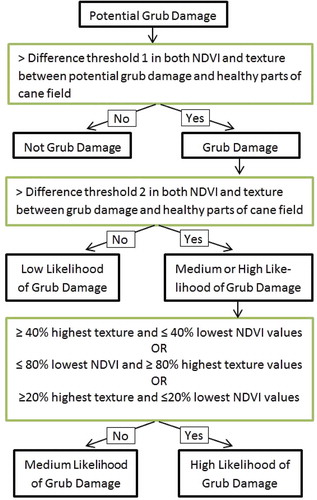
Since tracks within individual blocks were often incorrectly classified as canegrub damage, they were subsequently excluded by establishing processes that identified objects that appeared elongated, narrow, had smooth edges and had a direction of ±5° of the main block direction. As potential canegrub damage objects only represented those areas with the lowest NDVI values and roughest texture within each block at this stage in the mapping approach, it was considered important to assess the absolute NDVI and texture differences between potential canegrub damage objects and the remaining parts of each individual block. Hence, conditions were specified in the rule set to classify potential canegrub damage into low, medium, and high likelihood of an object representing canegrub damage. This was based on how different the NDVI and texture values were in relation to the remaining parts of the block. Potential canegrub damage objects with absolute differences below set thresholds in both NDVI and texture values were unclassified (). These thresholds were set based on the field training data. As no training data were available for the Burdekin site, the same thresholds as those used for the Gordonvale site were applied to the Burdekin site. The remaining potential damage objects, appearing with absolute differences in both NDVI and texture values above the set thresholds (in relation to the healthy parts of each block) were further grouped into low, medium and high likelihood of damage based on the level of differences of NDVI and texture values (). Another absolute difference threshold in both the NDVI and texture values, in relation to the healthy parts and other types of disturbance of each block, was set based on the field training data to discriminate canegrub damage with low likelihood from medium and high. The objects mapped as medium and high likelihood of canegrub damage were then split according to . These thresholds were set empirically to match the field training observations. Further refinements to the classification were also performed, e.g. by excluding very small objects (< 50 pixels). Also, low likelihood damage objects that were completely enclosed by high or medium likelihood damage objects were reclassified as high or medium likelihood canegrub damage, respectively ()). All images in were processed using the object-based mapping approach.
Figure 4. Categorising potential canegrub damage into low, medium, and high likelihood of canegrub damage.
3.4 Validation
Two types of field data were collected each year for the three-study sites: (1) canegrub damage location identified independently of the image data; and (2) types of damage at locations visually identified from the image data as potential canegrub damage. As the sample points predominantly included canegrub damage observations, it was only possible to calculate the producer’s accuracy and error of omission based on these field data. As the sample points visually selected from the imagery included both canegrub damage observations and observations of non-canegrub damage, it was possible to calculate both the user’s and producer’s accuracies from these field data. However, the measure of user’s accuracy and error of commission was deemed biased, because those sample points that were visually selected from the imagery were selected because they appeared as some kind of disturbance. Therefore, healthy-looking cane was not included in the assessment, which means that the calculation of user’s accuracy would be biased. The validation of the results, therefore, only reports on producer’s accuracy and error of omission. This was done by combining field observations collected independently of the image and the field observations at locations selected based on the image. Any field-based observation used for training purposes for the development of the eCognition Developer rule set was excluded from the validation process.
3.5 Canegrub damage risk mapping
Two automated risk mapping approaches were proposed and developed using the eCognition Developer software. Both of these were based on the mapping results of canegrub damage and served as example tools only and would need to be applied and validated in the future. The risk maps were developed based on input from and surveys of sugarcane growers.
The first mapping approach identified areas of medium and high likelihood of canegrub damage within each sugarcane block. It enabled the user to set thresholds for defining the level of future canegrub damage risk based on the spatial extent of damage within a block. For example, a block with < 5% mapped canegrub damage could be classified as no risk, with 5–10% mapped canegrub damage as low risk, with 10–15% mapped canegrub damage as medium risk, with 15–20% mapped canegrub damage as high risk, and very high risk if >20% of a block was mapped as canegrub damage. The thresholds can be adjusted based on local knowledge to meet the needs and risks of different regions.
The second risk mapping approach produced a map of no risk, low risk, medium risk, high risk, and very high risk based on the size of the areas with medium and high likelihood of canegrub damage as well as the distance to these areas. In this approach, all areas already classified as medium and high likelihood of canegrub damage were reclassified as “very high risk.” The following values represent an example only, which corresponds to the map provided in the results section. If the area of very high risk was > 200 m2, then concentric buffer zones were created surrounding the very high risk areas, with zones being progressively 25 m wide of high risk, 15 m wide of medium risk, and 10 m wide of low risk. For very high risk objects between 100 and 200 m2, concentric buffers of 15 m, 10 m, and 10 m of high, medium, and low risk, respectively, were produced. Finally, for very high risk objects between 25 and 100 m2, buffers of 5 m, 10 m, and 10 m of high, medium, and low risk, respectively, were produced. “Very high risk areas” (< 25 m2) were classified as low risk because of their limited extent. This approach was designed not to take into account breaks between the individual blocks, so that buffers representing various risk levels would be produced for neighboring blocks even if canegrub damage did not occur within those blocks. Thresholds in terms of object size and width of buffers can be adjusted based on local knowledge to meet the needs and risks of different regions.
4. Results and discussion
The results demonstrated that December images did not improve damage detection in the Mackay, Home Hill, and Gordonvale regions. It was found that only one image taken before harvest when canegrub damage is most pronounced in terms of stool tipping, change in leaf color, and exposure of ground was needed to adequately map canegrub damage (). Hence, to reduce the scope of this section, only the results from one image per site per year are included below.
Figure 5. (a) Original pan-sharpened GeoEye-1 image and (b) the corresponding map of canegrub damage.
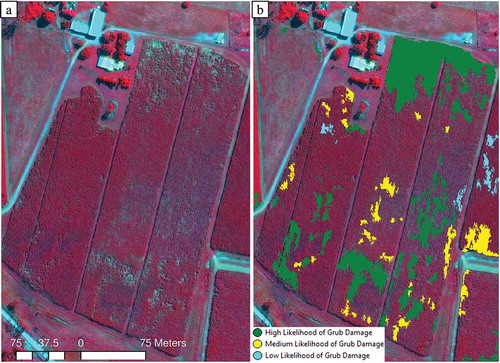
4.1. Mapping canegrub damage
For all three study sites, high producer’s accuracies were achieved, indicating that most areas that were identified with canegrub damage in the field were also mapped as having canegrub damage (–). This represents an extension of the work undertaken by Luna and Lobo (Citation2016), who used UAV data to map sugarcane canopy gaps but without labeling the cause of these gaps. Only little variation in the producer’s accuracies occurred from year to year. Omission errors mainly occurred in areas classified as low likelihood of canegrub damage, where symptoms were less distinct. Only 13 out of the 565 field assessed locations classified as medium and high likelihood of canegrub damage were incorrectly classified when taking all sites and years of data into account. The developed eCognition Developer rule set performed well for the Mackay and Gordonvale districts, whereas for the Home Hill area it was less successful because of the significant amount of sprawling due to the tall sugarcane in this region. In addition, Home Hill growers have been extensively implementing chemical control measures to combat canegrub damage, and this has significantly reduced canegrub populations in that region in recent years (Burdekin Productivity Service, Personal Communication). This resulted in greater commission errors for the Home Hill site.
Table 2. Measure of producer’s accuracy and error of omission for mapping low/medium/high likelihood of canegrub damage, respectively, in 2012, 2013, and 2014 for the Mackay site.
Table 3. Measure of producer’s accuracy and error of omission for mapping low/medium/high likelihood of canegrub damage, respectively, canegrub damage in 2012, 2013, and 2014 for the Gordonvale site.
Table 4. Measure of producer’s accuracy and error of omission for mapping low/medium/high likelihood of canegrub damage, respectively, in 2012, 2013, and 2014 for the Home Hill site.
Despite the lack of validation data to assess user’s accuracies, the commission error identified at some of the sites varied from year to year. For example, wind damage caused by Tropical Cyclone Ita in the Gordonvale area in 2014 increased the commission error, as wind damage in many cases had similar characteristics to canegrub damage before harvest. Also, sprawling, particularly in the Home Hill area, caused overestimation of potential canegrub damage. Other effects, for example, weed damage, pig damage, and rat damage, did also result in overestimation of canegrub damage. Hence, despite the feasibility of mapping canegrub damage using the developed mapping approach, other crop disorders may also be incorrectly classified as canegrub damage. However, cane growers may be able to take advantage of this information on other types of disturbance to improve their yield.
The two difference thresholds used to map low, medium, and high likelihood of cangrub damage in the eCogntion Developer rule set had to be adjusted from region to region and between different years because of distinct rainfall variations between years and locations. Also, differences in spectral and temporal manifestations of canegrub damage between years and the difference in sugarcane varieties, exhibiting differing spectral and textural characteristics, prevented complete model transferability between different years and regions. The adjustment of the difference thresholds based on calibration field data was required to reduce the error of commission caused by other sugarcane disturbance factors such as weeds, waterlogging, wind damage, sprawling, and pig damage. Collecting multi-temporal training data on vegetation characteristics and land-cover is a common approach used in many other studies for optimizing mapping results over time (e.g. Knauer et al. Citation2017). However, for monitoring overall sugarcane disturbance, the developed approach would be fully operational. While the developed rule set is complex, only minor modifications to the difference thresholds against calibration field data would be required for future implementation. It was found essential to use a multi-scale approach to automatically identify canegrub damage within each individual block rather than take a whole-of-image approach for setting difference thresholds. A multi-scale approach has been found important in other studies too to map the gap percentage in sugarcane (Luna and Lobo, Citation2016).
Using both spectral and textural information to identify canegrub damage was essential, as many areas with canegrub damage appeared with little difference in spectral information compared with healthy cane but large differences in textural characteristics, and vice versa. Hence, much of the canegrub damage would have been omitted in the mapping approach if only spectral or textural information had been used. Johansen et al. (Citation2007) reported increases in mapping accuracies of 2–19% when including image textural information for mapping forest structure. Wulder et al. (Citation2004) also highlighted the importance of using both spectral and textural information in vegetation studies, especially when using high spatial resolution image data.
Because of the large spectral variation at the pixel level both within healthy and damaged sugarcane, GEOBIA is the only suitable approach to detect canegrub damage when using high spatial resolution image data. The use of the multi-resolution and spectral difference segmentation algorithms enabled various object sizes to be produced for both healthy and damaged sugarcane at the segmentation-stage based on pixel spectral homogeneity. While the edge detection and Gaussian smoothing filters were applied at set kernel sizes for each individual pixel, the output image was assessed at the object level, as this significantly reduced the noise (Blaschke Citation2010), which is apparent in ). At the object level, the average pixel value and standard deviation of these for the spectral, textural, and derived bands such as vegetation indices provided a much more meaningful evaluation of spectral and textural characteristics and discrimination approach for classifying healthy and damaged sugarcane. However, the use of objects may in some cases have prevented the identification of small patches of canegrub damage, if the majority of an object consisted of pixels, representing healthy sugarcane, and hence affected the mapping accuracies of small patches of canegrub damage. On the other hand, most canegrub damaged areas showed a large level of spectral heterogeneity and were hence segmented into small objects, reducing the chances of affected the mapping accuracy by omitting small patches of canegrub damage. The use of objects instead of pixels also allowed a more meaningful use of adaptive thresholds to be set for discriminating healthy and damaged sugarcane, where the use of quantile values were calculated automatically for each sugarcane block using image object variables, for example, statistical measures calculated on the fly for each block and hence producing different values for each block assessed. This part of the mapping approach was very important because of the different spectral characteristics exhibited by different sugarcane varieties and associated canegrub damage.
4.2 Canegrub counting
shows that the areas classified as high or moderate likelihood (n = 47) of canegrub damage had significantly higher canegrub populations (p < 0.01) than those areas classified as low likelihood of canegrub damage or not detected (n = 9). Interestingly, areas classified as moderate likelihood of canegrub damage had higher first, median, and third quantile values of canegrubs detected in the field than the areas classified as high likelihood of canegrub damage. This could indicate that with the developed approach may not be able to effectively differentiate areas with moderate and high likelihood of canegrub damage. This also means that higher NDVI and/or texture differences in relation to neighboring healthy sugarcane do not necessarily mean that there are more canegrubs present. This suggests that once a set density of canegrubs is reached, the symptoms of damage do not necessarily become more visible in the satellite imagery with increasing densities of canegrubs within a growing season. However, this observation was only made for the Mackay area and hence may vary from other regions.
Table 5. Minimum, maximum, first quantile (Q1), median, and third quantile (Q3) values of the number of canegrubs found from digging up 20 stools within 20 m × 13 row areas at the Mackay site in 2012, 2013, and 2014 compared against the mapped likelihood of canegrub damage. The n = total number of samples per category. For the one sample classified as Low likelihood, no canegrubs were found.
4.3 Distribution and extent of mapped canegrub damage
The extent of sugarcane blocks varied from year to year and was based on the block boundary shapefiles provided by the individual mills/productivity services each year. Also, the presence of fallow blocks and clouds/cloud shadows at the time of the image capture resulted in a different number of blocks being assessed each year for each of the three study sites.
For the Mackay study site, the majority (> 55%) of all blocks occurred with less than 10% canegrub damage in 2012, 2013, and 2014. For Mackay, 2014 was the year with the least mapped canegrub damage and 2012 with the most mapped canegrub damage (). The three-week gap between the captures of satellite images on 26 May 2013 and 14 June 2013 did not result in any significant changes in the level of mapped canegrub damage. For the Home Hill study site, the three satellite image captures in 2013 (27 March, 26 May, and 17 June) showed apparent increases in the category of > 20% mapped canegrub damage and decreases in the categories of < 10% mapped canegrub damage between 27 March and 26 May (). We did not attribute this to increased levels of canegrub damage being detected, but rather to the large area of sprawling, occurring due to increased cane growth between 27 March and 26 May. Because of the plentiful availability of irrigation water in the Home Hill area, irrigated sugarcane grows very tall, and hence sprawling becomes more pronounced than in other rainfall-reliant regions. The levels of mapped damage decreased slightly in the 17 June image, as some of the sprawling cane was starting to grow upward again. Hence, the timing of image data collection for multi-temporal analysis can have a significant effect on the results in some sugarcane regions where sprawling is common. Xavier et al. (Citation2006) also found that multi-temporal analysis of sugarcane can be hampered by variations in phenology, land management practices, and large planting periods, resulting in blocks with differing growing stages. Sprawling, combined with the poor mapping accuracies for the Home Hill study site and the high levels of block treatment, indicates that the current mapping approach is not suitable for this area. The Gordonvale area showed a gradual reduction in canegrub damage mapped between 2012 and 2014 ().
Table 6. Area and proportion of blocks mapped with different areal extents of canegrub damage in 2012, 2013, and 2014 for the Mackay study site.
Table 7. Area and proportion of blocks mapped with different areal extents of canegrub damage in 2012, 2013, and 2014 for the Home Hill study site.
Table 8. Area and proportion of blocks mapped with different areal extents of canegrub damage in 2012, 2013, and 2014 for the Gordonvale study site.
4.4 Mapping canegrub damage risk
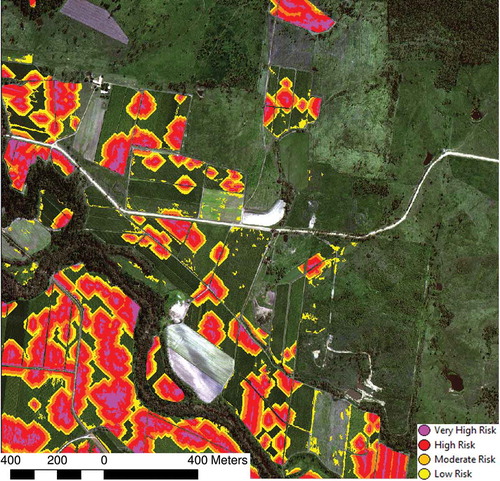
Mapping of canegrub risk was based on the canegrub damage map and hence relied on its mapping accuracy. However, for the map, which was designed to assess risk at the individual block level (), known commission errors may be present in some cases (e.g. rat or pig damage), and hence the thresholds set for risk identification can be adjusted to take that into account, for example, by increasing the thresholds. The risk map assessment at the individual block level () provides a general overview and hence presents a somewhat different picture than the second risk (). The second risk map was based on the distance and extent of mapped canegrub damage. The benefit of this risk mapping approach is its ability to assess risk across block boundary borders, which the individual block level assessment fails to do. This represents a more real-world scenario, where canegrubs do not respect block boundaries. Sallam and Lowe (Citation2012) found canegrub numbers to build up over a number of seasons, with damage in a previous crop and location being a strong indicator of subsequent damage. As greyback cane beetles are unlikely to lay their eggs in the exact same spot as they originated from, the use of buffers as risk indicator zones makes sense. However, research has shown that canegrubs may favor certain landscape and vegetation conditions such as early cane growth and sugarcane greenness which may be different between neighboring blocks (Horsfield, Logan, and Kettle Citation2002; Zellner et al. Citation2014). The second risk map () also provides information at a finer spatial scale than the first risk map (). While further research into canegrub behavior and distribution patterns may improve risk maps in the future, the two current approaches provide a tool for visualizing the likelihood of canegrub damage risk in the following growing season.
Figure 6. Risk map showing different extent of canegrub damage within each individual block.
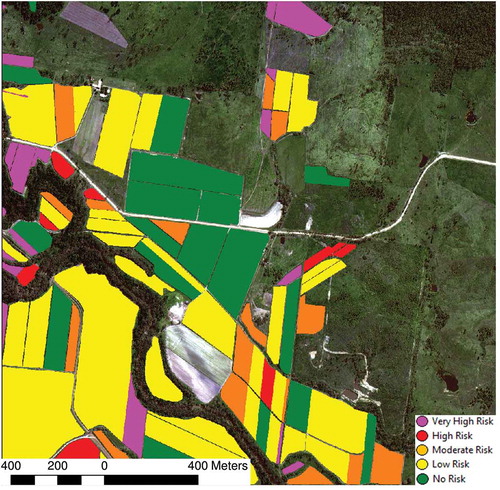
Figure 7. Risk map showing different levels of risk based on distance to mapped canegrub damage.
Geo-object-based modeling approaches are ideally suited for integrating ancillary data, such as vector layers and image derived data at different spatial resolutions (Tiede et al. Citation2010). Johansen et al. (Citation2014) identified further input parameters for potential use in a modeling approach of canegrub damage and risk. These included: (1) the distance to clusters and corridors of trees, as cane beetles feed on certain types of trees such as fig, acacia, and eucalypt trees (Zellner et al. Citation2014); (2) soil type; (3) distance to neighboring canegrub damage; (4) canegrub damage history; and (5) years since last chemical treatment of a block. Distance measures are easy to apply in a geo-object-based modeling approach. Soil type information could be integrated from a shapefile to form objects at a different scale level in a similar manner to how the sugarcane block boundaries were included in this research. Finally, other types of “site and context” information, such as landscape features (Morgan, Gergel, and Coops Citation2010) and the presence and density of trees suitable for cane beetle feeding, represent a perfect example of how a GEOBIA based modeling approach would excel compared to traditional pixel based approaches (Blaschke Citation2010). Hence, there is potential for improving the mapping results of both canegrub damage and risk, using geo-object-based modeling approaches in the future.
5. Conclusions
This research demonstrates that it is possible to use high-spatial resolution satellite image data and geographic object-based image analysis to map putative canegrub damage. Producer’s accuracies between 75% and 98.7% were achieved. Our in-field verification experience also demonstrates that putative detections should be confirmed in the field as canegrub damage before further response is undertaken. Our mapping approach of high-spatial resolution satellite image data allows potential damage sites to be quickly and accurately accessed to confirm presence of canegrub activity or identify an alternative reason for the growth constraint or disturbance observed. Areas classified incorrectly as canegrub damage did in most cases appear with some level of damage or growth constraint caused by the presence of weeds, sprawling, water inundation or rat, pig, and wind damage. Therefore, the mapping results may also be used to alert growers to where other types of growth constraints likely to reduce yield are occurring. The developed mapping approach was deemed less suitable for the Home Hill site, because of the extensive application of chemical treatment of sugarcane blocks to prevent canegrub damage and the very tall sugarcane, exhibiting extensive sprawling. Future work should focus on the ability to discriminate other types of damage, occurring in sugarcane fields and test other types of satellite image data, such as SPOT-6/7 and Planet CubeSat image data to assess if similar results may be obtained at lower costs. However, these datasets may omit small extent canegrub damage due to their lower spatial resolution although the daily repeat coverage of Planet CubeSat image data may provide further insight into spectral and textural changes and characteristics of canegrub damage during a sugarcane growth cycle. The results of this research will help sugarcane growers to manage and reduce damage caused by canegrubs and increase future production and yields. Future work should also focus to relating risk maps to actual canegrub damage mapped in the subsequent growing season.
Acknowledgments
Funding for this work was provided by Sugar Research Australia. Significant input and field assistance were provided by cane growers, productivity services, and mills from each of the three regions.
Disclosure statement
No potential conflict of interest was reported by the authors.
Additional information
Funding
References
- Abdel-Rahman, E. M., and F. B. Ahmed. 2008. “The Application of Remote Sensing Techniques to Sugarcane (Saccharum Spp. Hybrid) Production: A Review of the Literature.” International Journal of Remote Sensing 29 (13): 3753–3767. doi:10.1080/01431160701874603.
- Allsopp, P. G., K. J. Chandler, P. R. Samson, and P. G. Story. 1993. Pests of Australian Sugarcane. Brisbane: Bureau of Sugar Experiment Stations.
- Apan, A., A. Held, S. Phinn, and J. Markley. 2004. “Detecting Sugarcane ‘Orange Rust’ Disease Using EO-1 Hyperion Hyperspectral Imagery.” International Journal of Remote Sensing 25 (2): 489–498. doi:10.1080/01431160310001618031.
- Benz, U. C., P. Hofmann, G. Willhauck, I. Lingenfelder, and M. Heynen. 2004. “Multi-Resolution, Object-Oriented Fuzzy Analysis of Remote Sensing Data for GIS-ready Information.” ISPRS Journal of Photogrammetry and Remote Sensing 58: 239–258. doi:10.1016/j.isprsjprs.2003.10.002.
- Blaschke, T. 2010. “Object Based Image Analysis for Remote Sensing.” ISPRS Journal of Photogrammetry and Remote Sensing 65: 2–16. doi:10.1016/j.isprsjprs.2009.06.004.
- Chandler, K. J. 2002. “Strategies to Control Greyback Canegrub in Early Harvested Ratoon Crops.” SRDC Final Report SD02022, BSES, Indooroopilly.
- Duveiller, G., R. Lopez-Lozano, and B. Baruth. 2013. “Enhanced Processing of 1-Km Spatial Resolution fAPAR Time Series for Sugarcane Yield Forecasting and Monitoring.” Remote Sensing 5 (3): 1091–1116. doi:10.3390/rs5031091.
- Franke, J., and G. Menz. 2007. “Multi-Temporal Wheat Disease Detection by Multi-Spectral Remote Sensing.” Precision Agriculture 8 (3): 161–172. doi:10.1007/s11119-007-9036-y.
- Grof, C. P. L., and J. A. Campbell. 2001. “Sugarcane Sucrose Metabolism: Scope for Molecular Manipulation.” Australian Journal of Plant Physiology 28 (1): 1–12.
- Hay, G. J., D. J. Marceau, P. Dube, and A. Bouchard. 2001. “A Multiscale Framework for Landscape Analysis: Object-Specific Analysis and Upscaling.” Landscape Ecology 16: 471–490. doi:10.1023/A:1013101931793.
- Hay, G. J., G. Castilla, M. A. Wulder, and J. R. Ruiz. 2005. “An Automated Object-Based Approach for the Multiscale Image Segmentation of Forest Scenes.” International Journal of Applied Earth Observation and Geoinformation 7: 339–359. doi:10.1016/j.jag.2005.06.005.
- Hay, G. J., T. Blaschke, D. Marceau, and A. Bouchard. 2003. “A Comparison of Three Image-Object Methods for the Multiscale Analysis of Landscape Structure.” ISPRS Journal of Photogrammetry and Remote Sensing 57: 327–345. doi:10.1016/S0924-2716(02)00162-4.
- Horsfield, A., D. P. Logan, and C. G. Kettle. 2002. “Trap Crops for Management of Greyback Canegrub in the Burdekin.” Proceedings of the Australian Society of Sugar Cane Technologist, 24: 2013–2218.
- Johansen, K., A. Robson, P. Samson, N. Sallam, K. Chandler, L. Derby, and J. Jennings. 2014. “Mapping Whitegrub Damage in Sugarcane from High Spatial Resolution Satellite Imagery.” South-Eastern European Journal of Earth Observation and Geomatics 3 (2s): 549–553.
- Johansen, K., N. C. Coops, S. E. Gergel, and Y. Stage. 2007. “Application of High Spatial Resolution Satellite Imagery for Riparian and Forest Ecosystem Classification.” Remote Sensing of Environment 110 (1): 29–44. doi:10.1016/j.rse.2007.02.014.
- Johansen, K., R. Bartolo, and S. Phinn. 2010. “Special Feature – Geographic Object-Based Image Analysis.” Journal of Spatial Science 55: 3–7. doi:10.1080/14498596.2010.494653.
- Johansen, K., and S. Phinn. 2006. “Linking Riparian Vegetation Structure in Australian Tropical Savannas to Ecosystem Health Indicators: Semi-Variogram Analysis of High Spatial Resolution Satellite Imagery.” Canadian Journal of Remote Sensing 32 (3): 228–243. doi:10.5589/m06-020.
- Knauer, K., U. Gessner, R. Fensholt, G. Forkuor, and C. Kuenzer. 2017. “Monitoring Agricultural Expansion in Burkina Faso over 14 Years with 30 M Resolution Time Series: The Role of Population Growth and Implications for the Environment.” Remote Sensing 9 (2): 132. doi:10.3390/rs9020132.
- Kuester, M. A. 2017. Absolute Radiometric Calibration: 2016v0. USA: DigitalGlobe.
- Lobell, D. B. 2013. “The Use of Satellite Data for Crop Yield Gap Analysis.” Field Crops Research 143: 56–64. doi:10.1016/j.fcr.2012.08.008.
- Luna, I., and A. Lobo. 2016. “Mapping Crop Planting Quality In Sugarcane From Uav Imagery: A Pilot Study In Nicaragua.” Remote Sensing 8 (6), 500. “Mapping Crop Planting Quality In Sugarcane From Uav Imagery: A Pilot Study In Nicaragua.” doi:10.3390/rs8060500
- Morgan, J. L., S. E. Gergel, and N. C. Coops. 2010. “Aerial Photography: A Rapidly Evolving Tool for Ecological Management.” BioScience 60 (1): 47–59. doi:10.1525/bio.2010.60.1.9.
- Mulianga, B., A. Begue, M. Simoes, and P. Todoroff. 2013. “Forecasting Regional Sugarcane Yield Based on Time Integral and Spatial Aggregation of MODIS NDVI.” Remote Sensing 5 (5): 2184–2199. doi:10.3390/rs5052184.
- Rahman, M. M., and A. Robson. 2016. “A Novel Approach for Sugarcane Yield Prediction Using Landsat Time Series Imagery: A Case Study on Bundaberg Region.” Advances in Remote Sensing 5 (2): 93–102. doi:10.4236/ars.2016.52008.
- Robson, A., C. Abbott, D. Lamb, and R. Bramley. 2012. “Developing Sugar Cane Yield Algorithms from Satellite Imagery.” Proceedings of the Australian Society of Sugar Cane Technologists, Cairns, Australia, May 1-4.
- Robson, A., M. M. Rahman, G. Falzon, N. K. Verma, K. Johansen, N. Robinson, R. Lakshmanan, B. Salter, and D. Skocaj. 2016. “Evaluating Remote Sensing Technologies for Improved Yield Forecasting and for the Measurement of Foliar Nitrogen Concentration in Sugar Cane.” International Sugar Journal 118 (1416): 679–705.
- Robson, A. J. 2007. “Remote sensing applications for the determination of yield, maturity and aflatoxin contamination in Peanut.” Ph.D. diss., University of Queensland, Australia.
- Sallam, N. 2011. “Review of Current Knowledge on the Population Dynamics of Dermolepida Albohirtum (Waterhouse) (Coleoptera: Scarabaeidae).” Australian Journal of Entomology 50: 300–308.
- Sallam, N., and G. Lowe. 2012. “Implementation of a Risk Assessment Program to Forecast Greyback Canegrub Damage in Mulgrave Sugarcane Fields.” Proceedings of the Australian Society of Sugar Cane Technologist 34: 98–106.
- Sallam, N., P. R. Samson, G. D. Puglisa, J. I. Bull, and D. A. Donald. 2008. “Sampling Statistics and Population Dynamics of Greyback Canegrubs in Sugarcane Fields: A Case Study.” Proceedings of the Australian Society of Sugar Cane Technologist 30: 182–192.
- Samson, P., K. Chandler, and N. Sallam. 2012. GrubPlan 2012 – Options for Greyback Canegrub Management. Brisbane: BSES Limited, Technical Publication, MN12001.
- Tiede, D., S. Lang, F. Albrecht, and D. Holbling. 2010. “Object-Based Class Modeling for Cadaster-Constrained Delineation of Geo-Objects.” Photogrammetric Engineering and Remote Sensing 76 (2): 193–202. doi:10.14358/PERS.76.2.193.
- Vieira, M. A., A. R. Formaggio, C. D. Rennó, C. Atzberger, D. A. Aguiar, and M. P. Mello. 2012. “Object Based Image Analysis and Data Mining Applied to a Remotely Sensed Landsat Time-Series to Map Sugarcane over Large Areas.” Remote Sensing of Environment 123: 553–562. doi:10.1016/j.rse.2012.04.011.
- Wiegand, C. L., and A. J. Richardson. 1991. “Vegetation Indices in Crop Assessments.” Remote Sensing of Environment 35 (2–3): 105–119. doi:10.1016/0034-4257(91)90004-P.
- Wulder, M. A., R. J. Hall, N. Coops, and S. Franklin. 2004. “High Spatial Resolution Remotely Sensed Data for Ecosystem Characterization.” Bioscience 54: 511−521. doi:10.1641/0006-3568(2004)054[0511:HSRRSD]2.0.CO;2.
- Xavier, A. C., B. F. T. Rudolff, Y. E. Shimabukuro, L. M. S. Berka, and M. A. Moreira. 2006. “Multi-Temporal Analysis of MODIS Data to Classify Sugarcane Crop.” International Journal of Remote Sensing 27 (4): 755–768. doi:10.1080/01431160500296735.
- Yang, C., and J. H. Everitt. 2002. “Relationships between Yield Monitor Data and Airborne Multidate Multispectral Digital Imagery for Grain Sorghum.” Precision Agriculture 3 (4): 373–388. doi:10.1023/A:1021544906167.
- Yuhendra, Y., I. Alimuddin, J. T. S. Sumantyo, and H. Kuze. 2012. “Assessment of Pan-Sharpening Methods Applied to Image Fusion of Remotely Sensed Multi-Band Data.” International Journal of Applied Earth Observation and Geoinformation 18 (1): 165–175. doi:10.1016/j.jag.2012.01.013.
- Zellner, P., C. Lelong, V. Soti, A. Tran, N. Sallam, A. Robson, and F.-R. Goebel. 2014. “A Remote Sensing and GIS Approach to the Relationship between Canegrub Infestations and Natural Vegetation in the Sugarcane Landscape of Queensland, Australia.” Landscape Management for Functional Biodiversity, IOBC-WPRS Bulletin 100: 153–158.
- Zhang, M., X. Qui, and X. Liu. 2005. “Remote Sensed Spectral Imagery to Detect Late Blight in Field Tomatoes.” Precision Agriculture 6 (6): 489–508. doi:10.1007/s11119-005-5640-x.