
 ?Mathematical formulae have been encoded as MathML and are displayed in this HTML version using MathJax in order to improve their display. Uncheck the box to turn MathJax off. This feature requires Javascript. Click on a formula to zoom.
Abstract
Advances in the development of Earth observation data acquisition systems have led to the continuously growing production of remote sensing datasets, for which timely analysis has become a major challenge. In this context, distributed computing technology can provide support for efficiently handling large amounts of data. Moreover, the use of distributed computing techniques, once restricted by the availability of physical computer clusters, is currently widespread due to the increasing offer of cloud computing infrastructure services. In this work, we introduce a cloud computing approach for object-based image analysis and classification of arbitrarily large remote sensing datasets. The approach is an original combination of different distributed methods which enables exploiting machine learning methods in the creation of classification models, through the use of a web-based notebook system. A prototype of the proposed approach was implemented with the methods available in the InterCloud system integrated with the Apache Zeppelin notebook system, for collaborative data analysis and visualization. In this implementation, the Apache Zeppelin system provided the means for using the scikit-learn Python machine learning library in the design of a classification model. In this work we also evaluated the approach with an object-based image land-cover classification of a GeoEye-1 scene, using resources from a commercial cloud computing infrastructure service provided. The obtained results showed the effectiveness of the approach in efficiently handling a large data volume in a scalable way, in terms of the number of allocated computing resources.
1. Introduction
During the course of the past few decades, outstanding advances were achieved in the development of Earth observation (EO) remote sensing (RS) data acquisition systems. Developments in sensor technology were responsible for a continuous increase in spatial and spectral resolution of optical sensors, and similar progress was seen in radar- and laser-based imaging. The number and variety of EO platforms have also grown significantly, considering especially the dissemination of unmanned aerial vehicles and the development of small-scale orbital platforms.
The direct result of such technological advances is the daily production of massive amounts of RS data. The NASA EOSDIS project, for instance, produces about 12 TB of data daily (NASA, Citation2018). This scenario leads to new challenges, related to the capacity of handling huge volumes of data with respect to computational techniques and resources (Lee and Kang Citation2015). In this sense, remote sensing data handling may be considered a big data problem (Ma et al. Citation2015; Jadhav Citation2013).
In spite of being the focus of much attention over the last decade, the term “big data” is still not clearly defined (Chen, Mao, and Liu Citation2014). In general, it is associated to datasets with massive volumes that cannot be easily captured, stored and manipulated by traditional hardware, software and database technologies (Li et al. Citation2016). Nevertheless, big data is often, and somewhat consensually, described by its basic characteristics: volume, velocity and variety (Laney Citation2001); although other Vs have been later proposed and associated to the term: variability, validity, volatility, visibility, value, and visualization.
Considering the remote sensing domain, the rapidly increasing volume of EO data, the increasing spatial resolution and massive archives, raise not only data storage issues but also important analysis issues (Dasgupta Citation2013). The variety of EO related data: structured and unstructured, raster and vector, maps and imagery; calls for more efficient data management strategies and technologies (Li et al. Citation2016). The velocity of data production: the increase in the temporal resolution of EO systems and continuous streaming of sensor observations; require matching the speeds of data generation and of data processing to meet demand (Dasgupta Citation2013).
In this context, distributed computing technology can provide valuable support for efficiently handling large RS datasets, as data can be partitioned into smaller subsets, which are processed in parallel by different computing units. Moreover, the use of distributed computing techniques, once restricted by the availability and access to physical computer clusters, is currently widespread, as the offer of cloud computing infrastructure services at affordable costs has become commonplace (Fernández et al. Citation2014).
Cloud computing delivers powerful, scalable infrastructure for the processing of large-scale datasets. In a cloud environment, a set of virtual computing components is delivered on demand, offering data access transparency and elastic provisioning of fail-safe resources in a pay-as-you-go service model (Ferreira et al. Citation2017).
Furthermore, many works in the past two decades have exposed both the limitations of pixel-based techniques in the analysis of high spatial resolution RS image data, and the advantages of object-based image analysis (GEOBIA) (Blaschke Citation2010; Blaschke et al. Citation2014). Rather than dealing with individual pixels, object-based approaches aim at classifying image segments through the analysis of their attributes, which may include spectral, textural or morphological characteristics and topological relationships among segments.
The capacity of dealing with georeferenced raster and vector data is essential to GEOBIA approaches. But handling these types of data in a distributed environment is not a trivial matter (Costa et al. Citation2017). The major problem has to do with distributing segments and image data while keeping track of their spatial relationships, and, at the same time, minimizing communication among processing nodes when performing spatially-aware operations.
Recently, Ferreira et al. (Citation2017) proposed and evaluated a set of methods that support distributed object-based operations, such as the computation of spectral, morphological and topological properties, and knowledge-driven classification. Some of those methods were employed in the construction of a tile-based distributed image segmentation method, introduced by Happ et al. (Citation2016), and of a machine learning distributed classification framework (Quirita et al. Citation2017). The methods proposed in Ferreira et al. (Citation2017) were implemented using the MapReduce programming model (Dean and Ghemawat Citation2008), in a system called InterCloud.
In this work, we combine different distributed methods in an approach that allows object-based image interpretation of very large remote sensing images. For that, we build upon the InterCloud framework, and investigate its integration with a cloud-based notebook interface system, the Apache Zeppelin (Citation2017), which supports collaborative data analytics and visualization, and provides for the execution and evaluation of data processing commands and workflows over distributed data. In the proposed object-based classification scheme, a comprehensive machine learning software library, the scikit-learn Python library (Scikit-learn Citation2017), supports data exploration and experimentation with different classification techniques. Furthermore, we evaluated the proposed approach on an urban land-cover object-based image interpretation application, executed in a cloud computing infrastructure environment.
The main contributions of this work are:
We introduce a cloud computing approach for object-based image analysis and classification of arbitrarily large remote sensing data sets.
We propose a way of exploiting machine learning methods in the definition of classification models for remote sensing data, through the use of a collaborative, web-based notebook interface system.
We present the evaluation of an implementation of the proposed approach on a land-cover classification application, executed over cloud computing infrastructure, considering its potential scalability.
The remainder of this paper is organized as follows. Related work regarding distributed georeferenced spatial data processing is presented in Section II. The components and processing steps of the proposed approach are presented in Section III. The design of the experiments devised to evaluate an implementation of the proposed approach are presented in Section IV. The experimental results are presented and discussed in Section V. Section VI presents conclusions and directions for future research.
2. Related work
Over the last decade, an increasing number of works have focused on tackling the big data problem in the RS domain, in many application fields, such as: flood response decision (Tan et al. Citation2017), land-cover change detection (Wu et al. Citation2017), and coastal land use (Ding et al. Citation2017). However, it is still considered an open issue and one of the most important challenges for the RS community (Chen et al. Citation2018).
Efficient handling and analysis of hyperspectral imagery have been the focus of a number of works that address the big data problem relying on cloud computing resources (Haut et al. Citation2017; Wu et al. Citation2016; Li et al. Citation2015; Cappelaere et al. Citation2013). Management of point clouds, acquired by laser scanners or photogrammetry, using cloud computing infrastructure was also the theme of some recent works (Pajic, Govedarica, and Amovic Citation2018; Boehm, Liu, and Alis Citation2016; Liu, Boehm, and Alis Citation2016). Object detection in high resolution imagery, has also been the focus of some interesting works that make use of deep learning methods, such as (Han, Zhong, and Zhang Citation2017a; Han et al. Citation2017b).
Different distributed solutions have been proposed aiming at efficiently handling large volumes of RS data. To name a few, the work of Golpayegani and Halem (Citation2009) implements distributed image analysis operations but focuses only on raster data. Wei et al. (Citation2015) propose a method based on k-d trees to partition big datasets among computing worker nodes in a virtualized environment; however, the method is used only for point data in a Kriging interpolation task. The work of Chen et al. (Citation2012) focuses on coupling the OpenGIS Web Processing Service (WPS) with a distributed cloud-based processing environment; the work is, however, restricted to pixel-based analysis. Tan et al. (Citation2015) developed an agent-based geospatial service chain. There are other studies that focus on RS image analysis (Lv et al. Citation2010; Liu et al. Citation2012; Almeer Citation2012), but they also only support pixel-based analyses.
Relatively few studies so far have proposed techniques for storing and querying large geo-information datasets (Cary et al. Citation2009; Lu and Guting Citation2012; Zhong et al. Citation2012). Systems like Hadoop-GIS (Aji et al. Citation2013) and SpatialHadoop (Eldawy and Mokbel Citation2015) offer complete spatial data storage and spatial query execution, but they do not handle image data.
Google recently deployed a web-based service, the Google Earth Engine (GEE) (Gorelick et al. Citation2017), which is capable of integrating raster and vector RS image data processing. As a proprietary system, however, GEE’s underlying framework and methods are not disclosed, what hinders scientific investigation and collaboration. Additionally, although GEE’s usage is currently free of charge, its business model is obscure, and there is no guaranty that in the future Google starts charging for the service.
Furthermore, GEE makes the cloud computing infrastructure needed to execute an application transparent to the user, which precludes analyses about the scalability of the underlying methods, and prevents users to choose from the many available cloud-based infrastructure providers, such as Microsoft Azure, IBM’s SoftLayer, Alibaba Cloud, or even private clouds.
Finally, although we believe it may be possible to implement a framework such as InterCloud on top of GEE (not without considerable effort), the methods available in InterCloud already support many of the most important OBIA processes, such as segmentation, feature extraction and classification; and integrate well with a hierarchical semantic modelling that is familiar to many researchers in Earth Sciences.
Regarding machine learning, few works focusing on distributed handling of big EO datasets can be found in the literature (Aggarwal Citation2015), but they are more concerned with the training phase than with the classification procedure itself. Quirita et al. (Citation2017) proposed a distributed architecture for supervised classification of large EO datasets, which supports the integration of machine learning methods. In that work, however, the proposed architecture is employed in pixel-based, hyperspectral image analysis.
To the best of our knowledge, the work of Ferreira et al. (Citation2017), which introduces the methods implemented in InterCloud, is the only available open solution that supports distributed object-based RS image analysis in the cloud. Image segmentation in the application reported in Ferreira et al. (Citation2017) was performed off-line, i.e., not in a distributed fashion.
Lastly, a literature search did not reveal any work that supports object-based, distributed RS image analysis, integrated with a web-based notebook infrastructure, such as Apache Zeppelin, for data mining and classification modeling.
3. Method
The proposed methodology consists of five main steps, organized in the processing chain depicted in : (a) segmentation; (b) computation of features; (c) sample selection; (d) classification modeling; and (e) classification.
Figure 1. Processing chain of the proposed approach. The shaded processes were executed off-line.
After distributed segmentation, a number of feature values of the generated segments are computed in a distributed way. Then, in an off-line procedure, representative samples of the classes of interest are selected, and this reference set is subsequently used in the generation of a classification model, also off-line. The final step is the distributed classification of the complete set of segments.
In this work, processes (a), (b) and (e) were carried out with InterCloud. InterCloud is implemented using Java, Pig and Hadoop MapReduce on the cloud. The sample selection procedure (c) was performed manually with the aid of the QuantumGIS system. The classification modeling procedure (d) was carried out with the aid of a Zeppelin notebook and the scikit-learn Python library.
Note that after the classification model has been generated, the classification process can be carried out in a batch mode, using only procedures (a), (b) and (e). This could be the case if the object-based classification process, counting on the same classification model, would be executed for another geographic area, covered by a RS image with similar characteristics, i.e., acquired by the same sensor.
In the next sections, we detail the processing chain steps.
2.1. Distributed segmentation
The distributed segmentation procedure was performed using the method described in Happ et al. (Citation2016), which is implemented in the InterCloud system. The method comprises a strategy for performing region-growing segmentation in a distributed environment. The strategy tackles the distributed segmentation by (a) splitting an input image into tiles, in order to generate independent datasets for distributed computing; (b) performing region-growing segmentation independently for each tile; and (c) efficiently stitching neighboring segments that touch the tile borders, thus eliminating the artifacts, i.e., straight segment outline sections over tile borders, resulting from the independent distributed segmentations. Moreover, the distributed region-growing strategy is scalable and capable of efficiently handling very large RS images.
The method offers three alternatives for stitching segments that touch tile borders: Simple Post-Processing (SPP); Hierarchical Post-Processing (HPP); and Hierarchical Post-Processing with Re-segmentation (HPPR). The latter alternative is more time consuming than the others, but it is able to deliver artifact-free results, which is the reason why it was selected for the implementation of the proposed approach.
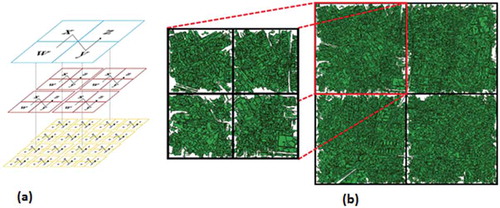
The HPPR involves iterative processing through the levels of the quad-tree formed by a hierarchy of geo-cells: a geographical grid based on a given coordinate reference system, which defines the dimensions of the image tiles ((a)). The HPPR solution relies on iterative steps to allow merging adjacent bordering segments from different tiles. Basically, it groups all segments that touch the borders of geo-cells at one iteration, and then discards those segments to generate new ones by performing the region-growing procedure over the pixels once covered by the discarded segments. This procedure is performed iteratively until the coarser geo-cell level is reached, i.e., the one in which the input image is covered by a single geo-cell. (b) illustrates the process over two consecutive geo-cell levels: green segments have already grown and white segments should be re-segmented.
Figure 2. Hierarchy of geo-cells and the HPPR method. (a) different levels of the quad-tree formed by a hierarchy of geo-cells. (b) HPPR applied over two consecutive geo-cell levels: bordering segments, in white, are discarded and subjected to a new region-growing procedure.
The particular region-growing segmentation algorithm implemented in InterCloud’s distributed segmentation module in based on the multiresolution region-growing algorithm proposed in Happ et al. (Citation2016), which considers every pixel as a region-growing seed and supports the use of spectral and morphological homogeneity criteria in the definition of the segment merging rule.
2.2. Computation of features
The computation of feature (or property) values of the segments generated in the previous step was also implemented with InterCloud (Ferreira et al. Citation2017). The main design concern in the set of methods devised for the system was the capacity of distributing the processing of raster (i.e., image tiles) and vector (i.e., image segments) data in such a way that the communication overhead among distributed processes is as small as possible (Costa et al. Citation2017).
InterCloud’s underlying methods (Ferreira et al. Citation2017) rely on a specific spatial indexing mechanism, which is based on a geographic grid, so-called geo-cell grid, defined over a selected coordinate reference system, as mentioned in the previous section. Besides determining the division of the input image data into image tiles, the geo-cells are also used to index the image segments they overlap. If a segment overlaps more than one geo-cell, it may be replicated for each overlapping geo-cell and indexed accordingly. There are also different geo-cell levels that are used to group image segments for particular distributed operations.
A set of distribution strategies define different ways to process (i.e., group, retrieve, and replicate) image tiles and segments for different types of operations. Four distribution strategies were proposed in (Ferreira et al. Citation2017) to support distribution of object-based operations: spatial-blind; spatial aware with replication; spatial aware without replication; and recursive. The recursive strategy supports image segmentation, as described in the previous section. The other three strategies support, among other capabilities, the computation of segment features.
Spatial-blind feature computation operations include the calculation of morphological features, such as area, compactness, asymmetry, rectangular fit, and so on. Such operations do not need to consider the spatial locality of the input segments, which are processed independently.
The spatial aware with replication strategy supports operations that rely on the spatial location of data, such as the calculation of spectral and topological features. Segments are replicated for all the geo-cells they intersect and then grouped by geo-cell. For each segment in a group, the computation is performed considering only the intersection between the segment and the corresponding image tile. Those partial results are later combined to produce the operations’ final results.
The spatial aware without replication strategy is used in multiscale analysis operations. It also relies on spatial locality, but segments are not replicated. Initially, segments are grouped by their parent segment ID rather than by geo-cells. Hierarchical features can be computed once a parent segment and its child segments are gathered on the same cluster node. Aggregated features can be computed based on any feature child segments have in common.
2.3. Sample selection
To support the classification modeling step of the proposed approach, an appropriate number of samples of each class of interest needs to be selected. In this work, the samples correspond to image segments, generated in the segmentation step. The selection of segment samples, representative of each class was performed visually, by overlaying the input image with the borders of the segments produced in the segmentation step (Section III.A). The procedure was performed off-line, on a desktop computer, using the QuantumGIS software. The main reason for performing this procedure off-line was saving up on cloud resources, once it is a very time consuming task.
The sample selection step was carried out in an interactive fashion, regarding the classification step. This means that candidate samples were evaluated by taking into consideration the whole set of samples, in the attempt of determining a set of samples for each class that best represent its within-class variability, and detecting outliers. In this work, the procedure generated 30 to 60 samples per class.
2.4. Classification modeling
The classification modeling step is responsible for the analysis of the feature space, and the creation of a classification model for one or more classes of interest.
In this work we propose the use of a web-based notebook interface system as a tool to experiment with different classification methods, so as to support the definition of the particular classification model, of a particular image interpretation application.
In short, interactive web-based notebooks enable data analysts to develop, organize, execute, and share data code without needing to care about cluster details. A notebook is a place for data ingestion, discovery, analytics, visualization and collaboration. The notebook concept is used in this work for supporting users to explore the input data space (which consists of image segments’ attributes), and to experiment with different classification techniques.
In this research we adopted the Apache Zeppelin notebook system. Zeppelin was devised as a tool for data scientists to collaborate on large-scale data exploration and visualization projects. In a practical sense, data processed by the integrated interpreter systems can be analyzed visually with the aid of customized graphs and charts, organized in a virtual notebook.
Zeppelin is currently deployed with pre-created interfaces for many distributed data processing systems and programing languages, such as Beam, Cassandra, ElasticSearch, Flink, Groovy, Pig, PostgreSQL, Python, R, and many more (Apache Zeppelin Citation2017). Additionally, new interpreters can be attached to the notebook interface through its application programming interface (API).
In this work, we used a powerful machine learning Python library, scikit-learn, for the definition of the classification model. The scikit-learn library is considered one of the most popular machine learning libraries among all programing languages, as it is a collaborative, open-source initiative, and contains a large number of methods for data mining and data analysis (Scikit-learn Citation2017).
So, after making the scikit-learn library available in the cloud environment (i.e., installing it in the cluster node dedicated for this task), we are able to execute the methods in the library over the distributed data (in this case, segment samples), by simply stating the respective Python commands in the Zeppelin notebook graphical user interface (GUI).
In this work, the decision tree classification method available in scikit-learn was used for classification modeling. We selected this method because it would be easier to design decision rules, illustrating a complete processing chain. In this sense, a decision tree was inducted through the algorithm, and the corresponding classification rules (based on thresholding feature values) compose the classification model.
It is worth mentioning that it is not mandatory to use classification rules on this proposed approach. In fact, it would be possible to use any supervised classification method integrated with the system, as shown in (Quirita et al. Citation2017).
2.5. Classification
After the classification model was defined in the previous step, it was translated into classification decision rules in InterCloud, so that the actual classification of all image segments can be carried out.
One classification rule, combining all sharp decisions based on the feature values thresholds defined in the classification tree, was created for each class, in the form of Pig Latin (Gates Citation2011) scripts, which are interpreted by InterCloud’s engine during distributed classification execution, which is a spatial-blind operation in terms of what was stated in Section III.B.
4. Experimental setup
To validate and evaluate the proposed approach, experiments were performed using a virtual cluster in a commercial cloud computing infrastructure. In the experiments, a land-cover classification application of a very high-resolution optical satellite image was carried out, with various computer cluster configurations.
4.1. Cloud environment
The experiments were conducted over cloud computing infrastructure provided by Amazon Web Services (AWS). Amazon Simple Storage Service (S3) was used to store the input and output data, as well as the required programs and libraries. Amazon Elastic MapReduce (EMR) was used to dynamically build and manage clusters of Amazon Elastic Compute Cloud (EC2) instances. EC2 instances were of type m3.large virtual machines, having Intel Xeon E-5–2670 v2 processors operating at 2.5GHz with a 64-bit architecture, 15 GB of RAM and 2 disks with 40GB using SSD technology. Each processor has 4 physical cores and 8 logical cores. All machines have Apache Hadoop 2.73 and Apache Pig 0.14.0 installed.
In the experiments, the batch classification procedure, which encompasses the segmentation (a); features computation (b); and classification (e) steps of the proposed approach was executed in computer clusters of different sizes: with 2, 4, 8, 16 and 32 virtual machines. It is important to mention that one cluster node is reserved for the Hadoop JobTracker (the master node), which is responsible for scheduling and managing the tasks and is not available for performing other processing tasks.
For the classification modeling (d) step, two similar, additional virtual machines were used to run the Apache Zeppelin notebook system and the scikit-learn Python library functions. The following Python modules were installed on those machines: NumPy 1.8.2; SciPy 0.13.3; and scikit-learn 0.19.1 (which requires the first two modules).
4.2. Test site and image data
The test site is in the Goianésia municipality, in the state of Goiás, Central-East Region of Brazil. The site contains dense to sparse urban areas, surrounded by farmland with small patches of natural (forested) vegetation.
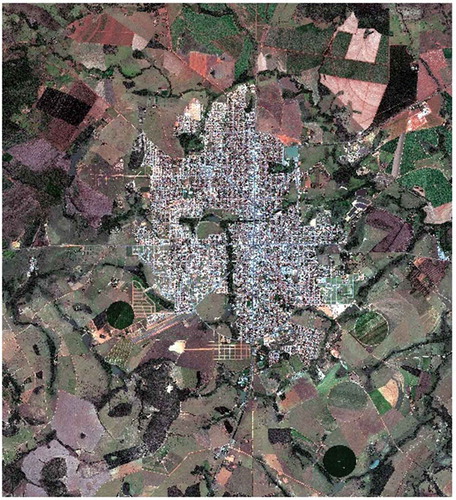
For the land-cover classification, eleven classes were considered: asbestos roofs; asphalt; bare soil; concrete pavement; dark ceramic roofs; low vegetation; light ceramic roofs; metallic roofs; shadows; and water bodies. The input image was acquired in 2013 by the GeoEye-1 sensor (). The image has four spectral bands (blue, green, red and infra-red), each with 0.5 × 0.5m pixel resolution. The image dimensions in pixels are 9,404 × 21,360 pixels.
Figure 3. RGB composition of the GeoEye-1 image used in the experiments.
4.3. Segmentation
Distributed segmentation was performed with the InterCloud system, using the hierarchical post-processing with re-segmentation technique (see Section III.A). The tile size was set to 512 × 512 pixels, resulting in a total of 1,677 tiles.
The region-growing segmentation parameter values were selected empirically as: 60 (scale); 0.5 (color weight); and 0.6 (compactness weight). The segmentation procedure running with those parameters generated a total of 239,156 segments.
4.4. Feature computation
For each segment produced with the distributed segmentation procedure, the following 24 feature values were computed. Spectral features: brightness; mean intensity value in each of the four bands; maximum and minimum intensity value in each band; ratio intensity values of all bands; mean value in the infra-red band divided by the mean value in the blue band; and mean value in the infra-red band divided by the mean value in the red band. Morphological features: area; mean angle; compactness; squareness; and roundness.
4.5. Sample selection
After the segmentation step, a total of 510 sample/reference segments were carefully selected, with the aid of the QuantumGIS software. The sample selection procedure was carried out by a specialist well acquainted with the test area.
A total of 50 samples were selected for each class, but the concrete pavement and water bodies classes, for each of which 30 segments were selected. The reason for selection of less samples for these two classes was the scarcity of representative areas.
4.6. Classification modeling
The method from the scikit-learn library used for generating the decision tree for classification was the DecisionTreeClassifier method. The method was executed having as inputs 75% of the samples for training, and 25% for testing.
5. Results and discussion
The thematic accuracy assessment was performed using 765 evaluation samples, each sample corresponding to an image pixel. The number of samples was determined according to Congalton and Green (Citation1999), considering a multinomial distribution (Equation (1)).
where: N is number of samples; B was obtained from the chi-square distribution table with (1-α)/k degrees of freedom; (1-α) is the confidence level; k is the number of classes; Πi is the relative proportion of the class covering the largest area on the map (outcome of automatic interpretation); and b is the admissible error level.
The parameter values used in Equation (1) were: B = 8.052; Πi = 0.388 (Low Vegetation); (1-α) = 0.95; k = 11; b = 0.05.
After determining the number of samples to be selected, the positions of the 765 sample points (pixels) were determined randomly, using the Quantum GIS software. Afterwards, the land-cover class associated with each test point was determined by visual inspection of the input image. This procedure was performed off-line, on a desktop computer, by a specialist on the test area. Such assessment supported the construction of a confusion matrix (), from which per class commission and omission error values were computed.
Figure 4. Classification confusion matrix.
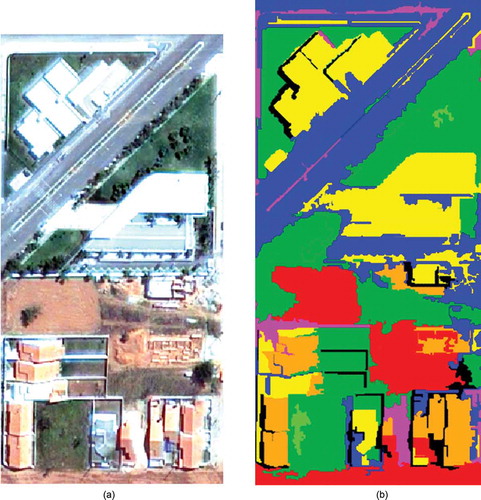
The global accuracy obtained in the classification experiments was 0.86, which is considered a satisfactory result based on the number of classes and the classification algorithm used. The thematic map produced with the classification results is shown in . shows a subset of the thematic map, together with the corresponding image subset.
Figure 5. Thematic map with the object-based classification outcome.
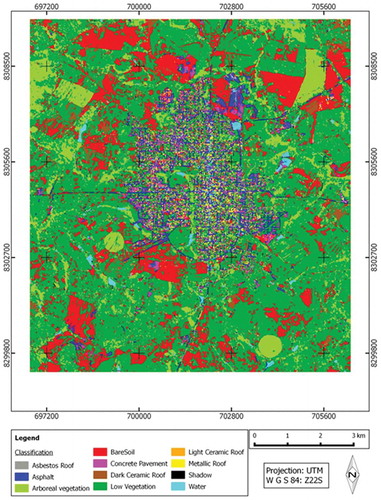
Figure 6. Detailed close-up of the input image (a) and corresponding classification result (b).
It is important to note that regardless of the number of nodes and configuration of the virtual cluster, the exact same segmentation and classification results were achieved. This indicates the robustness of the approach with respect to scaling cluster resources. It is also worth mentioning that the classification results would be similar, but possibly not exactly the same if compared to a serial procedure. This is mainly due to slight differences in the segmentation process, which is generally considered an ill posed problem, i.e., for which there is no unique solution (Cardoso and Corte-Real Citation2005). In fact, even human photo-interpreters diverge when delineating segments (Hay and Castilla Citation2008). This subject has been widely addressed in many works in the literature (Zhang, Fritts, and Goldman Citation2008; Neubert, Herold, and Meinel Citation2008; Costa, Foody, and Boyd Citation2018). It was also investigated and discussed in terms of the distributed segmentation outcome in (Happ et al. Citation2016), which shows how close the results of the distributed segmentation are from a particular sequential version.
In order to evaluate the scalability of the proposed approach, the batch distributed classification procedure, which comprises steps (a), (b) and (e) of the approach (see ), was executed six times, each time with a virtual cluster with different number of processing nodes: 2, 4, 8, 16 and 32. shows the processing times associated with each cluster configuration.
Figure 7. Processing times associated with the segmentation, feature computation and classification steps of the proposed approach.
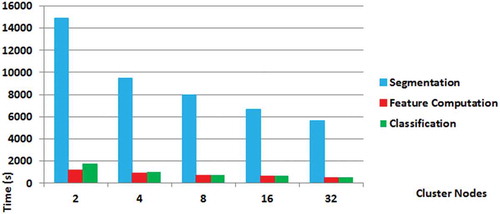
shows that the more expensive step in terms of time consumption is segmentation, which is also the step that benefits the most by scaling up cluster resources. The figure also shows that the corresponding speedups do not increase linearly as the number of processing units increase. Such nonlinear effects are common in parallel systems: as more processing units are used, the workload of each unit decreases and the parallelization overhead becomes more pronounced.
It is worth mentioning that, since the current interpretation project could not be executed in a single machine, an assessment considering sequential execution of the processing chain was not possible. Therefore, the analysis was limited to the variation of the number of nodes that compose the virtual cluster in the cloud environment.
6. Conclusion
In this work, we introduced a cloud computing approach for object-based image analysis and classification of arbitrarily large RS data sets. The approach enables machine learning methods to be exploited in the modeling of classification models, through the use of a web-based notebook system. The proposed approach was implemented with the methods available in the InterCloud system, which were integrated with the Apache Zeppelin notebook system, providing support for collaborative data analytics and visualization. Moreover, the Apache Zeppelin system provided the means for exploiting the scikit-learn Python machine learning when creating a particular classification model.
We evaluated the implementation of the proposed approach with a land-cover object-based image interpretation application, carried out over a large GeoEye-1 scene, using virtual clusters from a commercial cloud computing infrastructure service provided. The results obtained showed the effectiveness of the approach in efficiently handling a fairly large data volume in a scalable way, in terms of the number of allocated computing resources.
Although the application used for experimental evaluation consists of a straightforward supervised classification, we believe that through the use of the notebook system in a collaborative way the approach can be used to devise highly complex classification problems, combining machine learning and structural classification rules based on prior knowledge.
As future research, we envisage exploiting different machine learning methods, through the integration of alternative software libraries, combined with fuzzy or crisp production rules to produce complex classification models.
Another interesting topic for future research is the development of a method for automatically determining and instantiating the optimal number of cluster nodes for the different processes that take part in the image interpretation workflow, or for dynamically allocating or dismissing resources according to instantaneous processing loads, i.e. autoscaling. Such method could be used to balance operational performance needs, speeding up processing and saving computing costs.
Finally, we would like to stress that the proposed approach was entirely implemented with open-source tools, thus providing a base for scientific collaboration and further research by other groups.
Disclosure statement
No potential conflict of interest was reported by the authors.
References
- Aggarwal, C. 2015. Data Classification: Algorithms and Applications. New York, USA: Chapman and Hall/CRC.
- Aji, A., F. Wang, H. Vo, R. Lee, X. Zhang, and J. Saltz. 2013. “Hadoop GIS: A High Performance Spatial Data Warehousing System over MapReduce.” Proceedings VLDB Endowment 6: 1009–1020. doi:10.14778/2536222.2536227.
- Almeer, M. H. 2012. “Cloud Hadoop Map Reduce for Remote Sensing Image Analysis. ” Journal of Emergency Trends Computation Information Sciences 3: 637–644.
- Apache Zeppelin. 2017. “Interpreters in Apache Zeppelin [Online].” Accessed 15 August 2017. https://zeppelin.apache.org/docs/0.7.3/manual/interpreters.html
- Blaschke, T. 2010. “Object Based Image Analysis for Remote Sensing.” ISPRS Journal Photogramm Remote Sensing 65: 2–16. doi:10.1016/j.isprsjprs.2009.06.004.
- Blaschke, T., G. J. Hay, M. Kelly, S. Lang, P. Hofmann, E. Addink, R. Feitosa, et al. 2014. “Geographic Object-Based Image Analysis–Towards a New Paradigm.” ISPRS Journal of Photogrammetry and Remote Sensing 87: 180–191. doi:10.1016/j.isprsjprs.2013.09.014.
- Boehm, J., K. Liu, and C. Alis. 2016. “Ingestion of Large Point Clouds into the Apache Spark Big Data Engine.” ISPRS International Archives Photogramm Remote Sens Spat Information Sciences XLI-B2: 343–348. doi:10.5194/isprsarchives-XLI-B2-343-2016.
- Cappelaere, P., S. Sanchez, S. Bernab, A. Scuri, D. Mandl, and A. Plaza. 2013. “Cloud Implementation of a Full Hyperspectral Unmixing Chain within the NASA Web Coverage Processing Service for EO-1.” IEEE Journal of Selected Topics in Applied Earth Observations and Remote Sensing 6: 408–418. doi:10.1109/jstars.2013.2250256.
- Cardoso, J. S., and L. Corte-Real. 2005. “Toward a Generic Evaluation of Image Segmentation.” IEEE Transactions on Image Processing 14 (11, November): 1773–1782. doi:10.1109/TIP.2005.854491.
- Cary, A., Z. Sun, V. Hristidis, and N. Rishe. 2009. “Experiences on Processing Spatial Data with MapReduce.” In: : Scientific and Statistical Database Management, edited by Winslett M. SSDBM 2009. Lecture Notes in Computer Science, Vol. 5566. 302–319, Berlin, Heidelberg: Springer. doi:10.1007/978-3-642-02279-1_24.
- Chen, G., Q. Weng, G. J. Hay, and Y. He. 2018. “Geographic Object-Based Image Analysis (GEOBIA): Emerging Trends and Future Opportunities.” GIScience & Remote Sensing 55 (2): 159–182. doi:10.1080/15481603.2018.1426092.
- Chen, M., S. Mao, and Y. Liu. 2014. “Big Data: A Survey.” Mobile Networks Applications 19 (2): 171–209. doi:10.1007/s11036-013-0489-0.
- Chen, Z., N. Chen, C. Yang, and L. Di. 2012. “Cloud Computing Enabled Web Processing Service for Earth Observation Data Processing.” IEEE Journal of Selected Topics in Applied Earth Observations and Remote Sensing 5: 1637–1649. doi:10.1109/JSTARS.2012.2205372.
- Congalton, R. G., and K. Green. 1999. Assessing the Accuracy of Remotely Sensed Data: Principles and Practices. Boca Raton, USA: Lewis Publisher.
- Costa, G. A. O. P., R. S. Ferreira, C. Bentes, R. Q. Feitosa, and D. A. B. Oliveira. 2017. “Exploiting Different Types of Parallelism in Distributed Analysis of Remote Sensing Data.” IEEE Geoscience and Remote Sensing Letters 14: 1298–1302. doi:10.1109/lgrs.2017.2709700.
- Costa, H., G. M. Foody, and D. S. Boyd. 2018. “Supervised Methods of Image Segmentation Accuracy Assessment in Land Cover Mapping.” Remote Sensing of Environment 205: 338–351. doi:10.1016/j.rse.2017.11.024.
- Dasgupta, A. 2013. “Big Data: The Future Is in Analytics.” Geospatial World 3 (9): 28–36.
- Dean, J., and S. Ghemawat. 2008. “MapReduce: Simplified Data Process on Large Clusters.” Communicable ACM 51: 107–113. doi:10.1145/1327452.1327492.
- Ding, Z., X. Liao, F. Su, and D. Fu. 2017. “Mining Coastal Land Use Sequential Pattern and Its Land Use Associations Based on Association Rule Mining.” Remote Sensing 9: 116. doi:10.3390/rs9020116.
- Eldawy, A., and M. F. Mokbel. 2015. “Spatialhadoop: A Mapreduce Framework for Spatial Data.” In: Proc. 31st Int. Conf. Data Eng. Seoul, 1352–1363. doi:10.1109/icde.2015.7113382.
- Fernández, A., S. Del Río, V. López, A. Bawakid, M. J. Del Jesus, J. M. Benítez, and F. Herrera. 2014. “Big Data with Cloud Computing: An Insight on the Computing Environment, MapReduce, and Programming Frameworks.” Wiley Interdisciplinary Reviews: Data Mining and Knowledge Discovery 4: 380–409. doi:10.1002/widm.1134.
- Ferreira, R. S., C. Bentes, G. A. O. P. Costa, D. A. B. Oliveira, P. N. Happ, R. Q. Feitosa, and P. Gamba. 2017. “A Set of Methods to Support Object-Based Distributed Analysis of Large Volumes of Earth Observation Data.” IEEE Journal of Selected Topics in Applied Earth Observations and Remote Sensing (JSTARS) 10: 681–690. doi:10.1109/jstars.2016.2636362.
- Gates, A. 2011. Programming Pig. Sebastopol, CA, USA: O’Reilly Media.
- Golpayegani, N., and M. Halem. 2009. “Cloud Computing for Satellite Data Processing on High End Compute Clusters.” IEEE International Conference Cloud Computation 88–92. doi:10.1109/cloud.2009.71.
- Gorelick, N., M. Hancher, M. Dixon, S. Ilyushchenko, D. Thau, and R. Moore. 2017. “Google Earth Engine. Planetary-Scale Geospatial Analysis for Everyone.” Remote Sensing of Environment 202 (Supplement C): 18–27. doi:10.1016/j.rse.2017.06.031.
- Han, X., Y. Zhong, L. Cao, and L. Zhang. 2017b. “Pre-Trained AlexNet Architecture with Pyramid Pooling and Supervision for High Spatial Resolution Remote Sensing Image Scene Classification.” Remote Sensing 9: 848. doi:10.3390/rs9080848.
- Han, X., Y. Zhong, and L. Zhang. 2017a. “An Efficient and Robust Integrated Geospatial Object Detection Framework for High Spatial Resolution Remote Sensing Imagery.” 2017. Remote Sensing 9: 666. doi:10.3390/rs9070666.
- Happ, P. N., G. A. O. P. Costa, C. Bentes, R. Q. Feitosa, R. S. Ferreira, and R. Farias. 2016. “A Cloud Computing Strategy for Region-Growing Segmentation.” IEEE Journal of Selected Topics in Applied Earth Observations and Remote Sensing 9: 5294–5303. doi:10.1109/jstars.2016.2591519.
- Haut, J. M., M. Paoletti, J. Plaza, and A. Plaza. 2017. “Cloud Implementation of the K-Means Algorithm for Hyperspectral Image Analysis.” Journal of Supercomputing 73: 514–529. doi:10.1007/s11227-016-1896-3.
- Hay, G. J., and G. Castilla. 2008. “Geographic Object-Based Image Analysis (GEOBIA): A New Name for A New Discipline.” In: Object-Based Image Analysis. Lecture Notes in Geoinformation and Cartography, edited by T. Blaschke, S. Lang, and G. J. Hay. Berlin, Heidelberg: Springer. 75–89.
- Jadhav, D. K. 2013. “Big Data: The New Challenges in Data Mining.” International Journal of Innovative Research in Computer Science and Technology 1: 39–42.
- Laney, D. 2001. “3D Data Management: Controlling Data Volume, Velocity, and Variety.” Application Delivery Strategies. <http://blogs.gartner.com/douglaney/files/2012/01/ad949-3D-Data-Management-Controlling-Data-Volume-Velocity-and-Variety.pdf>
- Lee, J. G., and M. Kang. 2015. “Geospatial Big Data: Challenges and Opportunities.” Big Data Research 2: 74–81. doi:10.1016/j.bdr.2015.01.003.
- Li, S., S. Dragicevic, F. A. Castro, M. Sester, S. Winter, A. Coltekin, C. Pettit, et al. 2016. “Geospatial Big Data Handling Theory and Methods: A Review and Research Challenges.” ISPRS Journal of Photogrammetry and Remote Sensing 115: 119–133. doi:10.1016/j.isprsjprs.2015.10.012.
- Li, Y., Z. Wu, J. Wei, A. Plaza, J. Li, and Z. Wei. 2015. “Fast Principal Component Analysis for Hyperspectral Imaging Based on Cloud Computing.” In: Proc. IEEE International Geoscience and Remote Sensing Symposium (IGARSS), Milan, 513–516. doi:10.1109/IGARSS.2015.7325813.
- Liu, K., J. Boehm, and C. Alis. 2016. “Change Detection of Mobile LIDAR Data Using Cloud Computing.” ISPRS International Archives Photogramm Remote Sens Spat Information Sciences XLI-B3: 309–313. doi:10.5194/isprsarchives-XLI-B3-309-2016.
- Liu, Y., L. Chen, W. Xiong, L. Liu, and D. Yang. 2012. “A MapReduce Approach for Processing Large-Scale Remote Sensing Images.” In: Proc. 20th Int. Conf. Geoinformat, 1–7. doi:10.1109/Geoinformatics.2012.6270312.
- Lu, J., and R. H. Guting. 2012. “Parallel Secondo: Boosting Database Engines with Hadoop.” In: Proc. IEEE 18th Int. Conf. Parallel Distrib. Syst, Singapore, 2012, 738–741. doi:10.1109/icpads.2012.119.
- Lv, Z., Y. Hu, H. Zhong, J. Wu, B. Li, and H. Zhao. 2010. “Parallel K-Means Clustering of Remote Sensing Images Based on MapReduce.” In: Web Information Systems and Mining, edited by Wang F.L., Gong Z., Luo X., Lei J. WISM 2010. Lecture Notes in Computer Science, vol 6318. 162–170. Berlin, Heidelberg: Springe. doi:10.1007/978-3-642-16515-3_21
- Ma, Y., H. Wu, L. Wang, B. Huang, R. Ranjan, A. Zomaya, and W. Jie. 2015. “Remote Sensing Big Data Computing: Challenges and Opportunities.” Future Generation Computer Systems 51: 47–60. doi:10.1016/j.future.2014.10.029.
- NASA EARTHDATA. 2018. “EOSDIS FY2017. Annual Metrics Report [online].” Accessed 15 January 2018. https://earthdata.nasa.gov/about/system-performance/eosdis-annual-metrics-reports
- Neubert, M., H. Herold, and G. Meinel. 2008. “Assessing Image Segmentation Quality – Concepts, Methods and Application.” In: Object-Based Image Analysis. Lecture Notes in Geoinformation and Cartography, edited by T. Blaschke, S. Lang, and G. J. Hay. 769–784. Berlin, Heidelberg: Springer.
- Pajic, V., M. Govedarica, and M. Amovic. 2018. “Model of Point Cloud Data Management System in Big Data Paradigm.” ISPRS International Journal Geo-Information 7: 265. doi:10.3390/ijgi7070265.
- Quirita, V. A. A., G. A. O. P. Costa, P. N. Happ, R. Q. Feitosa, R. D. S. Ferreira, D. A. B. Oliveira, and A. Plaza. 2017. “A New Cloud Computing Architecture for the Classification of Remote Sensing Data.” IEEE Journal of Selected Topics in Applied Earth Observations and Remote Sensing 10: 409–416. doi:10.1109/jstars.2016.2603120.
- Scikit-learn. 2017. “Documentation [online].” Accessed 15 september 2017. http://scikit-learn.org/stable/documentation.html
- Tan, X., L. Di, M. Deng, A. Chen, F. Huang, C. Peng, M. Gao, Y. Yao, and Z. Sha. 2015. “Cloud-And Agent-Based Geospatial Service Chain: A Case Study of Submerged Crops Analysis during Flooding of the Yangtze River Basin.” IEEE Journal of Selected Topics in Applied Earth Observations and Remote Sensing 8: 1359–1370. doi:10.1109/jstars.2014.2376475.
- Tan, X., S. Guo, L. Di, M. Deng, F. Huang, X. Ye, Z. Sun, W. Gong, Z. Sha, and S. Pan. 2017. “Parallel Agent-as-a-Service (P-Aaas) Based Geospatial Service in the Cloud.” Remote Sensing 9: 382. doi:10.3390/rs9040382.
- Wei, H., Y. Du, F. Liang, C. Zhou, Z. Liu, J. Yi, … D. Wu. 2015. “A K-D Tree-Based Algorithm to Parallelize Kriging Interpolation of Big Spatial Data.” GIScience & Remote Sensing 52 (1): 40–57. doi:10.1080/15481603.2014.1002379.
- Wu, K., Q. Du, Y. Wang, and Y. Yang. 2017. “Supervised Sub-Pixel Mapping for Change Detection from Remotely Sensed Images with Different Resolutions.” Remote Sensing 9: 284. doi:10.3390/rs9030284.
- Wu, Z., Y. Li, A. Plaza, J. Li, F. Xiao, and Z. Wei. 2016. “Parallel and Distributed Dimensionality Reduction of Hyperspectral Data on Cloud Computing Architectures.” IEEE Journal of Selected Topics in Applied Earth Observations and Remote Sensing 9: 2270–2278. doi:10.1109/JSTARS.2016.2542193.
- Zhang, H., J. E. Fritts, and S. A. Goldman. 2008. “Image Segmentation Evaluation: A Survey of Unsupervised Methods.” Computer Vision and Image Understanding 110 (2): 260–280. doi:10.1016/j.cviu.2007.08.003.
- Zhong, Y., J. Han, T. Zhang, Z. Li, J. Fang, and G. Chen. 2012. “Towards Parallel Spatial Query Processing for Big Spatial Data.” In: IEEE Proc. 26th Int. Parallel Distrib. Process. Symp. Workshops Ph.D. Forum, Shanghai, 2085–2094. doi:10.1109/ipdpsw.2012.245.